pith. sign in

arxiv: 2607.00182 · v1 · pith:TAJWSS5Nnew · submitted 2026-06-30 · ✦ hep-ex

High-mass new scalars at the LHC, with H in the final state

Pith reviewed 2026-07-02 00:34 UTC · model grok-4.3

classification ✦ hep-ex
keywords LHC searchesnew scalarsHiggs bosonATLASCMSRun-2 datasetresonant productioncharged Higgs
0
0 comments X

The pith

Searches at the LHC limit the existence of high-mass new scalars that include a Higgs boson in their decay chains.

A machine-rendered reading of the paper's core claim, the machinery that carries it, and where it could break.
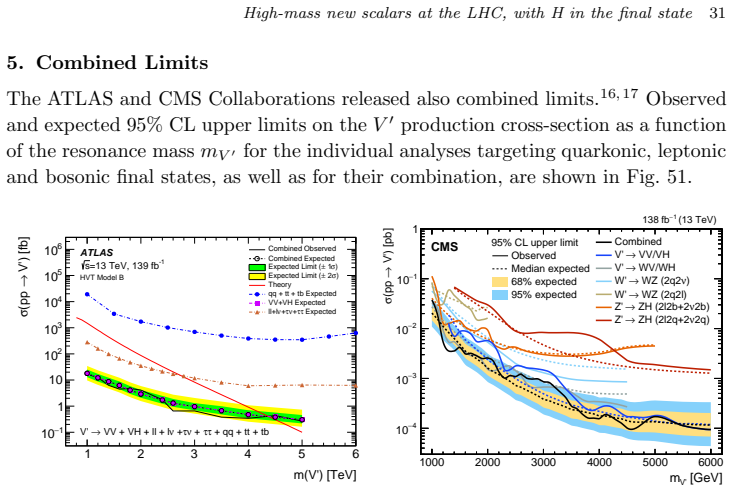
This paper reviews experimental searches by the ATLAS and CMS collaborations for new heavy scalar particles produced at the LHC whose decay chains include a Higgs boson. It examines three topologies using the full Run-2 dataset and part of the Run-3 dataset: resonant production of a heavy scalar X decaying to a Higgs plus a lighter scalar S, a heavy neutral Higgs decaying to another neutral Higgs plus a Z boson, and a heavy charged Higgs decaying to a neutral Higgs plus a W boson. The review assembles the resulting exclusion limits on masses and couplings. A reader would care because these results test whether the Higgs sector of the Standard Model is complete or requires additional scalar particles.

Core claim

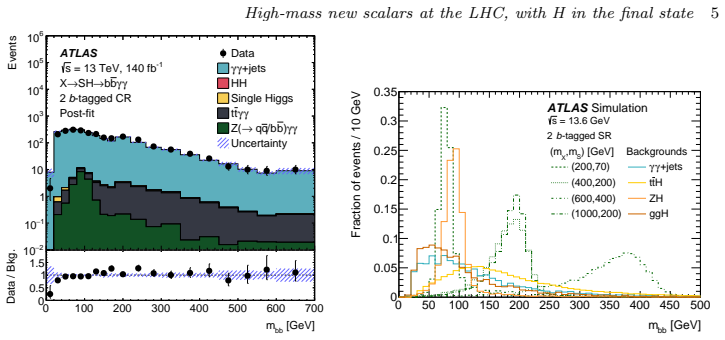
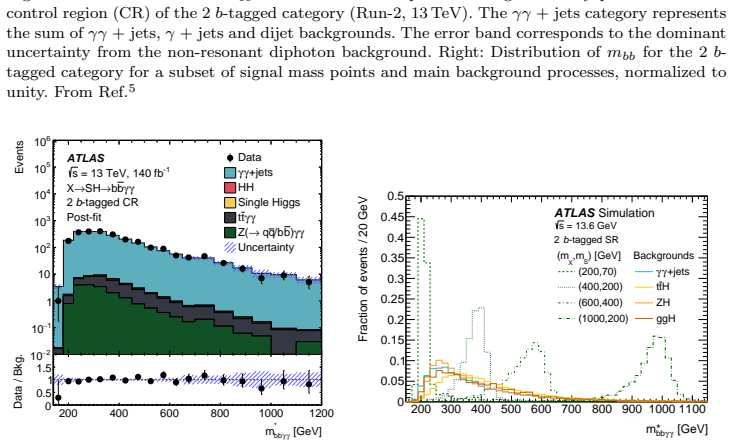
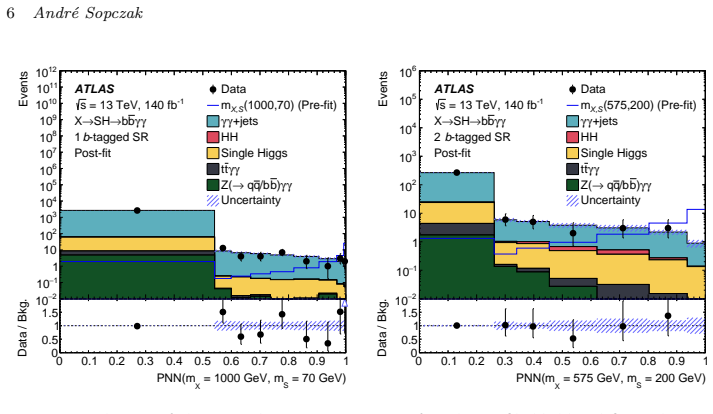
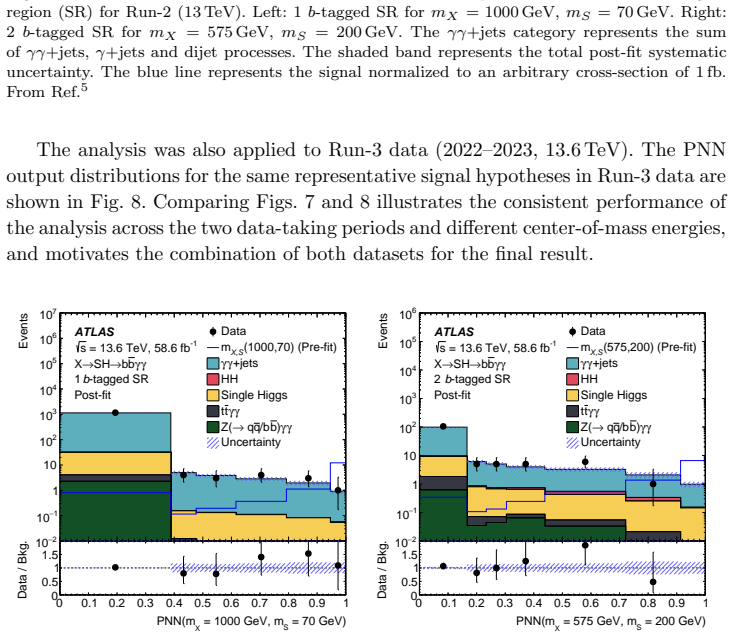
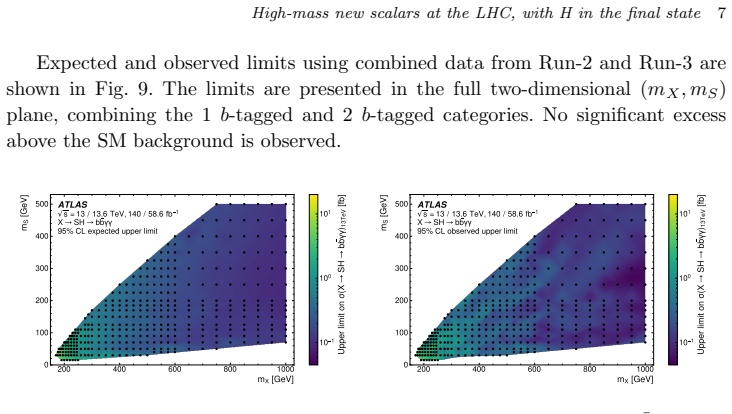
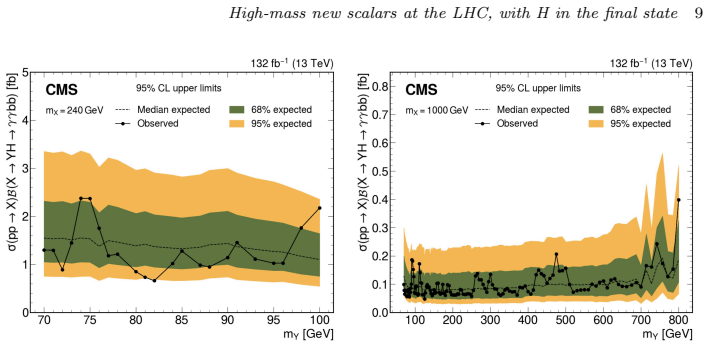
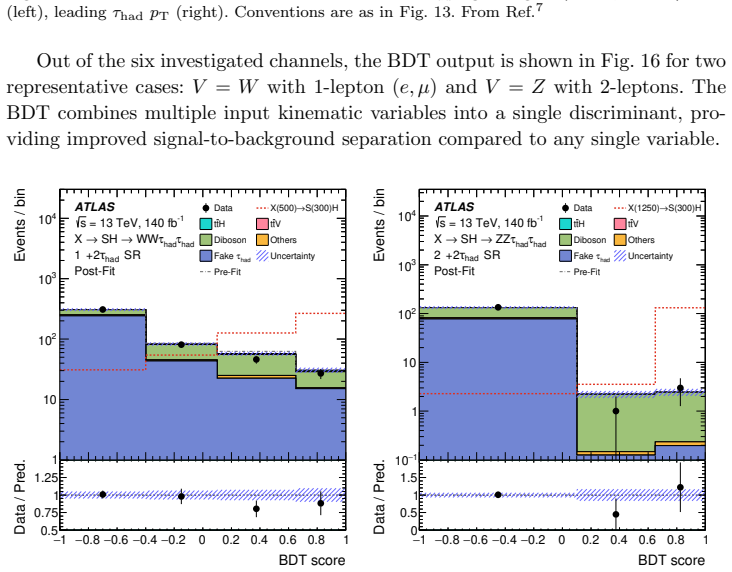
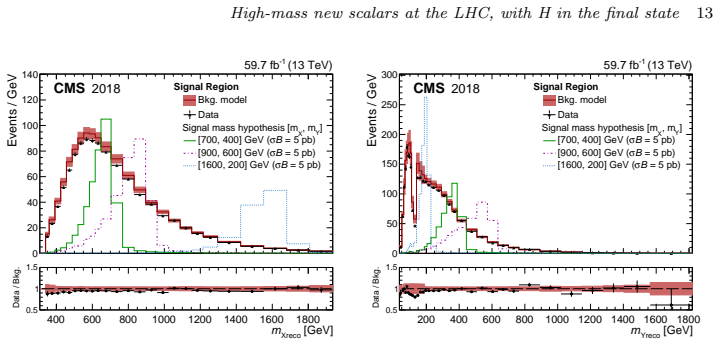
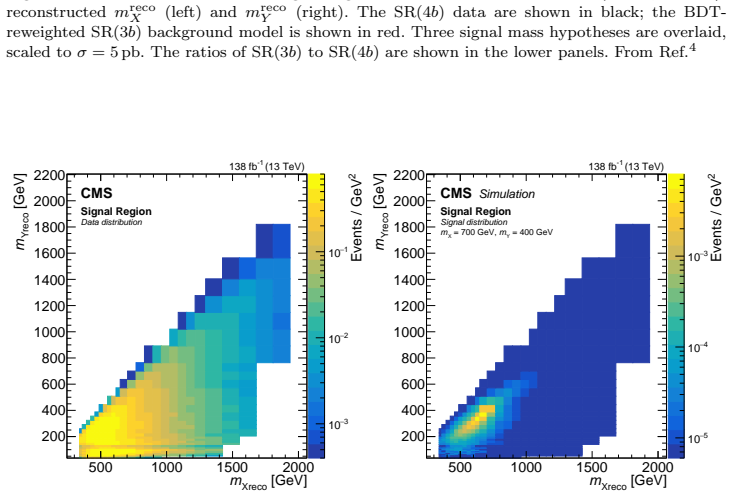
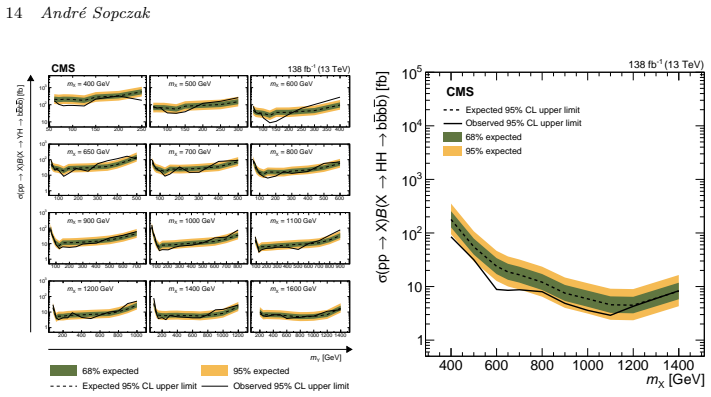
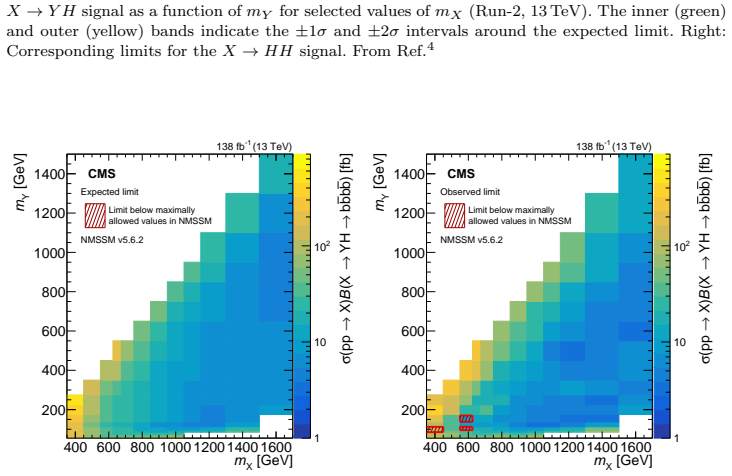
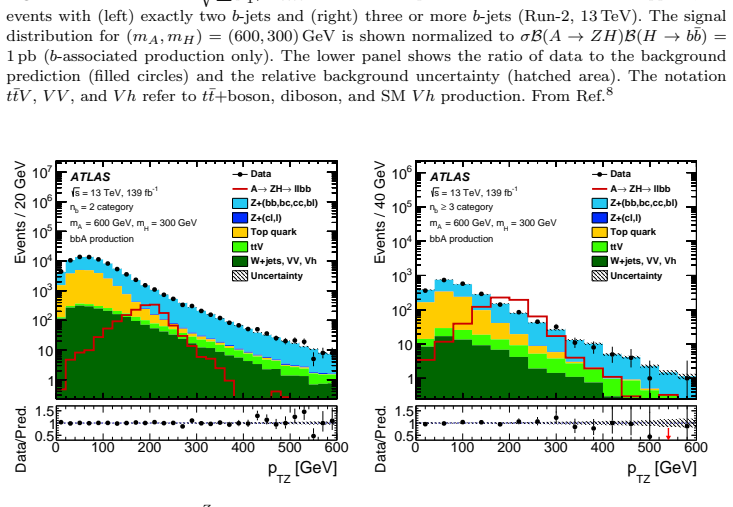
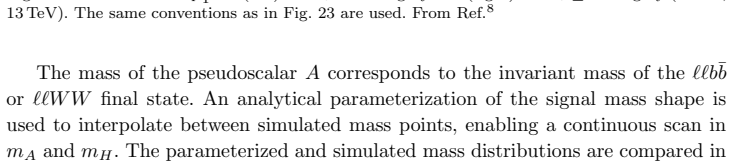
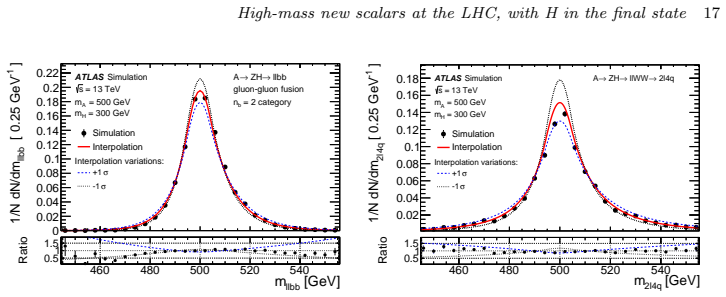
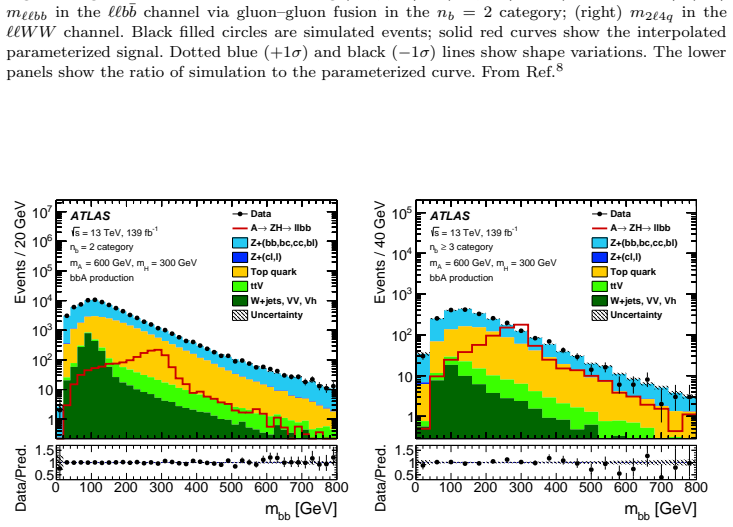
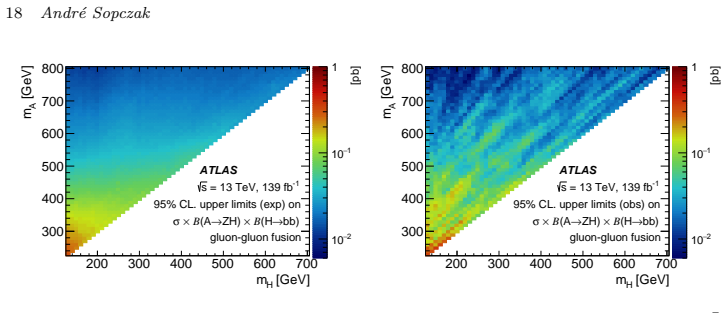
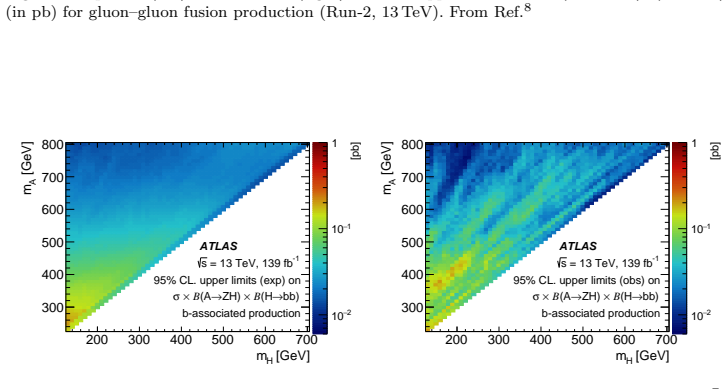
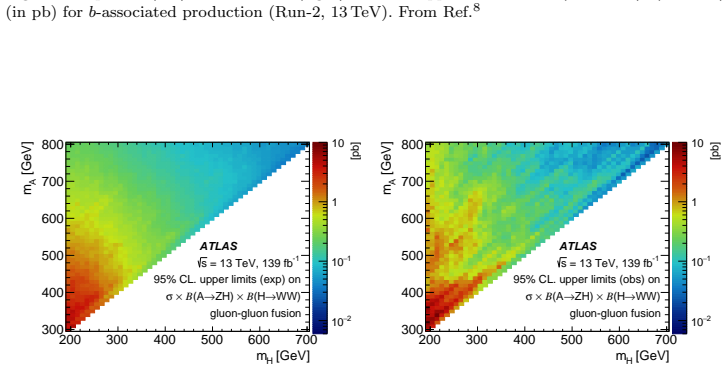
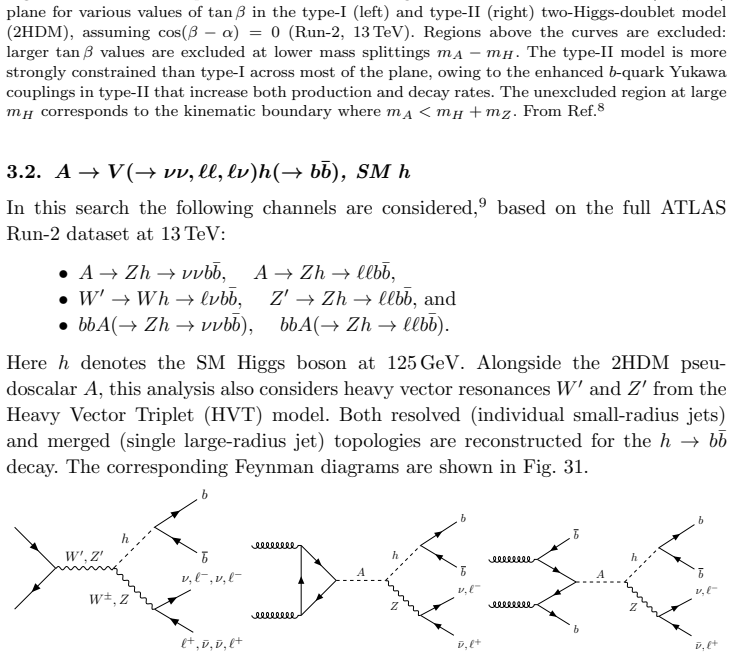
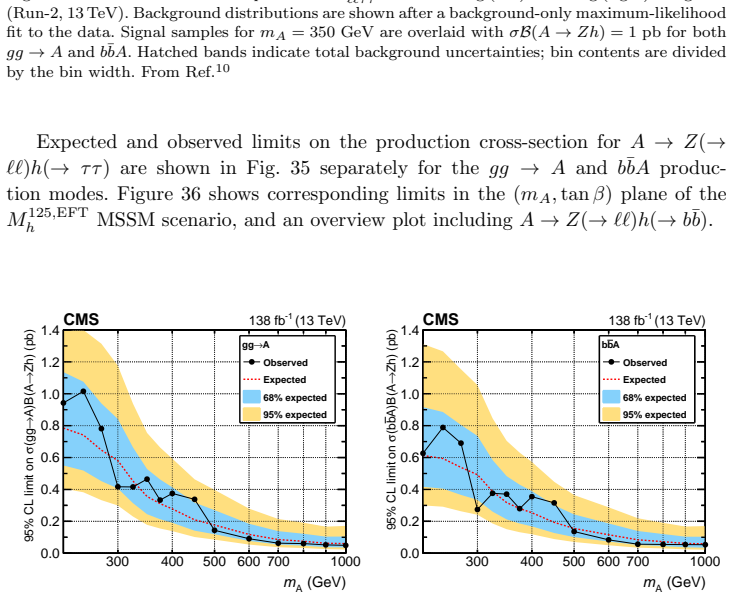
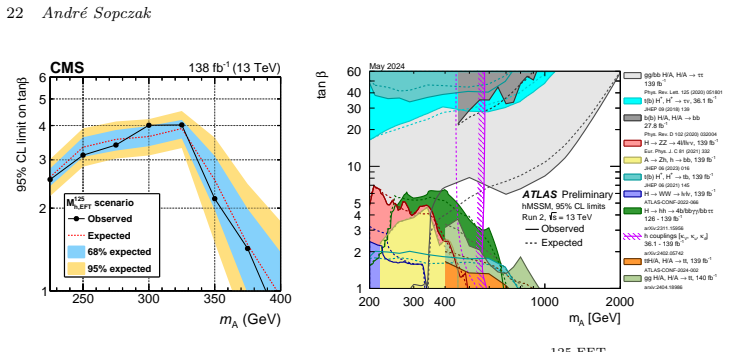
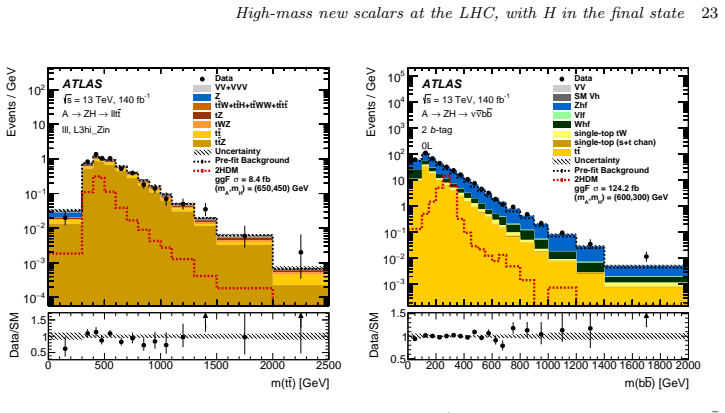
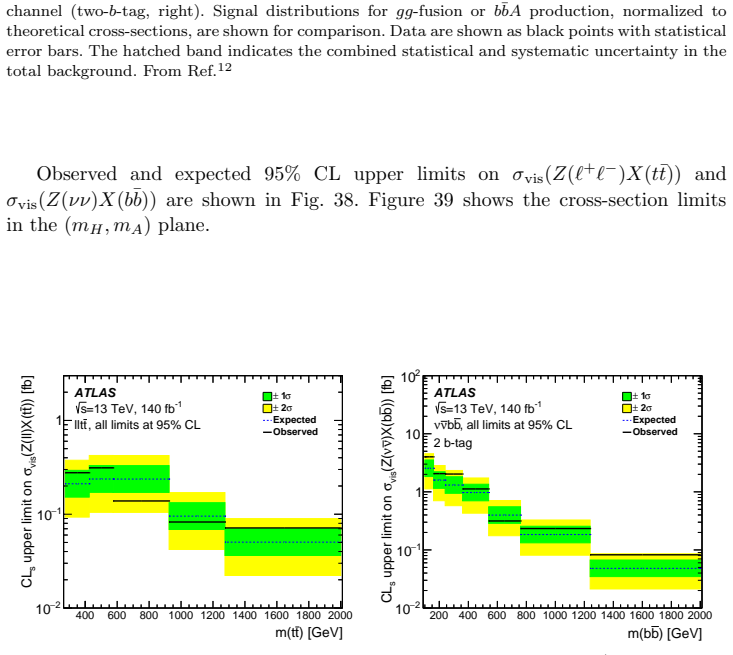
The paper compiles results from ATLAS and CMS on searches covering resonant production of a heavy scalar X decaying into a Higgs boson and a lighter scalar S, heavy neutral Higgs boson decaying into another neutral Higgs boson and a Z boson, and heavy charged Higgs boson production with subsequent decay into another neutral Higgs boson and a W boson, based on the complete LHC Run-2 dataset and partial Run-3 dataset.

What carries the argument

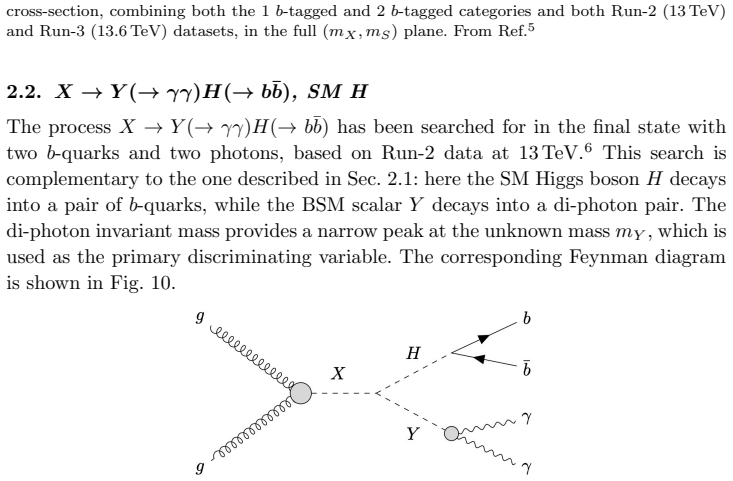
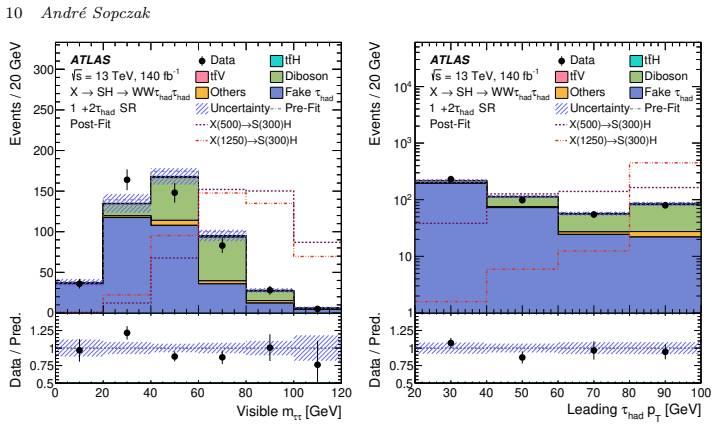
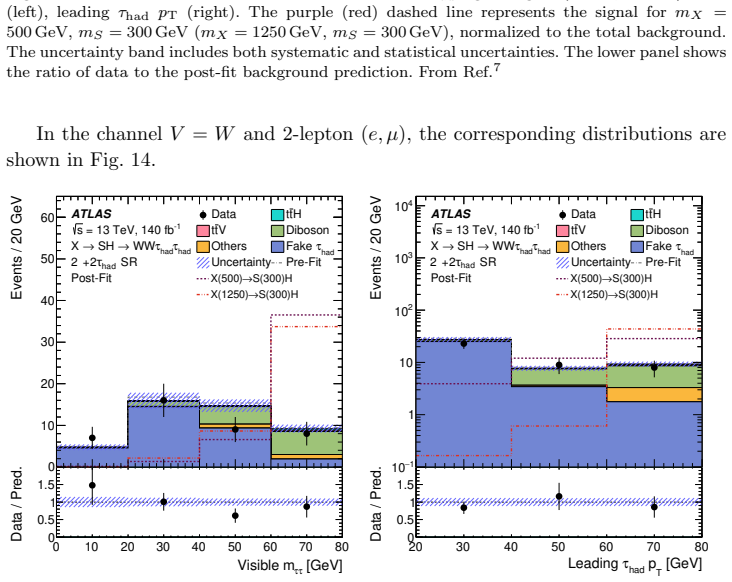
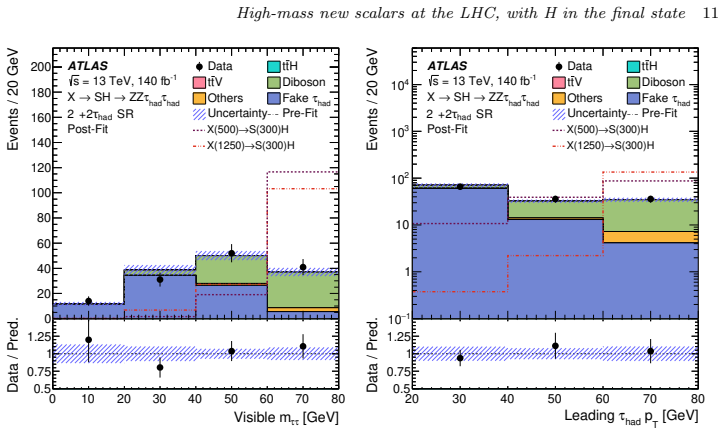
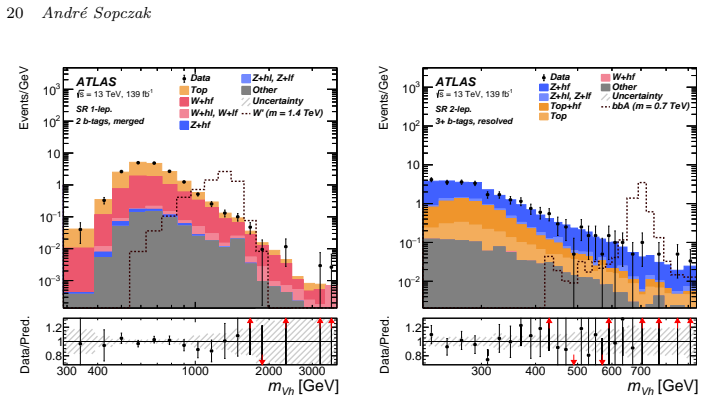
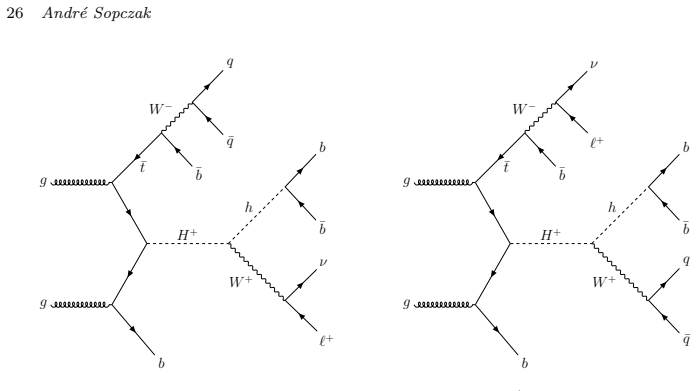
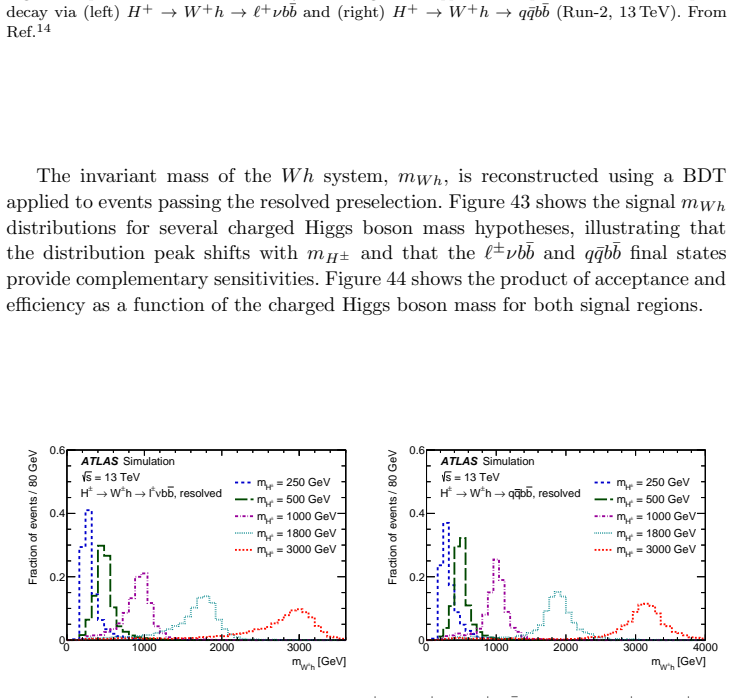
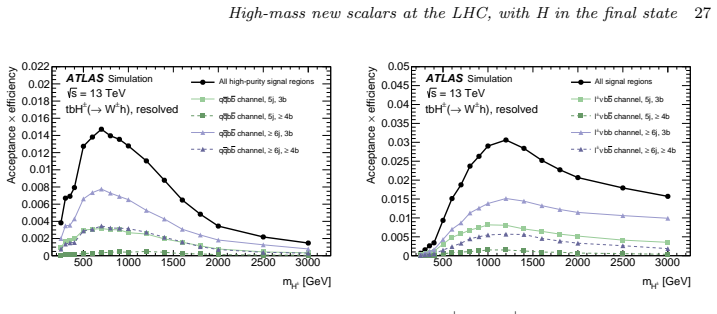
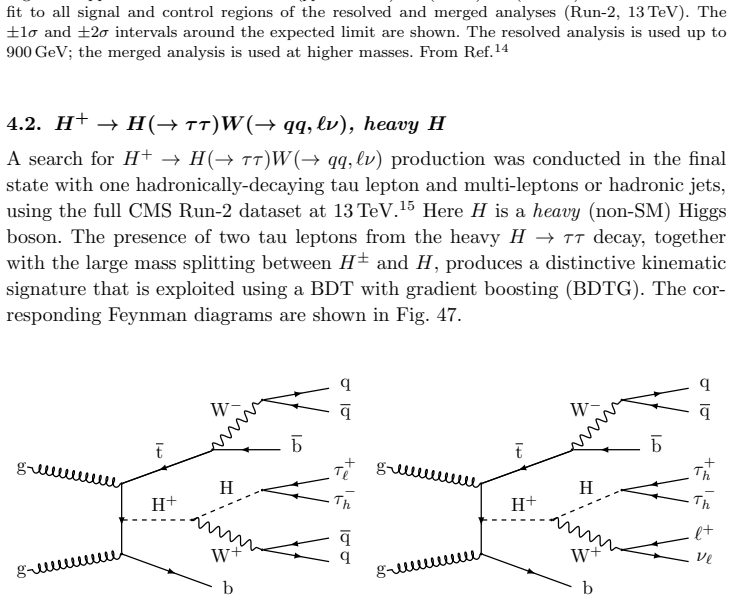
The three decay topologies (X to H plus S, neutral H to H plus Z, charged H to H plus W) that select the final states for the searches.

If this is right

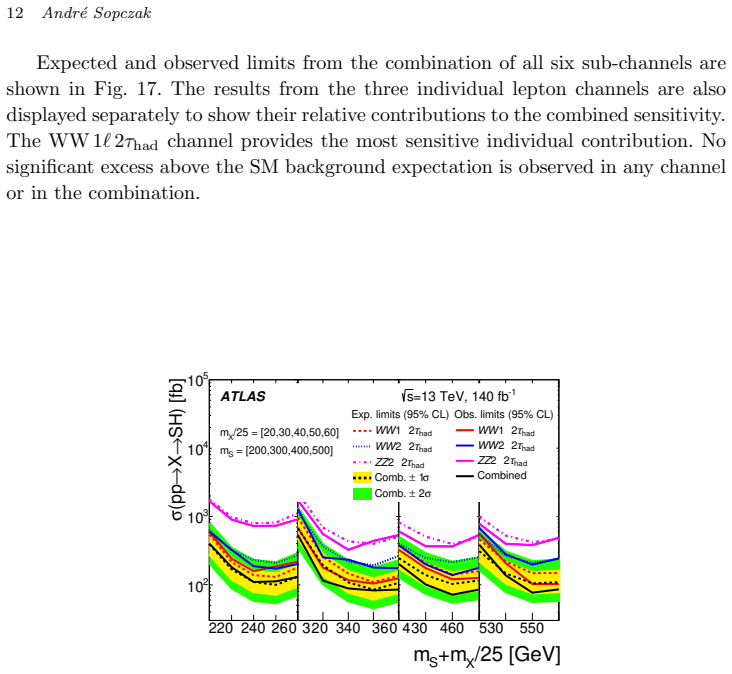
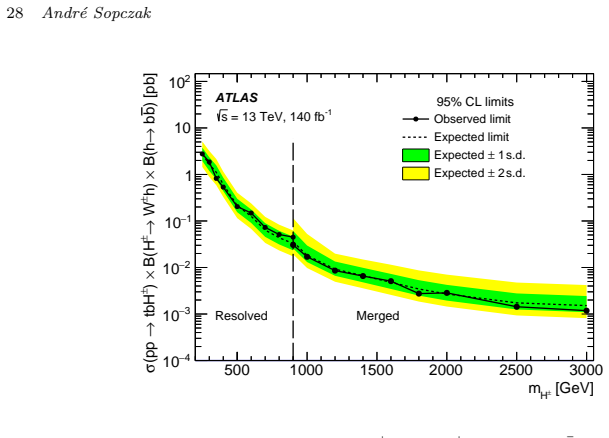
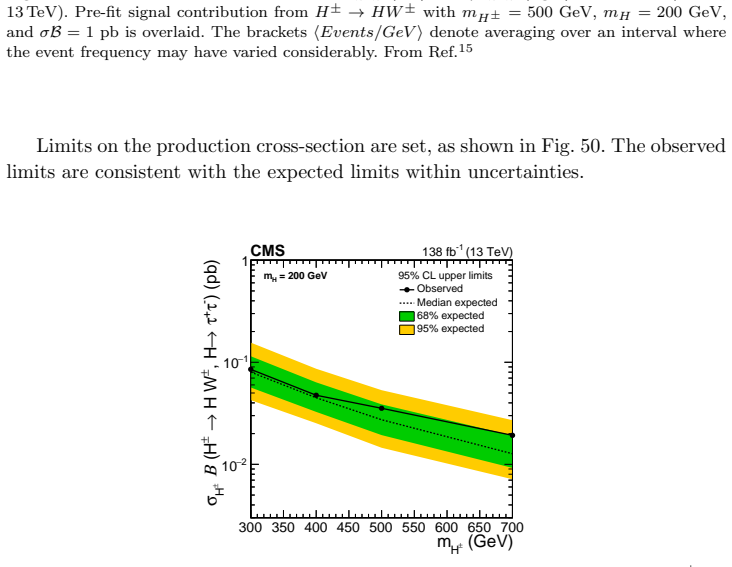
  • No significant signals are reported, producing upper limits on the production rates of the new scalars as a function of mass.
  • The limits apply across a range of masses from several hundred GeV up to a few TeV depending on the decay mode.
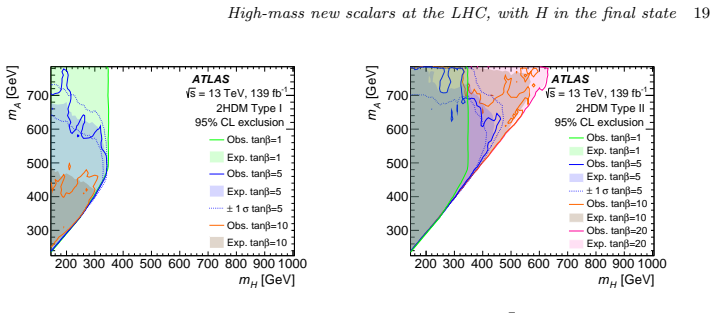
  • These searches add to the set of constraints on models that predict extra Higgs-like particles.

Where Pith is reading between the lines

These are editorial extensions of the paper, not claims the author makes directly.

  • The absence of signals constrains parameter space in models with multiple Higgs doublets.
  • Additional Run-3 and high-luminosity LHC data could extend the excluded mass ranges or probe smaller production rates.

Load-bearing premise

The cited ATLAS and CMS experimental results are accurately and completely summarized without omission of selection criteria or uncertainties that would change the limits.

What would settle it

An observed excess of events above expected background in one of the final states at a mass above the known Higgs boson mass, with statistical significance that cannot be explained by systematic uncertainties.

Figures

Figures reproduced from arXiv: 2607.00182 by Andre Sopczak.

Figure 1
Figure 1. Figure 1: ATLAS (left) and CMS (right) experimental buildings. ATLAS (left) and CMS (right) [PITH_FULL_IMAGE:figures/full_fig_p002_1.png] view at source ↗
Figure 2
Figure 2. Figure 2: Schematic view of the LHC accelerator complex and the location of the four main experi [PITH_FULL_IMAGE:figures/full_fig_p002_2.png] view at source ↗
Figure 3
Figure 3. Figure 3: LHC luminosity (Run-3, 2022–2025), and mean number of interactions per bunch crossing [PITH_FULL_IMAGE:figures/full_fig_p003_3.png] view at source ↗
Figure 4
Figure 4. Figure 4: Feynman diagram for X → S(→ b¯b)H(→ γγ) production via gluon-gluon fusion. From Ref.5 The mass of the scalar S and the mass of the scalar X correspond to the in￾variant mass of the b-quark pair (b-tagged jets), and the invariant mass of the b ¯bγγ final state, respectively. Events are classified according to the number of b-tagged jets (1 or 2). A control region (CR) is used to validate the non-resonant di… view at source ↗
Figure 5
Figure 5. Figure 5: Left: Distribution of mbb in data and in the post-fit background-only prediction in the control region (CR) of the 2 b-tagged category (Run-2, 13 TeV). The γγ + jets category represents the sum of γγ + jets, γ + jets and dijet backgrounds. The error band corresponds to the dominant uncertainty from the non-resonant diphoton background. Right: Distribution of mbb for the 2 b￾tagged category for a subset of … view at source ↗
Figure 6
Figure 6. Figure 6: Left: Distribution of m∗ bbγγ(= mbbγγ − (mbb − 125 GeV)) in data and in the post-fit background-only prediction in the signal region (SR) of the 2 b-tagged category (Run-2, 13 TeV). The error band corresponds to the dominant uncertainty from the non-resonant diphoton back￾ground. Right: Distributions of mbb for the 2 b-tagged category for selected signal mass points and main background processes, normalize… view at source ↗
Figure 7
Figure 7. Figure 7: Distribution of the PNN discriminant output after the profile-likelihood fit in the signal [PITH_FULL_IMAGE:figures/full_fig_p006_7.png] view at source ↗
Figure 8
Figure 8. Figure 8: Distributions of the PNN discriminant output after the profile-likelihood fit in the SRs for [PITH_FULL_IMAGE:figures/full_fig_p006_8.png] view at source ↗
Figure 9
Figure 9. Figure 9: Expected (left) and observed (right) 95% CL upper limits on the [PITH_FULL_IMAGE:figures/full_fig_p007_9.png] view at source ↗
Figure 10
Figure 10. Figure 10: Feynman diagram for the production of the BSM resonance [PITH_FULL_IMAGE:figures/full_fig_p007_10.png] view at source ↗
Figure 11
Figure 11. Figure 11: The signal model is shown for the hypothesis [PITH_FULL_IMAGE:figures/full_fig_p007_11.png] view at source ↗
Figure 11
Figure 11. Figure 11: Left: Simulated di-photon invariant mass distribution for the signal process at [PITH_FULL_IMAGE:figures/full_fig_p008_11.png] view at source ↗
Figure 12
Figure 12. Figure 12: Observed (solid lines) and expected (dashed lines) 95% CL upper limits on the product [PITH_FULL_IMAGE:figures/full_fig_p009_12.png] view at source ↗
Figure 13
Figure 13. Figure 13: Post-fit kinematic distributions in the WW 1 [PITH_FULL_IMAGE:figures/full_fig_p010_13.png] view at source ↗
Figure 14
Figure 14. Figure 14: Post-fit kinematic distributions in the WW 2 [PITH_FULL_IMAGE:figures/full_fig_p010_14.png] view at source ↗
Figure 15
Figure 15. Figure 15: Post-fit kinematic distributions in the ZZ 2 [PITH_FULL_IMAGE:figures/full_fig_p011_15.png] view at source ↗
Figure 16
Figure 16. Figure 16: BDT output distributions from a background-only fit to data for the [PITH_FULL_IMAGE:figures/full_fig_p011_16.png] view at source ↗
Figure 17
Figure 17. Figure 17: Observed and expected 95% CL upper limits on [PITH_FULL_IMAGE:figures/full_fig_p012_17.png] view at source ↗
Figure 18
Figure 18. Figure 18: Event distributions in the signal regions for the 2018 CMS dataset (Run-2, 13 TeV): [PITH_FULL_IMAGE:figures/full_fig_p013_18.png] view at source ↗
Figure 19
Figure 19. Figure 19: Distributions of events in the mreco X –mreco Y plane observed in the SR(4b) for CMS data (Run-2, 13 TeV). Left: data. Right: expected signal for mX = 700 GeV, mY = 400 GeV. Empty bins at high mreco X and low mreco Y are excluded because events in that region are highly boosted and fall outside the resolved analysis acceptance. From Ref.4 Expected and observed limits are shown in Figs. 20 and 21 [PITH_FU… view at source ↗
Figure 20
Figure 20. Figure 20: Left: Expected (dashed) and observed (solid red) 95% CL upper limits on [PITH_FULL_IMAGE:figures/full_fig_p014_20.png] view at source ↗
Figure 21
Figure 21. Figure 21: Expected (left) and observed (right) 95% CL upper limits on [PITH_FULL_IMAGE:figures/full_fig_p014_21.png] view at source ↗
Figure 22
Figure 22. Figure 22: Representative lowest-order Feynman diagrams for the three production and decay modes [PITH_FULL_IMAGE:figures/full_fig_p015_22.png] view at source ↗
Figure 23
Figure 23. Figure 23: Distributions of qPp 2 T /mℓℓbb before the requirement on this variable is applied, for events with (left) exactly two b-jets and (right) three or more b-jets (Run-2, 13 TeV). The signal distribution for (mA, mH) = (600, 300) GeV is shown normalized to σB(A → ZH)B(H → b¯b) = 1 pb (b-associated production only). The lower panel shows the ratio of data to the background prediction (filled circles) and the r… view at source ↗
Figure 24
Figure 24. Figure 24: Distributions of p Z T for (left) the nb = 2 category and (right) the nb ≥ 3 category (Run-2, 13 TeV). The same conventions as in [PITH_FULL_IMAGE:figures/full_fig_p016_24.png] view at source ↗
Figure 25
Figure 25. Figure 25: The measured mbb distributions before the mbb window requirements are shown in [PITH_FULL_IMAGE:figures/full_fig_p016_25.png] view at source ↗
Figure 25
Figure 25. Figure 25: Signal mass distributions assuming (mA, mH) = (500, 300) GeV (Run-2, 13 TeV): (left) mℓℓbb in the ℓℓb¯b channel via gluon–gluon fusion in the nb = 2 category; (right) m2ℓ4q in the ℓℓWW channel. Black filled circles are simulated events; solid red curves show the interpolated parameterized signal. Dotted blue (+1σ) and black (−1σ) lines show shape variations. The lower panels show the ratio of simulation t… view at source ↗
Figure 26
Figure 26. Figure 26: The mbb distribution before the mbb window requirement is applied, for (left) the nb = 2 category and (right) the nb ≥ 3 category (Run-2, 13 TeV). The signal distribution for (mA, mH) = (600, 300) GeV is shown normalized to σB(A → ZH)B(H → b¯b) = 1 pb. The same conventions as in [PITH_FULL_IMAGE:figures/full_fig_p017_26.png] view at source ↗
Figure 27
Figure 27. Figure 27: Expected (left) and observed (right) 95% CL upper limits on [PITH_FULL_IMAGE:figures/full_fig_p018_27.png] view at source ↗
Figure 28
Figure 28. Figure 28: Expected (left) and observed (right) 95% CL upper limits on [PITH_FULL_IMAGE:figures/full_fig_p018_28.png] view at source ↗
Figure 29
Figure 29. Figure 29: Expected (left) and observed (right) 95% CL upper limits on [PITH_FULL_IMAGE:figures/full_fig_p018_29.png] view at source ↗
Figure 30
Figure 30. Figure 30: Observed and expected 95% CL exclusion regions for the [PITH_FULL_IMAGE:figures/full_fig_p019_30.png] view at source ↗
Figure 31
Figure 31. Figure 31: Representative lowest-order Feynman diagrams for resonant [PITH_FULL_IMAGE:figures/full_fig_p019_31.png] view at source ↗
Figure 32
Figure 32. Figure 32: Post-fit distributions of mV h (Run-2, 13 TeV). Left: one-lepton merged signal region of the W′ fit. The dashed line shows the HVT Model A benchmark with mW′ = 1.4 TeV, normalized to 0.1 pb. Right: two-lepton resolved three-or-more-tag signal-region categories of the b¯bA fit. The dashed line shows the 2HDM benchmark with mA = 0.7 TeV, normalized to σ × B(Zh) × B(h → b¯b) = 0.1 pb. In both panels, “Top” a… view at source ↗
Figure 33
Figure 33. Figure 33: Upper limits at 95% CL on σ(pp → Z′ )B(Z′ → Zh) combining the 0-lepton and 2-lepton channels (left), and on σ(pp → W′ )B(W′ → W h) combining the 0-lepton and 1-lepton channels (right) (Run-2, 13 TeV). For both searches, B(h → b¯b/cc¯) = 0.598 is assumed. From Ref.9 3.3. A → Z(→ ℓℓ)h(→ τ τ ), SM h A search has been performed in the A → Z(→ ℓℓ)h(→ τ τ ) channel,10 using the full CMS Run-2 dataset at 13 TeV.… view at source ↗
Figure 34
Figure 34. Figure 34: The reconstructed four-lepton mass mcons ℓℓττ in the no b-tag (left) and b-tag (right) categories (Run-2, 13 TeV). Background distributions are shown after a background-only maximum-likelihood fit to the data. Signal samples for mA = 350 GeV are overlaid with σB(A → Zh) = 1 pb for both gg → A and b¯bA. Hatched bands indicate total background uncertainties; bin contents are divided by the bin width. From R… view at source ↗
Figure 35
Figure 35. Figure 35: Expected (dashed) and observed (solid) 95% CL upper limits on [PITH_FULL_IMAGE:figures/full_fig_p021_35.png] view at source ↗
Figure 36
Figure 36. Figure 36: Left: Lower 95% CL limit on tan β as a function of mA in the M125,EFT h MSSM scenario (Run-2, 13 TeV). Values below the solid line are excluded at 95% CL. Right: Overview of exclusion regions in the [mA, tan β] plane of the hMSSM from direct heavy Higgs boson searches and mea￾surements of the 125 GeV Higgs boson rates. Both observed (solid) and expected (dashed) limits are shown; shaded or hatched regions… view at source ↗
Figure 37
Figure 37. Figure 37: Post-fit distributions (Run-2, 13 TeV): mtt in the ℓ +ℓ−tt¯ channel (left); mbb in the ννb¯b channel (two-b-tag, right). Signal distributions for gg-fusion or b¯bA production, normalized to theoretical cross-sections, are shown for comparison. Data are shown as black points with statistical error bars. The hatched band indicates the combined statistical and systematic uncertainty in the total background. … view at source ↗
Figure 38
Figure 38. Figure 38: Observed (solid) and expected (dashed) 95% CL upper limits on [PITH_FULL_IMAGE:figures/full_fig_p023_38.png] view at source ↗
Figure 39
Figure 39. Figure 39: Expected (left) and observed (right) 95% CL upper limits on [PITH_FULL_IMAGE:figures/full_fig_p024_39.png] view at source ↗
Figure 40
Figure 40. Figure 40: shows the distributions of p Z T × ∆m in the signal regions. The excess of events reported by the ATLAS Collaboration12 at (mA, mH) = (650, 450) GeV is not observed by CMS.13 10 2 10 1 10 0 10 1 10 2 10 3 10 4 10 5 10 6 10 7 Events / bin 138 fb 1 CMS (13 TeV) SR 6j 2b SR 5j 2b SR 6j 1b SR 5j 1b (mA, mH) = (1000, 350) GeV ( +ee channel), post-fit Data Sig. pre-fit (25 fb) Total uncertainty single t ttW VV … view at source ↗
Figure 41
Figure 41. Figure 41: Expected (left) and observed (right) 95% CL upper limits on the product of production [PITH_FULL_IMAGE:figures/full_fig_p025_41.png] view at source ↗
Figure 42
Figure 42. Figure 42: Representative lowest-order Feynman diagrams for [PITH_FULL_IMAGE:figures/full_fig_p026_42.png] view at source ↗
Figure 43
Figure 43. Figure 43: Invariant mass distributions for (left) H± → W±h → ℓ±νb¯b and (right) H± → W±h → qqb¯ ¯b for selected charged Higgs boson pole masses (Run-2, 13 TeV), reconstructed using BDTs in the resolved topology. All distributions are normalized to unit area. From Ref.14 [PITH_FULL_IMAGE:figures/full_fig_p026_43.png] view at source ↗
Figure 44
Figure 44. Figure 44: Product of acceptance and efficiency for [PITH_FULL_IMAGE:figures/full_fig_p027_44.png] view at source ↗
Figure 45
Figure 45. Figure 45: Post-fit distributions of mW h in the high neural-network score signal regions of the merged ℓ±νb¯b event categories (Run-2, 13 TeV). “Others” summarizes contributions from tHjb, tW h, ttt¯ t¯, and SM V h. The shaded bands represent the total post-fit uncertainty in the background prediction. The lower panels show the ratio of observed data to the estimated SM background. The expected signal contribution … view at source ↗
Figure 46
Figure 46. Figure 46: Upper limits at 95% CL on σ(pp → tbH±) × B(W±h) × B(h → b¯b) from the combined fit to all signal and control regions of the resolved and merged analyses (Run-2, 13 TeV). The ±1σ and ±2σ intervals around the expected limit are shown. The resolved analysis is used up to 900 GeV; the merged analysis is used at higher masses. From Ref.14 4.2. H+ → H(→ τ τ )W(→ qq, ℓν), heavy H A search for H+ → H(→ τ τ )W(→ q… view at source ↗
Figure 47
Figure 47. Figure 47: Feynman diagrams for the signal processes targeted by this analysis (Run-2, 13 TeV): [PITH_FULL_IMAGE:figures/full_fig_p028_47.png] view at source ↗
Figure 48
Figure 48. Figure 48: Three BDTG input variables for the µτh final state, for signal with mH± = 500 GeV and 2018 data-taking conditions (Run-2, 13 TeV): the azimuthal angle between µ and ⃗pmiss T (left), the ratio of the third leading jet pT to HT (middle), and the transverse mass from µ, τh, j1, j2, and ⃗pmiss T (right). All distributions are normalized to unit area. From Ref.15 The transverse mass distributions after a backg… view at source ↗
Figure 49
Figure 49. Figure 49: Post-fit mT distributions for the eτhτh (left) and µτhτh (right) final states (Run-2, 13 TeV). Pre-fit signal contribution from H± → HW± with mH± = 500 GeV, mH = 200 GeV, and σB = 1 pb is overlaid. The brackets ⟨Events/GeV ⟩ denote averaging over an interval where the event frequency may have varied considerably. From Ref.15 Limits on the production cross-section are set, as shown in [PITH_FULL_IMAGE:fig… view at source ↗
Figure 50
Figure 50. Figure 50: Expected (dashed) and observed (solid) 95% CL upper limits on [PITH_FULL_IMAGE:figures/full_fig_p030_50.png] view at source ↗
Figure 51
Figure 51. Figure 51: Left: Observed and expected 95% CL upper limits on the [PITH_FULL_IMAGE:figures/full_fig_p031_51.png] view at source ↗
read the original abstract

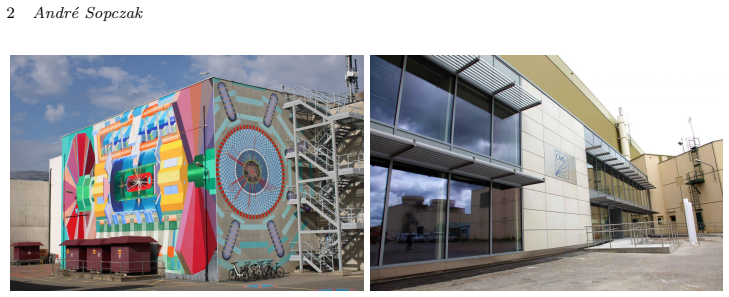
The search for new particles, conducted at the LHC by the ATLAS and CMS collaborations, covers several production and decay modes, leading to a large variety of final states that could be observed in both detectors. This review focuses on the production of new heavy scalars that have a Higgs boson in the final state. Three cases are covered: resonant production of a heavy scalar $X$ decaying into a Higgs boson and a lighter scalar $S$, heavy neutral Higgs boson decaying into another neutral Higgs boson and a $Z$ boson, and a heavy charged Higgs boson production with subsequent decay into another neutral Higgs boson and a $W$ boson. The reviewed searches are based on the complete LHC Run-2 dataset and partial Run-3 dataset.

Editorial analysis

A structured set of objections, weighed in public.

Desk editor's note, referee report, simulated authors' rebuttal, and a circularity audit. Tearing a paper down is the easy half of reading it; the pith above is the substance, this is the friction.

Referee Report

0 major / 1 minor

Summary. The paper reviews searches for high-mass new scalars at the LHC by the ATLAS and CMS collaborations, with a focus on final states containing a Higgs boson. It covers three specific cases: resonant production of a heavy scalar X decaying to a Higgs and a lighter scalar S, heavy neutral Higgs decaying to another neutral Higgs and a Z boson, and heavy charged Higgs production decaying to a neutral Higgs and a W boson. The review is based on the full LHC Run-2 dataset and partial Run-3 dataset.

Significance. If the summaries are accurate, this review provides a consolidated overview of current experimental constraints on extended Higgs sectors from LHC data. It is useful for identifying which parameter spaces have been probed and where future searches might focus. The paper does not perform new analyses or provide new predictions but synthesizes existing results from public papers.

minor comments (1)
  1. [Abstract] Abstract: the statement that the reviewed searches use the 'complete LHC Run-2 dataset and partial Run-3 dataset' is central to the scope claim but would be strengthened by explicitly listing the integrated luminosities and the specific Run-3 papers included, to allow immediate verification of coverage without cross-referencing every citation.

Simulated Author's Rebuttal

0 responses · 0 unresolved

We thank the referee for their assessment of the manuscript and the recommendation of minor revision. No specific major comments were raised in the report.

Circularity Check

0 steps flagged

Review summarizes external ATLAS/CMS results with no derivations or predictions

full rationale

The paper is a review of existing LHC searches by ATLAS and CMS collaborations. It reports on production/decay modes and datasets used in those external analyses but performs no fits, derivations, predictions, or parameter extractions of its own. No equations, ansatze, or self-citations appear in the provided text that could reduce any claim to the paper's inputs by construction. The central content is faithful summarization of cited external results, which is independent of the review itself.

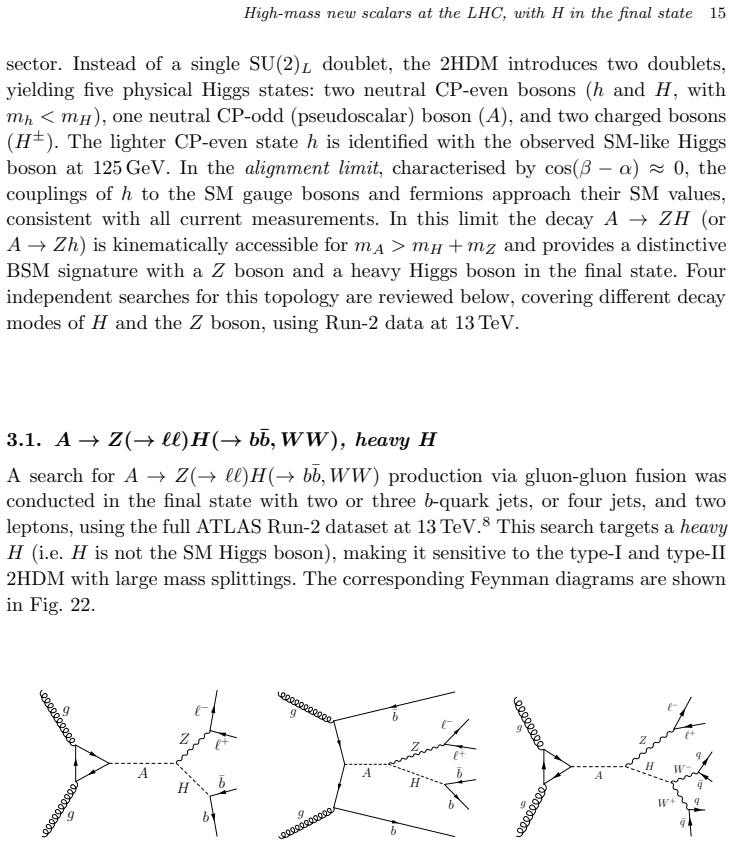
Axiom & Free-Parameter Ledger

0 free parameters · 0 axioms · 0 invented entities

No new theoretical model, derivation, or fitted parameters are introduced; the paper aggregates published experimental results.

pith-pipeline@v0.9.1-grok · 5641 in / 1047 out tokens · 16621 ms · 2026-07-02T00:34:42.791397+00:00 · methodology

discussion (0)

Sign in with ORCID, Apple, or X to comment. Anyone can read and Pith papers without signing in.

Reference graph

Works this paper leans on

17 extracted references · 15 canonical work pages · 2 internal anchors

  1. [1]

    ATLAS Collaboration,JINST3, S08003 (2008), doi:10.1088/1748-0221/3/08/S08003

  2. [2]

    CMS Collaboration,JINST3, S08004 (2008), doi:10.1088/1748-0221/3/08/S08004

  3. [3]

    CERN, LHC luminosity public results (2025),https://twiki.cern.ch/twiki/bin/ view/AtlasPublic/LuminosityPublicResultsRun3, accessed 2 Nov. 2025

  4. [4]

    CMS Collaboration (2026),arXiv:2605.02848, submitted to Physical Review D

  5. [5]

    ATLAS Collaboration,Phys. Lett. B868, 140425 (2026),arXiv:2510.02857 [hep-ex], doi:10.1016/j.physletb.2026.140425

  6. [6]

    CMS Collaboration,JHEP12, 178 (2025),arXiv:2508.11494 [hep-ex], doi:10.1007/ JHEP12(2025)178

  7. [7]

    1007/JHEP10(2023)009

    ATLAS Collaboration,JHEP10, 009 (2023),arXiv:2307.11120 [hep-ex], doi:10. 1007/JHEP10(2023)009

  8. [8]

    ATLAS Collaboration,Eur. Phys. J. C81, 396 (2021),arXiv:2011.05639 [hep-ex], doi:10.1140/epjc/s10052-021-09117-5

  9. [9]

    1007/JHEP06(2023)016

    ATLAS Collaboration,JHEP06, 016 (2023),arXiv:2207.00230 [hep-ex], doi:10. 1007/JHEP06(2023)016

  10. [10]

    CMS Collaboration,JHEP10, 074 (2025),arXiv:2501.14825 [hep-ex], doi:10.1007/ JHEP10(2025)074

  11. [11]

    ATLAS Collaboration, Summary plots for beyond-the-Standard-Model Higgs boson benchmarks for direct and indirect searches (2025),https://cds.cern.ch/record/ 2946409

  12. [12]

    1007/JHEP02(2024)197

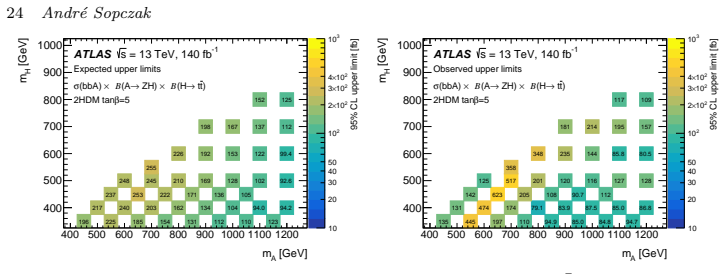
    ATLAS Collaboration,JHEP02, 197 (2024),arXiv:2311.04033 [hep-ex], doi:10. 1007/JHEP02(2024)197

  13. [13]

    CMS Collaboration,Phys. Lett. B866, 139568 (2025), doi:10.1016/j.physletb.2025. 139568

  14. [14]

    1007/JHEP02(2025)143

    ATLAS Collaboration,JHEP02, 143 (2025),arXiv:2411.03969 [hep-ex], doi:10. 1007/JHEP02(2025)143

  15. [15]

    CMS Collaboration,JHEP09, 032 (2023),arXiv:2207.01046 [hep-ex], doi:10.1007/ JHEP09(2023)032

  16. [16]

    1007/JHEP04(2024)118

    ATLAS Collaboration,JHEP04, 118 (2024),arXiv:2402.10607 [hep-ex], doi:10. 1007/JHEP04(2024)118

  17. [17]

    CMS Collaboration (2026),arXiv:2601.12583 [hep-ex], accepted by JHEP