Mapping the Dense Circumstellar Environments of SNe Ibn, SNe Icn, and Fast Blue Optical Transients
Pith reviewed 2026-07-02 07:59 UTC · model grok-4.3
The pith
SNe Ibn, SNe Icn and many FBOTs overlap in light-curve properties and CSM-interaction parameters.
A machine-rendered reading of the paper's core claim, the machinery that carries it, and where it could break.
Core claim
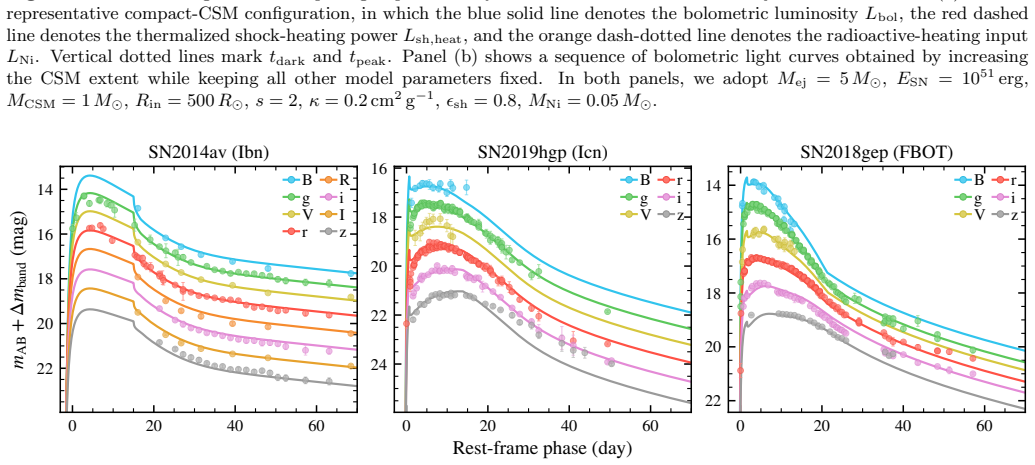
Uniform modeling of the 25 light curves with the TransFit-CSM framework shows that the distributions of CSM mass, radius, and density, together with ejecta mass and velocity, are statistically consistent across the Ibn, Icn, and non-extreme FBOT populations; the most luminous and fastest FBOTs lie outside this shared region and are not reproduced by the same interaction model alone.
What carries the argument
The TransFit-CSM framework, which solves for shock-powered emission from ejecta colliding with dense H-poor circumstellar material while adding an effective inner heating component.
If this is right
- The three classes are not cleanly separated in the peak-luminosity–rise-time or decline–rise-time planes.
- FBOTs occupy the luminous, rapidly evolving end but show partial overlap with the Ibn/Icn population.
- Extinction-corrected peak colors of all three classes occupy a broadly overlapping blue region.
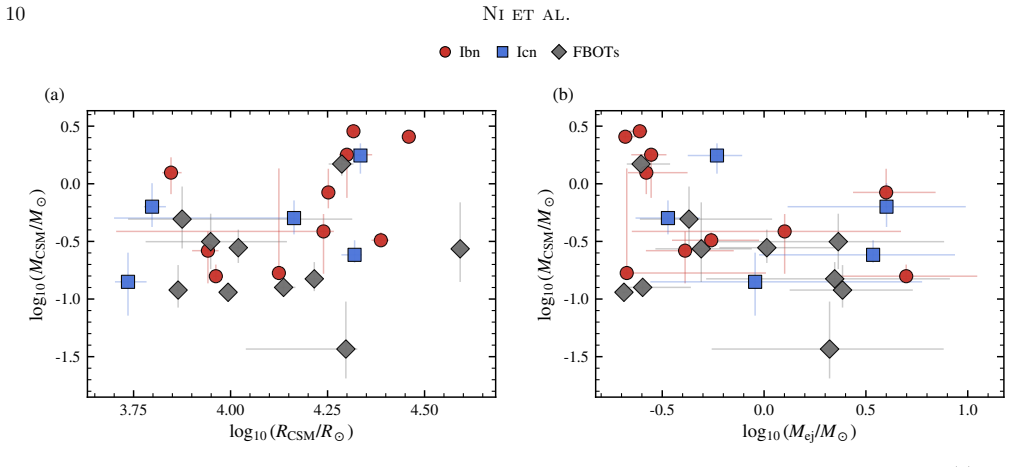
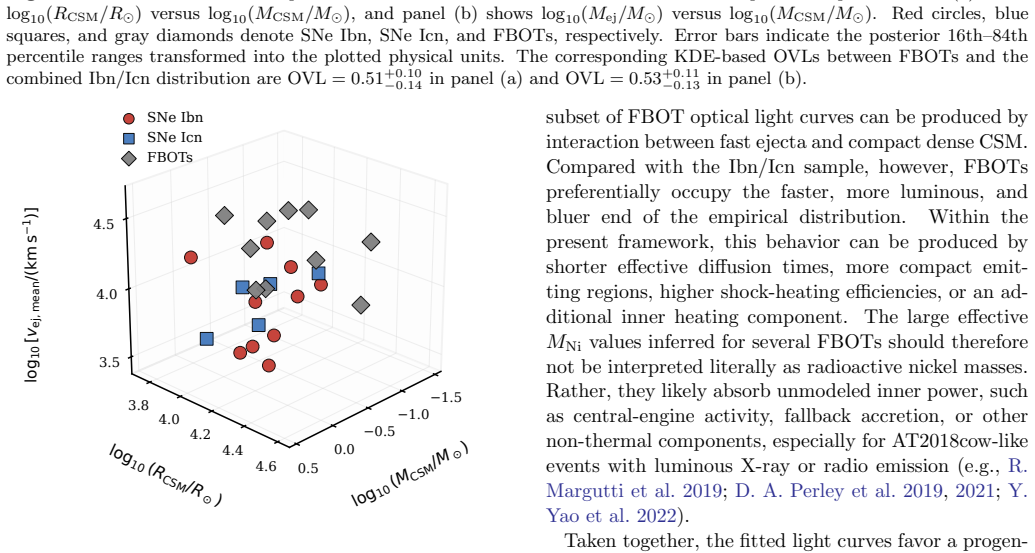
- The derived CSM and ejecta parameters from unified fits form overlapping distributions.
- The most extreme FBOTs lie outside the shared parameter space and may need additional power sources.
Where Pith is reading between the lines
- If the overlap holds for larger samples, dense H-poor CSM may be a common feature of many stripped-envelope explosions rather than a rare feature of Ibn/Icn events alone.
- Multi-wavelength follow-up of the extreme FBOTs could test whether non-thermal or central-engine contributions are required once the CSM-interaction component is subtracted.
- The same modeling approach could be applied to other fast-evolving transients to check whether they also reduce to CSM interaction.
Load-bearing premise
The 25-event sample is representative of the underlying populations and the model accounts for the dominant energy source without large missing contributions for the non-extreme events.
What would settle it
A new, well-observed FBOT whose rise time, peak luminosity, and color place it inside the current Ibn/Icn distribution yet whose light curve cannot be reproduced by any TransFit-CSM parameter combination.
Figures
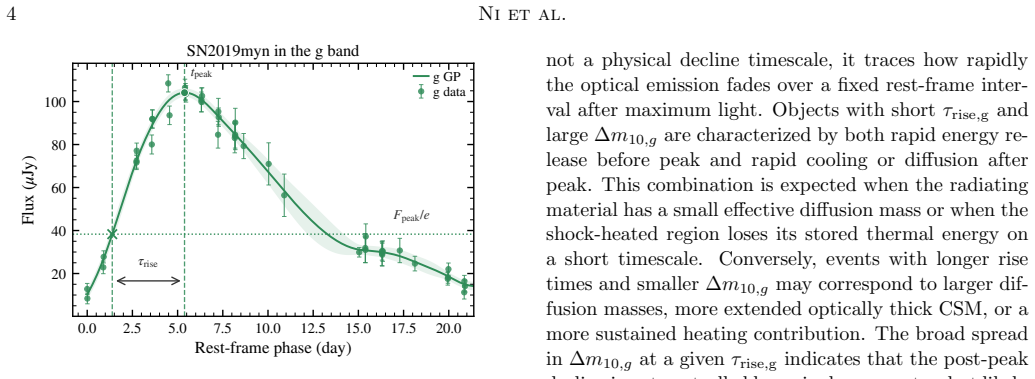
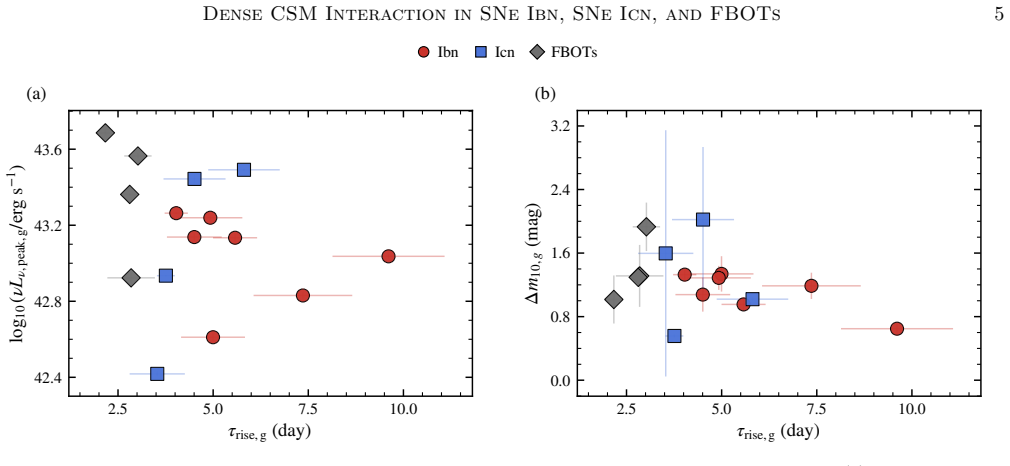
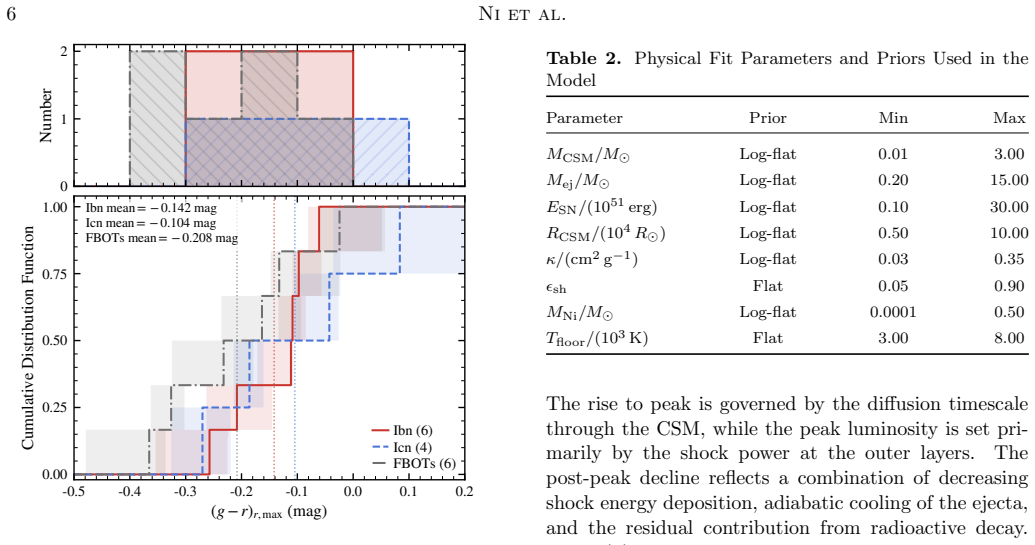
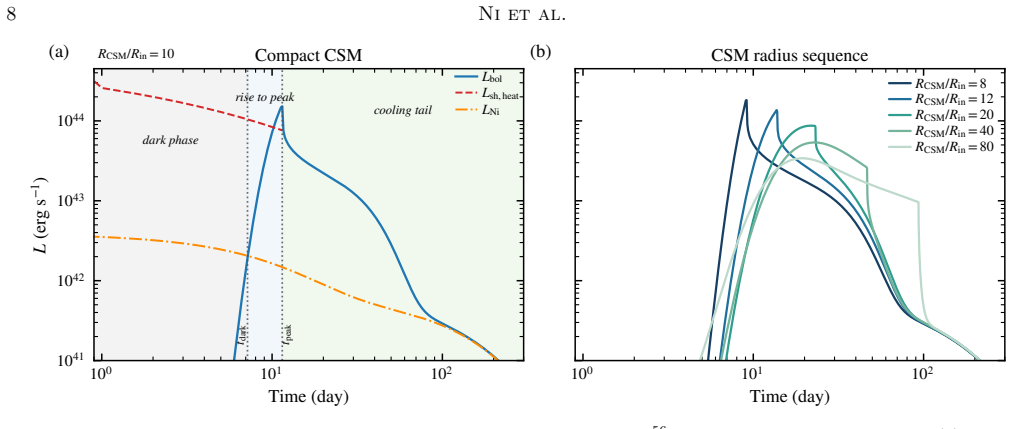
read the original abstract
SNe Ibn and SNe Icn are stripped-envelope explosions whose optical emission is commonly linked to interaction with H-poor circumstellar material (CSM), whereas fast blue optical transients (FBOTs) form an observational class of rapidly evolving, blue, and luminous events with diverse proposed power sources. We present a uniform comparison of these transients to test whether they are separated in optical light-curve and fitted physical parameter space. We compile multiband optical light curves of 25 SNe Ibn, SNe Icn, and FBOTs, measure same-band observables with Gaussian-process reconstructions, and model the data with the unified \texttt{TransFit-CSM} framework. In the observed (g)-band peak-luminosity--rise-time and decline--rise-time planes, the three classes are not cleanly separated: FBOTs preferentially occupy the luminous and rapidly evolving end of the distribution, but show limited overlap with part of the Ibn/Icn population. Their extinction-corrected peak colors span a broadly overlapping blue region, with FBOTs extending to bluer colors. Unified CSM-interaction fits, including shock heating and an effective inner heating component, yield overlapping CSM and ejecta parameter distributions. These results indicate that the optical light curves of SNe Ibn, SNe Icn, and at least some FBOTs can be compared within a common dense-CSM interaction framework, while the most extreme FBOTs may still require additional power sources or non-thermal components.
Editorial analysis
A structured set of objections, weighed in public.
Referee Report
Summary. The manuscript compiles multiband optical light curves for a sample of 25 SNe Ibn, SNe Icn, and FBOTs. It measures same-band observables (peak luminosity, rise time, decline time, colors) via Gaussian-process reconstructions and fits all events uniformly with the TransFit-CSM model that includes shock heating plus an effective inner heating component. The central claim is that the three classes are not cleanly separated in the observed luminosity–timescale and color planes and that the fitted CSM and ejecta parameter distributions overlap, indicating that the optical light curves of SNe Ibn, SNe Icn, and at least some FBOTs can be compared within a common dense-CSM interaction framework (while the most extreme FBOTs may require additional power sources).
Significance. If the overlaps prove robust after quantitative validation and the sample is shown to be representative, the work would supply a concrete, observationally grounded framework for placing a subset of FBOTs alongside SNe Ibn/Icn under dense H-poor CSM interaction. This would help unify interpretations of rapidly evolving stripped-envelope transients and motivate targeted follow-up with non-optical diagnostics.
major comments (4)
- [Abstract] Abstract: the reported overlaps in fitted CSM/ejecta parameters and in the peak-luminosity–rise-time plane are presented solely via visual inspection of distributions; no quantitative statistics (e.g., Kolmogorov–Smirnov tests, overlap integrals), error budgets on the fitted parameters, or explicit comparisons to alternative power-source models are provided, so the robustness of the claim that the classes “are not cleanly separated” cannot be assessed from the given text.
- [Sample compilation] Sample section: the criteria used to select the 25 events (and any exclusion of events that do not show CSM-like optical behavior) are not stated, which is load-bearing for the claim that the compiled sample is representative and free of strong selection biases.
- [Modeling] Modeling section: all CSM and ejecta parameters are obtained by applying the identical TransFit-CSM framework (shock heating + inner heating term) to every event; the reported parameter overlaps are therefore partly by construction of the shared model rather than arising from independent external benchmarks or spectroscopic diagnostics.
- [Abstract and results] Abstract and results: no validation is shown that the inner-heating component is required by the data (rather than assumed) or that the model reproduces independent diagnostics such as spectroscopic line velocities or radio/X-ray constraints for the non-extreme events.
minor comments (1)
- [Figures] The abstract and figure captions should explicitly define the symbols and color coding used for the three classes in all parameter-space plots.
Simulated Author's Rebuttal
We thank the referee for the constructive report and detailed comments. We address each major point below, agreeing where revisions are needed to strengthen the quantitative support and transparency of the analysis. We have prepared a revised manuscript incorporating these changes.
read point-by-point responses
-
Referee: [Abstract] Abstract: the reported overlaps in fitted CSM/ejecta parameters and in the peak-luminosity–rise-time plane are presented solely via visual inspection of distributions; no quantitative statistics (e.g., Kolmogorov–Smirnov tests, overlap integrals), error budgets on the fitted parameters, or explicit comparisons to alternative power-source models are provided, so the robustness of the claim that the classes “are not cleanly separated” cannot be assessed from the given text.
Authors: We agree that quantitative validation is required. In the revised version we add two-sample Kolmogorov–Smirnov tests (with p-values) and overlap integrals for the peak-luminosity, rise-time, decline-time, and fitted-parameter distributions between the three classes. Parameter uncertainties are now reported as the 16–84 percentile ranges from the MCMC posteriors. We also expand the discussion to compare the CSM-interaction framework explicitly with magnetar and nickel-decay models for the most luminous FBOTs, citing existing literature limits. revision: yes
-
Referee: [Sample compilation] Sample section: the criteria used to select the 25 events (and any exclusion of events that do not show CSM-like optical behavior) are not stated, which is load-bearing for the claim that the compiled sample is representative and free of strong selection biases.
Authors: We accept this criticism. The revised Sample section now states the explicit selection criteria: all spectroscopically classified SNe Ibn, SNe Icn, and FBOTs with published multiband photometry covering at least three epochs in two or more filters, drawn from the literature up to 2023. Events lacking sufficient cadence for reliable GP reconstruction were excluded; no events were removed on the basis of “non-CSM-like” behavior. A table listing each object and its data sources is added. revision: yes
-
Referee: [Modeling] Modeling section: all CSM and ejecta parameters are obtained by applying the identical TransFit-CSM framework (shock heating + inner heating term) to every event; the reported parameter overlaps are therefore partly by construction of the shared model rather than arising from independent external benchmarks or spectroscopic diagnostics.
Authors: The uniform modeling framework is deliberate to permit a controlled comparison under identical physical assumptions. Nevertheless, we acknowledge that the overlaps are influenced by the shared model. In revision we (i) stress that the data still drive the posterior distributions and (ii) add a direct comparison of our fitted ejecta masses and velocities to independent spectroscopic estimates published for a subset of the SNe Ibn/Icn. We also note that the model is not forced to produce overlaps; several extreme FBOTs still require unphysically large CSM masses, which we flag. revision: partial
-
Referee: [Abstract and results] Abstract and results: no validation is shown that the inner-heating component is required by the data (rather than assumed) or that the model reproduces independent diagnostics such as spectroscopic line velocities or radio/X-ray constraints for the non-extreme events.
Authors: We will add a model-comparison subsection using the Bayesian information criterion to quantify the improvement provided by the inner-heating term for each event. For external validation we include a brief consistency check against published spectroscopic velocities for the SNe Ibn/Icn subsample and reference existing radio/X-ray studies that support dense CSM interaction. A full multi-wavelength re-analysis lies outside the scope of the present optical-light-curve study but is noted as future work. revision: partial
Circularity Check
No significant circularity detected; derivation applies uniform model to independent datasets.
full rationale
The paper compiles multiband light curves for 25 events, reconstructs observables via Gaussian processes, and applies the TransFit-CSM framework uniformly to derive CSM and ejecta parameters. Reported overlaps are outputs of fitting distinct observational datasets to the same physical model rather than any self-referential reduction, fitted subset renamed as prediction, or load-bearing self-citation. No equations, ansatzes, or uniqueness theorems are shown reducing the central claim to its inputs by construction. The analysis remains self-contained against the external sample and model assumptions.
Axiom & Free-Parameter Ledger
free parameters (2)
- CSM density profile parameters
- Inner heating component strength
axioms (1)
- domain assumption TransFit-CSM accurately represents the dominant power source for non-extreme events in all three classes
Reference graph
Works this paper leans on
-
[1]
Hogg, D. W., & O’Neil, M. 2016, IEEE Transactions on Pattern Analysis and Machine Intelligence, 38, 252, doi: 10.1109/TPAMI.2015.2448083
-
[2]
Chatzopoulos, E., Wheeler, J. C., & Vink´ o, J. 2012, ApJ, 746, 121, doi: 10.1088/0004-637X/746/2/121
-
[3]
Chatzopoulos, E., Wheeler, J. C., Vink´ o, J., Horv´ ath, Z. L., & Nagy, A. 2013, ApJ, 773, 76, doi: 10.1088/0004-637X/773/1/76
-
[4]
2020, MNRAS, 492, 2208, doi: 10.1093/mnras/stz3598
Clark, P., et al. 2020, MNRAS, 492, 2208, doi: 10.1093/mnras/stz3598
-
[5]
Davis, K. W., et al. 2023, MNRAS, 523, 2530, doi: 10.1093/mnras/stad1433
-
[6]
Dessart, L., Hillier, D. J., & Kuncarayakti, H. 2022, A&A, 658, A130, doi: 10.1051/0004-6361/202142436
-
[7]
Drout, M. R., et al. 2014, ApJ, 794, 23, doi: 10.1088/0004-637X/794/1/23
-
[8]
2022, Nature, 601, 201, doi: 10.1038/s41586-021-04155-1
Gal-Yam, A., et al. 2022, Nature, 601, 201, doi: 10.1038/s41586-021-04155-1
-
[9]
2020, ApJ, 889, 170, doi: 10.3847/1538-4357/ab6328 Guti´ errez, C
Gangopadhyay, A., et al. 2020, ApJ, 889, 170, doi: 10.3847/1538-4357/ab6328 Guti´ errez, C. P., et al. 2024, ApJ, 977, 162, doi: 10.3847/1538-4357/ad89a5
-
[10]
Ho, A. Y. Q., et al. 2019, ApJ, 887, 169, doi: 10.3847/1538-4357/ab55ec
-
[11]
Ho, A. Y. Q., et al. 2023, ApJ, 949, 120, doi: 10.3847/1538-4357/acc533
-
[12]
2017, ApJ, 836, 158, doi: 10.3847/1538-4357/836/2/158
Hosseinzadeh, G., et al. 2017, ApJ, 836, 158, doi: 10.3847/1538-4357/836/2/158
-
[13]
2019, Nature Astronomy, 3, 697, doi: 10.1038/s41550-019-0854-4
Inserra, C. 2019, Nature Astronomy, 3, 697, doi: 10.1038/s41550-019-0854-4
-
[14]
2022, ApJL, 933, L36, doi: 10.3847/2041-8213/ac7390
Jiang, J.-a., Yasuda, N., Maeda, K., et al. 2022, ApJL, 933, L36, doi: 10.3847/2041-8213/ac7390
-
[15]
Type Ib Supernovae are bluer than Type Ic Supernovae
Jin, H., et al. 2026, arXiv e-prints, arXiv:2605.01200, doi: 10.48550/arXiv.2605.01200
work page internal anchor Pith review Pith/arXiv arXiv doi:10.48550/arxiv.2605.01200 2026
-
[16]
Kool, E. C., et al. 2021, A&A, 652, A136, doi: 10.1051/0004-6361/202039137
-
[17]
2022, ApJL, 935, L34, doi: 10.3847/2041-8213/ac86d2
Liu, J.-F., Zhu, J.-P., Liu, L.-D., Yu, Y.-W., & Zhang, B. 2022, ApJL, 935, L34, doi: 10.3847/2041-8213/ac86d2
-
[18]
2025, ApJ, 992, 20, doi: 10.3847/1538-4357/adfed6
Liu, L.-D., Zhang, Y.-H., Yu, Y.-W., et al. 2025, ApJ, 992, 20, doi: 10.3847/1538-4357/adfed6
-
[19]
Maeda, K., & Moriya, T. J. 2022, ApJ, 927, 25, doi: 10.3847/1538-4357/ac4672
-
[20]
2019, ApJ, 872, 18, doi: 10.3847/1538-4357/aafa01
Margutti, R., et al. 2019, ApJ, 872, 18, doi: 10.3847/1538-4357/aafa01
-
[21]
2023, A&A, 673, A27, doi: 10.1051/0004-6361/202346084
Nagao, T., et al. 2023, A&A, 673, A27, doi: 10.1051/0004-6361/202346084
-
[22]
2015, MNRAS, 452, 3869, doi: 10.1093/mnras/stv1522
Nicholl, M., et al. 2015, MNRAS, 452, 3869, doi: 10.1093/mnras/stv1522
-
[23]
2015, MNRAS, 449, 1921, doi: 10.1093/mnras/stu2745
Pastorello, A., et al. 2015, MNRAS, 449, 1921, doi: 10.1093/mnras/stu2745
-
[24]
2016, MNRAS, 456, 853, doi: 10.1093/mnras/stv2634
Pastorello, A., et al. 2016, MNRAS, 456, 853, doi: 10.1093/mnras/stv2634
-
[25]
2022a, ApJ, 926, 125, doi: 10.3847/1538-4357/ac3e63
Pellegrino, C., et al. 2022a, ApJ, 926, 125, doi: 10.3847/1538-4357/ac3e63
-
[26]
2022b, ApJ, 938, 73, doi: 10.3847/1538-4357/ac8ff6
Pellegrino, C., et al. 2022b, ApJ, 938, 73, doi: 10.3847/1538-4357/ac8ff6
-
[27]
Perley, D. A., et al. 2019, MNRAS, 484, 1031, doi: 10.1093/mnras/sty3420
-
[28]
Perley, D. A., et al. 2021, MNRAS, 508, 5138, doi: 10.1093/mnras/stab2785
-
[29]
Perley, D. A., et al. 2022, ApJ, 927, 180, doi: 10.3847/1538-4357/ac478e
-
[30]
2018, MNRAS, 481, 894, doi: 10.1093/mnras/sty2309
Pursiainen, M., et al. 2018, MNRAS, 481, 894, doi: 10.1093/mnras/sty2309
-
[31]
2006, Computational Statistics & Data Analysis, 50, 1583, doi: 10.1016/j.csda.2005.01.014
Schmid, F., & Schmidt, A. 2006, Computational Statistics & Data Analysis, 50, 1583, doi: 10.1016/j.csda.2005.01.014
-
[32]
Scott, D. W. 1992, Multivariate Density Estimation:
1992
-
[33]
Theory, Practice, and Visualization (New York: John Wiley & Sons), doi: 10.1002/9780470316849
-
[34]
Silverman, B. W. 1986, Density Estimation for Statistics and Data Analysis (London: Chapman and Hall)
1986
-
[35]
2024, A&A, 691, A156, doi: 10.1051/0004-6361/202451131
Wang, Z.-Y., et al. 2024, A&A, 691, A156, doi: 10.1051/0004-6361/202451131
-
[36]
2025, A&A, 700, A156, doi: 10.1051/0004-6361/202554768
Wang, Z.-Y., et al. 2025, A&A, 700, A156, doi: 10.1051/0004-6361/202554768
-
[37]
2021, ApJ, 910, 42, doi: 10.3847/1538-4357/abdeba
Xiang, D., et al. 2021, ApJ, 910, 42, doi: 10.3847/1538-4357/abdeba
-
[38]
2022, ApJ, 934, 104, doi: 10.3847/1538-4357/ac7a41
Yao, Y., et al. 2022, ApJ, 934, 104, doi: 10.3847/1538-4357/ac7a41
-
[39]
2015, ApJL, 806, L6, doi: 10.1088/2041-8205/806/1/L6
Yu, Y.-W., Li, S.-Z., & Dai, Z.-G. 2015, ApJL, 806, L6, doi: 10.1088/2041-8205/806/1/L6
-
[40]
2026, ApJ, 999, 186, doi: 10.3847/1538-4357/ae434a
Zhang, Y.-H., Liu, L.-D., Du, Z.-X., et al. 2026, ApJ, 999, 186, doi: 10.3847/1538-4357/ae434a
discussion (0)
Sign in with ORCID, Apple, or X to comment. Anyone can read and Pith papers without signing in.