Projection-Enhanced Disk Breaks: Evidence from Deep Photometric Decomposition
Pith reviewed 2026-07-02 08:50 UTC · model grok-4.3
The pith
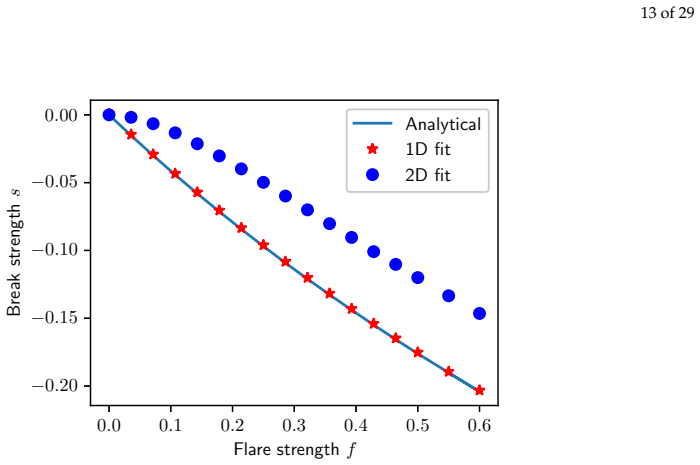
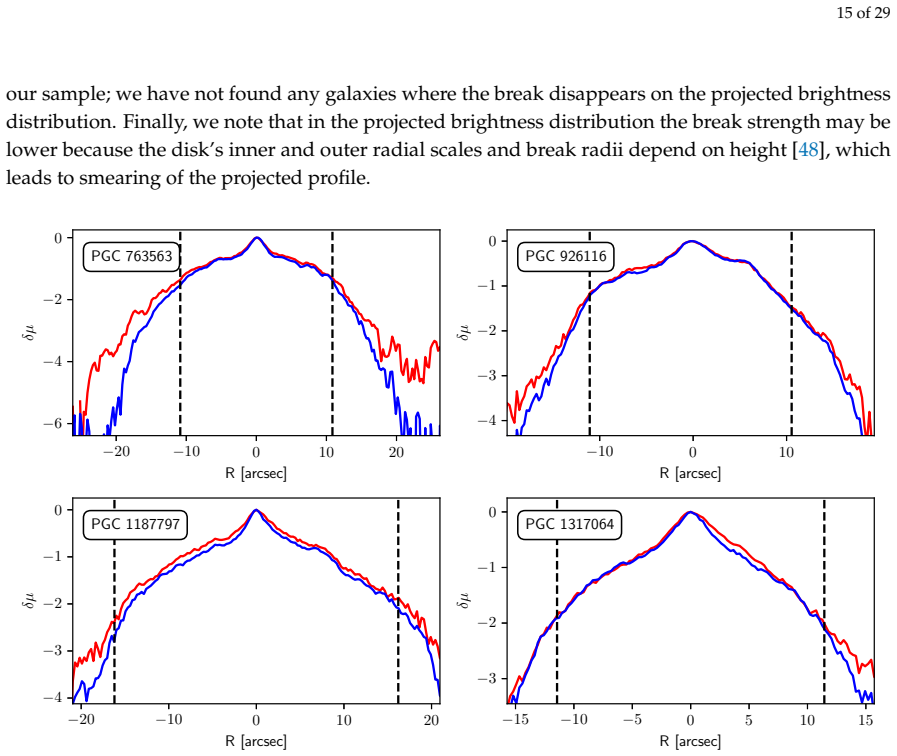
Projection effects in edge-on galaxies produce Type II breaks in about 90 percent of disks.
A machine-rendered reading of the paper's core claim, the machinery that carries it, and where it could break.
Core claim
Photometric decomposition of 375 edge-on galaxies shows Type II breaks in approximately 90 percent of the disks. This rate is substantially higher than the fractions reported in previous studies of galaxies at mixed inclinations. The difference is explained by projection, which enhances the observed surface brightness at the break radius in edge-on systems. The authors report that tests rule out flaring and two-disk composition as the main cause of the observed breaks.
What carries the argument
Photometric decomposition applied to deep images of edge-on galaxies to locate and classify radial breaks in surface-brightness profiles, with projection as the mechanism that increases break contrast.
If this is right
- The intrinsic fraction of Type II breaks across all disk orientations is lower than the rate measured in edge-on samples alone.
- Break detection efficiency depends on the inclination of the galaxy to the line of sight.
- Studies that average over random orientations will report lower Type II fractions unless they correct for projection.
- Edge-on systems give a magnified view of break properties that must be deprojected to compare with face-on disks.
Where Pith is reading between the lines
- Models that tie breaks to star-formation thresholds or bar-driven redistribution may need to predict how the observed break strength varies with viewing angle.
- Future wide-field surveys could select subsamples by inclination to test whether the Type II fraction drops smoothly as galaxies become more face-on.
- If projection enhances break visibility, then the physical scale lengths measured at the break in edge-on galaxies may require an inclination-dependent correction before they are used in scaling relations.
Load-bearing premise
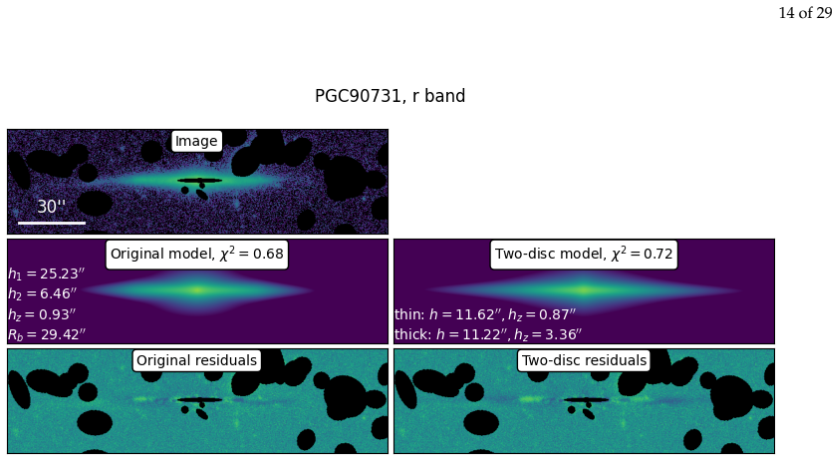
The breaks detected in the edge-on sample reflect intrinsic disk structure rather than being produced mainly by disk flaring or the superposition of two separate disks.
What would settle it
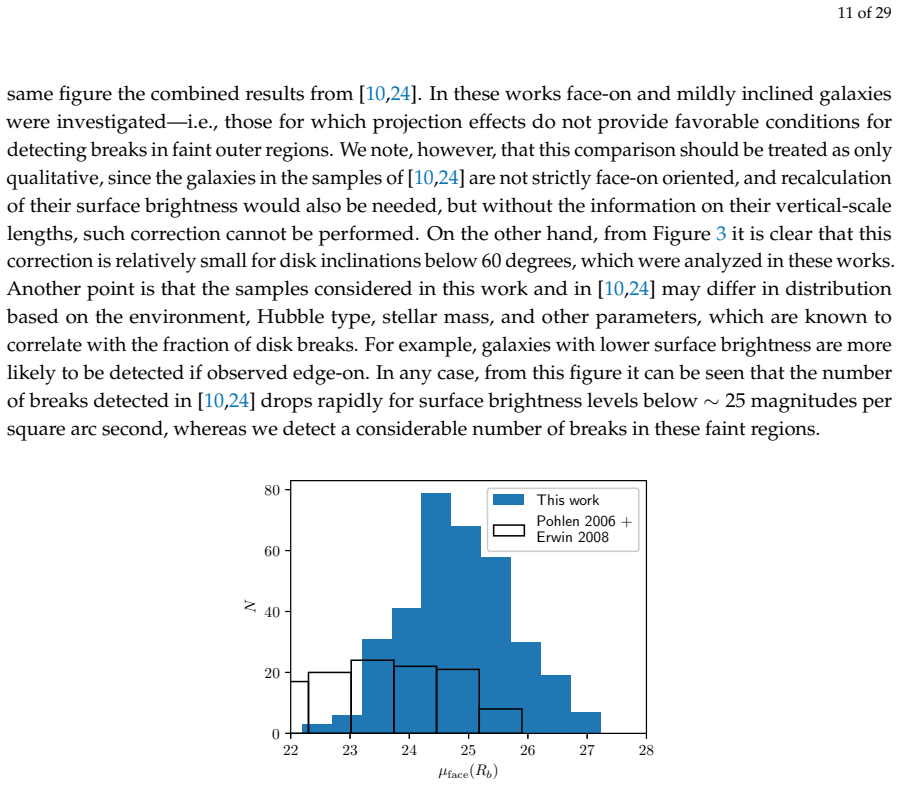
A large sample of face-on galaxies analyzed with the same decomposition method showing a Type II fraction near 50 percent rather than 90 percent would indicate that projection is not the dominant driver of the high edge-on rate.
Figures
read the original abstract
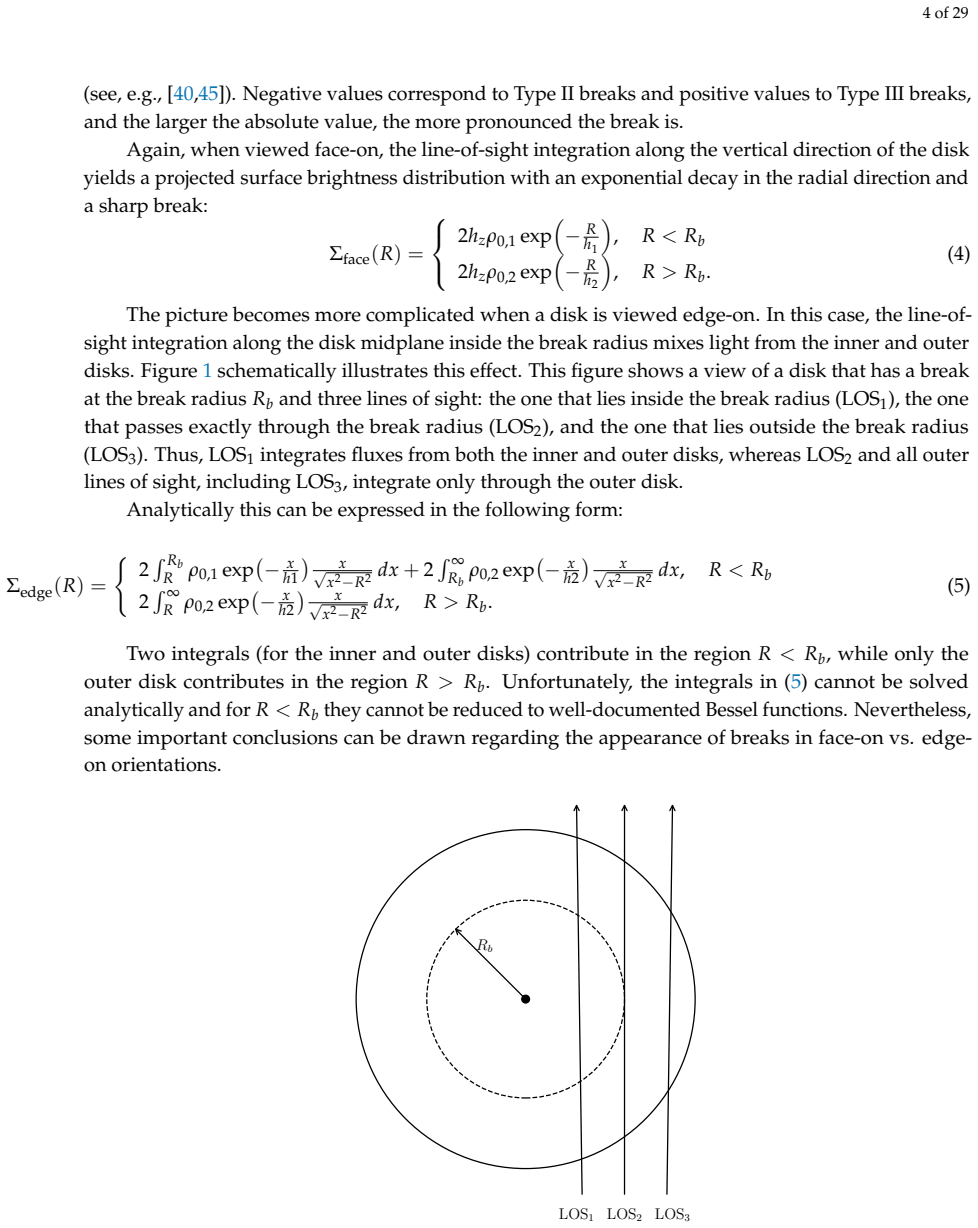
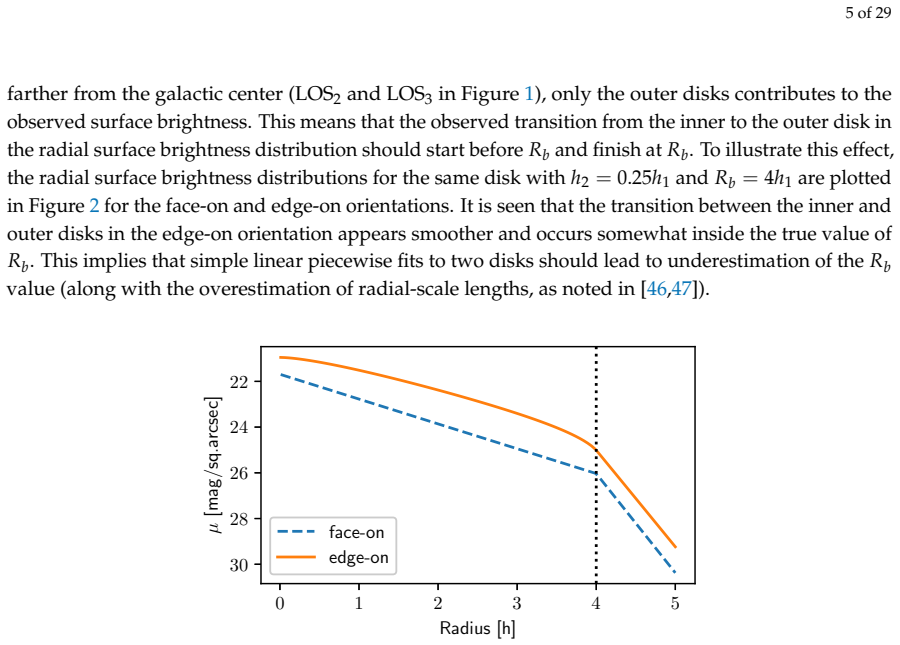
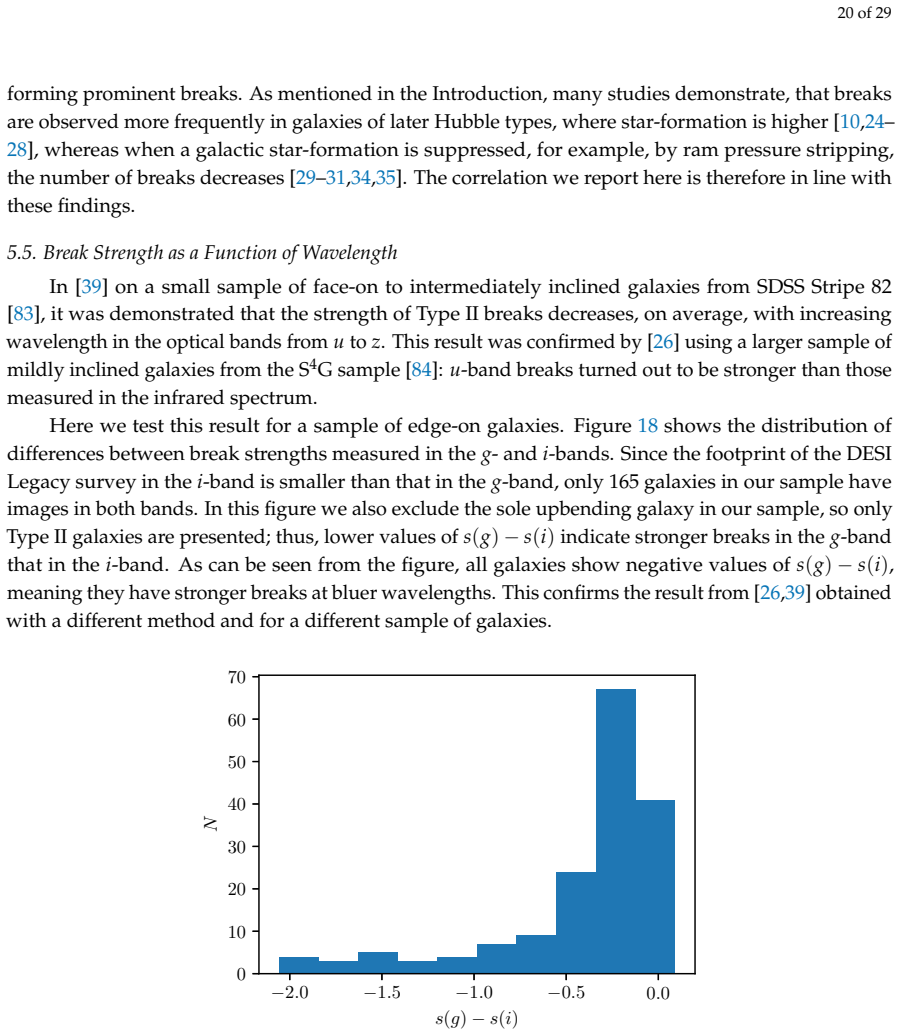
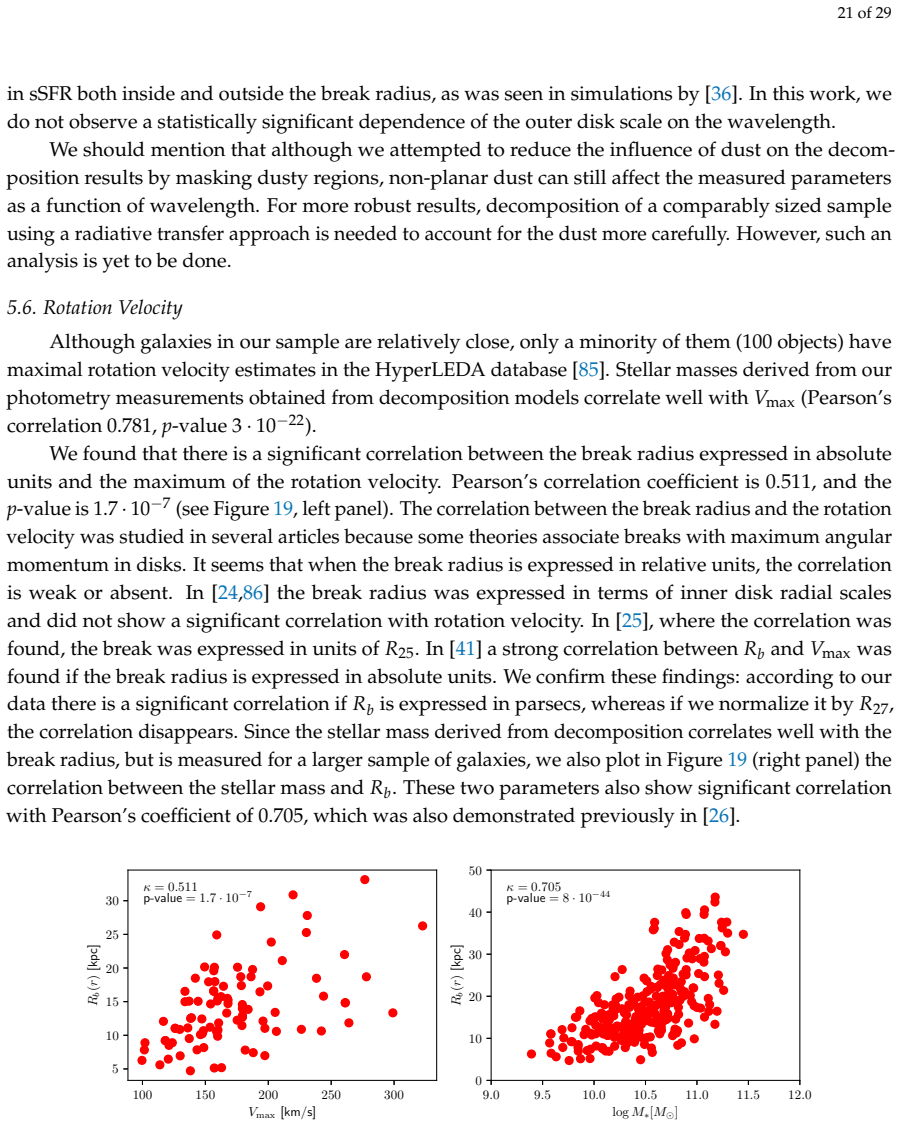
Radial brightness profiles of disk galaxies often exhibit so-called breaks -- locations where their exponential-scale length abruptly changes. Some galaxies have downbending (Type II) breaks, where their brightness decays faster in outer regions, while other have upbending (Type III) breaks, resulting in more extended outer disks or envelopes. Disk radial profiles without any breaks (Type I) appear to constitute a minority. The exact fractions of different break types depend on many galactic parameters -- such as Hubble type, stellar mass, spatial environment, and bar presence -- and vary significantly across different studies. Another source of discrepancy is the orientation of galaxies: projection effects may play an important role in break detectability. In this work, we utilize DESI Legacy DR10 imaging to perform photometric decomposition of a sample of 375 edge-on galaxies and investigate their radial breaks. We find that the vast majority (~90%) of disks in our sample have Type II breaks, which is a considerably higher fraction than in many previous works (~50%). We carefully tested our results to check if observed breaks can be a result of flaring or two-disk composition. We showed that a high fraction of Type II breaks can be attributed to projection effects, which enhance the observed surface brightness of breaks in edge-on galaxies.
Editorial analysis
A structured set of objections, weighed in public.
Referee Report
Summary. The manuscript reports photometric decomposition of radial brightness profiles for a sample of 375 edge-on galaxies drawn from DESI Legacy DR10 imaging. It finds that ~90% of the disks exhibit Type II (downbending) breaks, a substantially higher fraction than the ~50% reported in many prior studies, and attributes the difference to projection effects that enhance break visibility in edge-on systems. The authors state that they performed careful tests to exclude flaring and two-disk composition as primary causes.
Significance. If the decomposition pipeline is robust and the tests against flaring and two-disk models are quantitatively convincing, the result would demonstrate that orientation and projection are major drivers of apparent break statistics, helping to reconcile discrepancies across samples with differing inclinations.
major comments (1)
- [Abstract and tests section] Abstract and the section describing tests for alternatives: the statement that 'careful tests' were performed to check whether observed breaks can result from flaring or two-disk composition supplies no description of the model-construction procedure, no quantitative comparison metrics (e.g., χ^{2}, BIC, or residual profiles), and no tabulated or plotted outcomes showing that these alternatives fail to reproduce the observed break statistics or radial profiles. Because the central claim that projection effects explain the elevated Type II fraction rests on having ruled out these alternatives, the absence of this information is load-bearing.
minor comments (1)
- The abstract and methods summary omit any description of the photometric decomposition algorithm, the functional forms adopted for the disk components, the treatment of sky subtraction or PSF convolution, and the criteria used to classify breaks as Type I/II/III.
Simulated Author's Rebuttal
We thank the referee for their careful reading of the manuscript and for highlighting the need for greater detail on our tests. We address the major comment below.
read point-by-point responses
-
Referee: [Abstract and tests section] Abstract and the section describing tests for alternatives: the statement that 'careful tests' were performed to check whether observed breaks can result from flaring or two-disk composition supplies no description of the model-construction procedure, no quantitative comparison metrics (e.g., χ^{2}, BIC, or residual profiles), and no tabulated or plotted outcomes showing that these alternatives fail to reproduce the observed break statistics or radial profiles. Because the central claim that projection effects explain the elevated Type II fraction rests on having ruled out these alternatives, the absence of this information is load-bearing.
Authors: We agree that the current description of the tests is insufficient to fully support the central claim. In the revised manuscript we will add a dedicated subsection that (i) describes the construction of the flaring and two-disk models, (ii) reports quantitative metrics (χ², BIC, and AIC) comparing these alternatives to the fiducial single-disk models with breaks, and (iii) presents residual profiles, summary tables, and figures showing that the alternative models do not reproduce the observed break statistics or radial profiles as well as the fiducial models. These additions will make the exclusion of flaring and two-disk explanations explicit and quantitative. revision: yes
Circularity Check
No circularity: empirical decomposition of observed profiles
full rationale
The paper performs photometric decomposition on DESI Legacy imaging of 375 edge-on galaxies and reports an observed ~90% Type II break fraction, attributing the excess to projection. This is a direct measurement from data fitting, not a derivation that reduces to its own inputs by construction. No equations, fitted parameters, or uniqueness theorems are invoked that would make the central statistic equivalent to the input sample by definition. The mention of 'careful tests' for flaring or two-disk models is an empirical check, not a self-referential loop. Self-citations are absent from the provided text and not load-bearing. The result remains falsifiable against external samples and is therefore scored 0.
Axiom & Free-Parameter Ledger
free parameters (1)
- exponential scale lengths
axioms (1)
- domain assumption The surface brightness profiles of disk galaxies can be modeled as piecewise exponential functions with breaks.
Reference graph
Works this paper leans on
-
[1]
image−model
The Decomposition To obtain information about disk breaks in our sample galaxies, we used the algorithm of photometric decomposition. The goal of this approach is to construct a model of a galaxy image using a set of analytical functions, such that each function corresponds to a galactic component. The values of the galactic parameters are inferred from t...
-
[2]
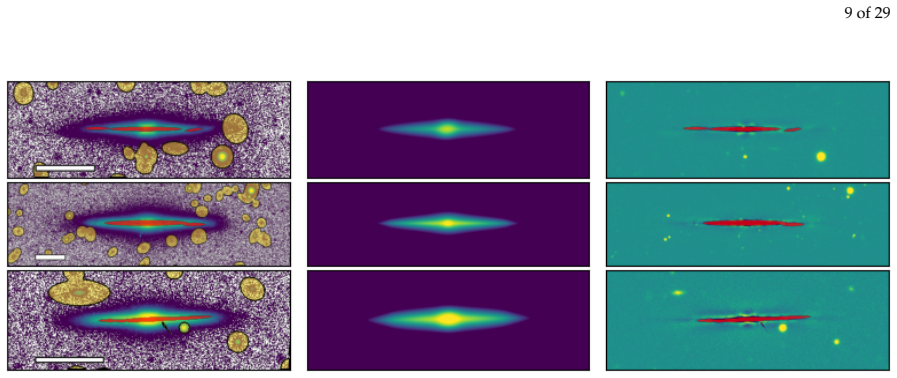
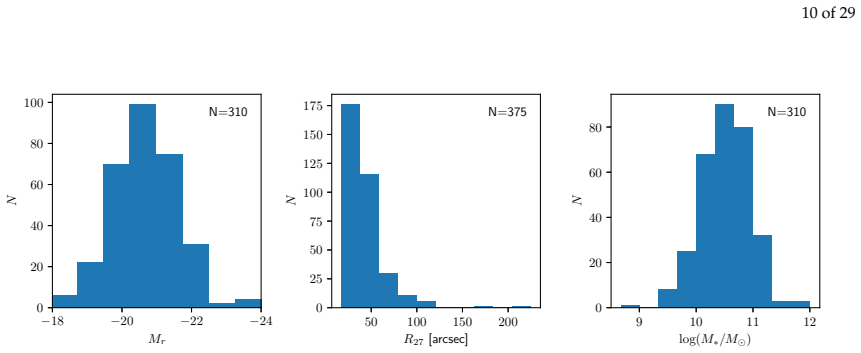
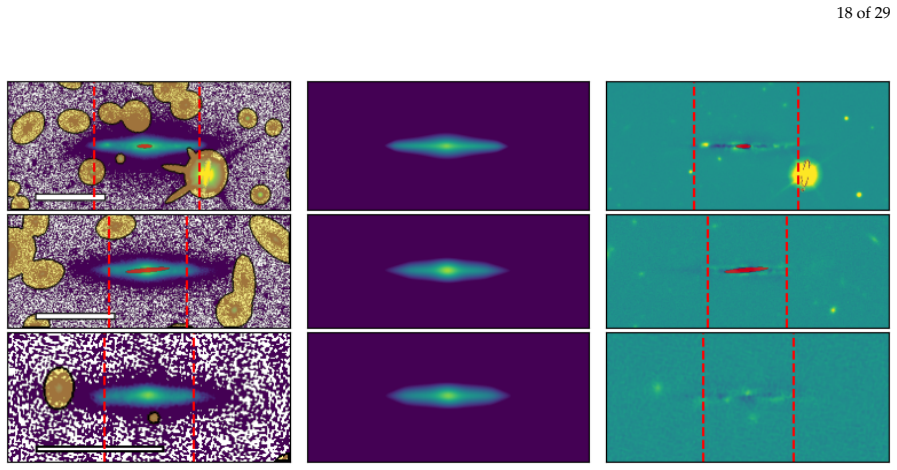
Results Figure 6 shows the distributions of the galaxies in our sample according to several parameters inferred from the decomposition. The left panel shows the distribution of absolute magnitudes in the r- band, which were computed from the integrated magnitudes of bulge and disk models, and luminosity distances to galaxies according to the NED https://n...
-
[3]
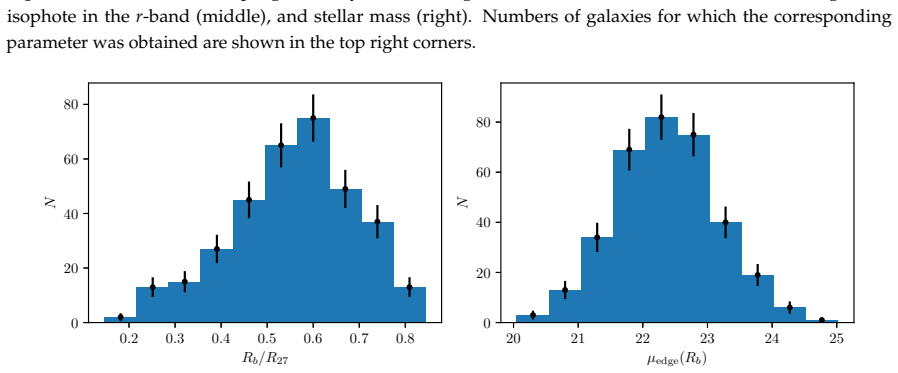
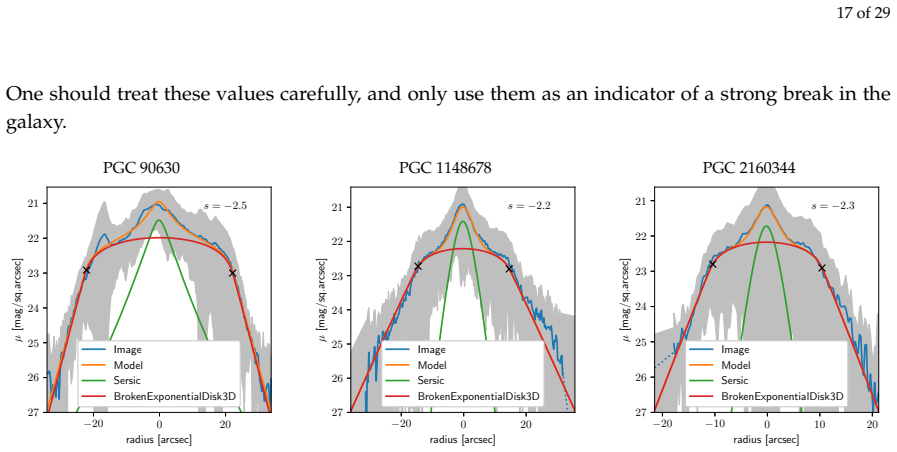
2 0 . 3 0 . 4 0 . 5 0 . 6 0 . 7 0 . 8 Rb/R 27 0 20 40 60 80N 20 21 22 23 24 25 µedge(Rb) 0 20 40 60 80N Figure 7.Left: Distribution of the sample break radii normalized by the disk’s 27-th magnitude isophote in the r-band. Right: Distribution of breaks by the surface brightnesses at the break point in the r-band. Error bars show Poisson √ Nuncertainty. di...
2006
-
[4]
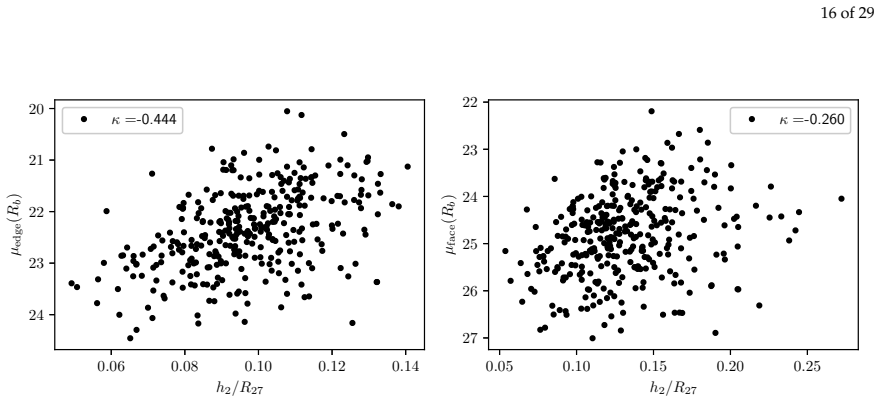
06 0 . 08 0 . 10 0 . 12 0 . 14 h2/R 27 20 21 22 23 24 µedge(Rb) κ =-0.444
-
[5]
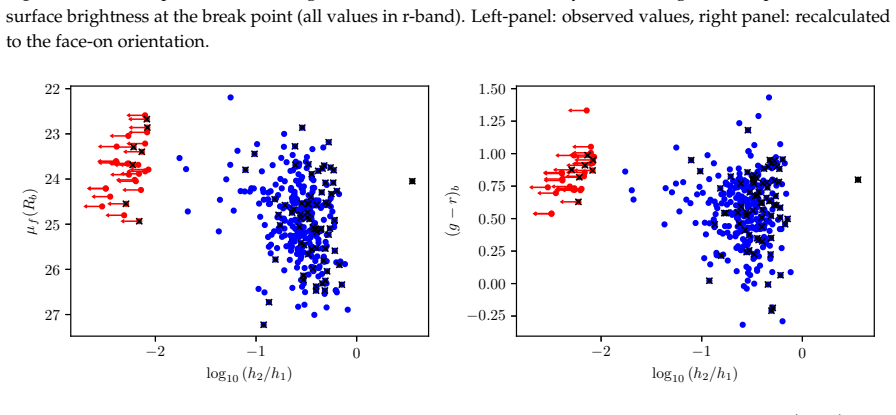
05 0 . 10 0 . 15 0 . 20 0 . 25 h2/R 27 22 23 24 25 26 27 µface(Rb) κ =-0.260 Figure 12.Radial exponential-scale length of an outer disk (normalized by the 27th magnitude isophote radius) vs. surface brightness at the break point (all values in r-band). Left-panel: observed values, right panel: recalculated to the face-on orientation. −2 −1 0 log10 (h2/h 1...
-
[6]
flat inner disks
50 (g − r)b Figure 13.Left panel: face-on surface brightness for break point vs. break strength. Right panel: (g−r) color for break point vs. break strength. Red dots mark disks with strength <− 2.0, and blue dots mark those with strength >− 2.0. The black dot is a sole galaxy with a Type III break (PGC 731, see Appendix C for details about this object). ...
-
[7]
2 Image-model [mag/sq.arcsec]
-
[8]
image-model
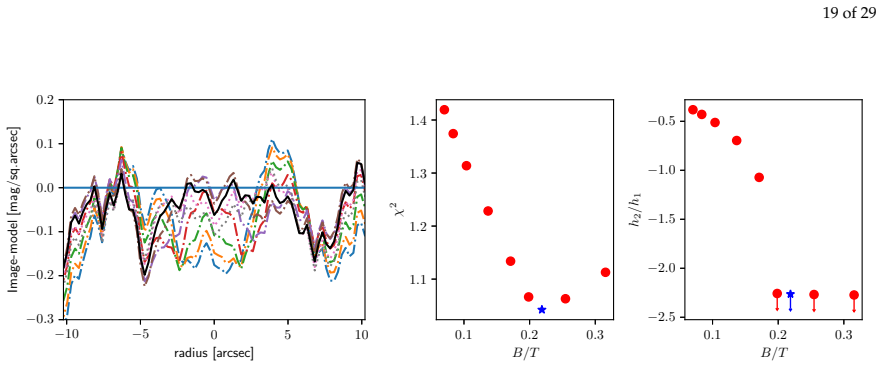
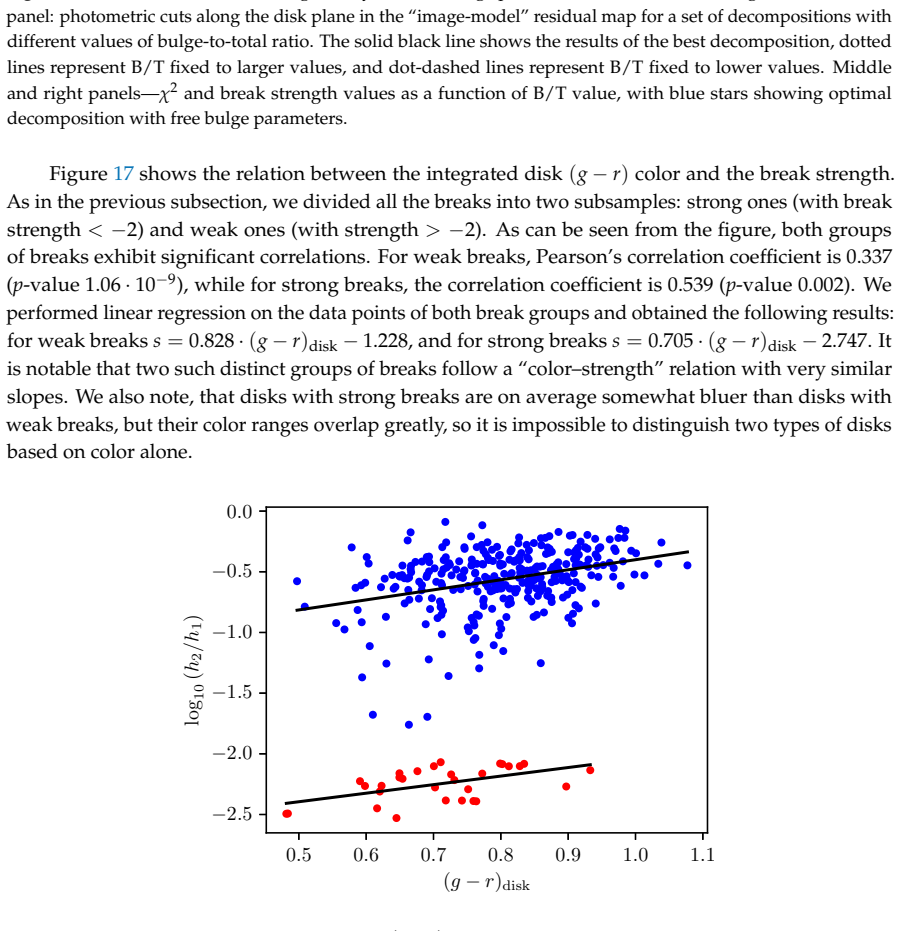
1 0 . 2 0 . 3 B/T −2. 5 −2. 0 −1. 5 −1. 0 −0. 5 h2/h 1 Figure 16.Results of a test for the degeneracy between bulge parameters and the break strength (see text). Left panel: photometric cuts along the disk plane in the “image-model” residual map for a set of decompositions with different values of bulge-to-total ratio. The solid black line shows the resul...
-
[9]
0 9 . 5 10 . 0 10 . 5 11 . 0 11 . 5 12 . 0 log M∗[M⊙ ] 0 10 20 30 40 50Rb(r) [kpc] κ = 0. 705 p-value = 8 · 10− 44 Figure 19.Break radius inr-band (left) and stellar mass (right) vs. maximum rotation velocity
-
[10]
break strength vs. break color
Conclusions In this work, we performed two-dimensional photometric decomposition of a sample of 375 disk galaxies viewed in the edge-on orientation. To perform the decomposition, we utilized g-, r- and i-band images from the DESI Legacy DR10 survey, which is considerably more in-depth than many older wide-field surveys—a factor crucial for this task. Our ...
-
[11]
The Fundamental Properties of Galaxies and a New Galaxy Classification System
Conselice, C.J. The fundamental properties of galaxies and a new galaxy classification system. MNRAS 2006,373, 1389–1408, [arXiv:astro-ph/astro-ph/0610016]. https://doi.org/10.1111/j.1365-2966.2006.11114.x
work page internal anchor Pith review Pith/arXiv arXiv doi:10.1111/j.1365-2966.2006.11114.x 2006
-
[12]
Kelvin, L.S.; Driver, S.P .; Robotham, A.S.G.; Graham, A.W.; Phillipps, S.; Agius, N.K.; Alpaslan, M.; Baldry, I.; Bamford, S.P .; Bland-Hawthorn, J.; et al. Galaxy And Mass Assembly (GAMA): ugrizYJHK Sérsic luminosity functions and the cosmic spectral energy distribution by Hubble type. MNRAS2014,439, 1245–1269, [arXiv:astro-ph.CO/1401.1817]. https://doi...
work page internal anchor Pith review Pith/arXiv arXiv doi:10.1093/mnras/stt2391
-
[13]
Detailed Decomposition of Galaxy Images. II. Beyond Axisymmetric Models
Peng, C.Y.; Ho, L.C.; Impey, C.D.; Rix, H.W. Detailed Decomposition of Galaxy Images. II. Beyond Axisymmetric Models. AJ2010,139, 2097–2129, [arXiv:astro-ph.CO/0912.0731]. https://doi.org/10.1088/ 0004-6256/139/6/2097
work page internal anchor Pith review Pith/arXiv arXiv 2097
-
[14]
Imfit: A Fast, Flexible New Program for Astronomical Image Fitting
Erwin, P . IMFIT: A Fast, Flexible New Program for Astronomical Image Fitting. ApJ2015,799, 226, [arXiv:astro-ph.IM/1408.1097]. https://doi.org/10.1088/0004-637X/799/2/226. 25 of 29 3.0 3.5 4.0 4.5 5.0 5.5 6.0 rb/h 1 0.1 0.2 0.3 0.4 0.5 0.6 0.7 0.8h2/h 1
work page internal anchor Pith review Pith/arXiv arXiv doi:10.1088/0004-637x/799/2/226
-
[15]
8 µ edge − µ face Figure A1.Difference between surface brightness in face-on and edge-on orientations (in magnitudes) as a function ofh 2 andR b
-
[16]
Influence of the atmospheric and instrumental dispersion on the brightness distribution in a galaxy.Boletin de la Asociacion Argentina de Astronomia La Plata Argentina1963,6, 41–43
Sérsic, J.L. Influence of the atmospheric and instrumental dispersion on the brightness distribution in a galaxy.Boletin de la Asociacion Argentina de Astronomia La Plata Argentina1963,6, 41–43
-
[17]
The Luminosity Gradient of Messier 33.Harvard College Observatory Bulletin1940,914, 9–10
Patterson, F.S. The Luminosity Gradient of Messier 33.Harvard College Observatory Bulletin1940,914, 9–10
-
[18]
Photoelectric Photometry of Messier 33 IN the u, b, v, System
de Vaucouleurs, G. Photoelectric Photometry of Messier 33 IN the u, b, v, System. ApJ1959,130, 728. https://doi.org/10.1086/146764
-
[19]
, year = 1970, month = jun, volume =
Freeman, K.C. On the Disks of Spiral and S0 Galaxies. ApJ1970,160, 811. https://doi.org/10.1086/150474
-
[20]
Optical surface photometry of eight spiral galaxies studied in Westerbork
van der Kruit, P .C. Optical surface photometry of eight spiral galaxies studied in Westerbork. A&AS1979, 38, 15–38
-
[21]
The Outer Disks of Early-Type Galaxies. I. Surface-Brightness Profiles of Barred Galaxies
Erwin, P .; Pohlen, M.; Beckman, J.E. The Outer Disks of Early-Type Galaxies. I. Surface-Brightness Profiles of Barred Galaxies. AJ2008,135, 20–54, [arXiv:astro-ph/0709.3505]. https://doi.org/10.1088/0004-6256/135/ 1/20
work page internal anchor Pith review Pith/arXiv arXiv doi:10.1088/0004-6256/135/
-
[22]
Exponential bulges and antitruncated disks in lenticular galaxies
Sil’chenko, O.K. Exponential bulges and antitruncated disks in lenticular galaxies. In Proceedings of the The Galaxy Disk in Cosmological Context; Andersen, J.; Nordströara.; m, B.; Bland-Hawthorn, J., Eds., 2009, Vol. 254,IAU Symposium, pp. 173–178, [arXiv:astro-ph/0807.1817]. https://doi.org/10.1017/S1743921308027567
work page internal anchor Pith review Pith/arXiv arXiv doi:10.1017/s1743921308027567 2009
-
[23]
On the galactic law of rotation
Mestel, L. On the galactic law of rotation. MNRAS1963,126, 553. https://doi.org/10.1093/mnras/126.6.553
-
[24]
Sellwood, J.A.; Binney, J.J. Radial mixing in galactic discs. MNRAS2002,336, 785–796, [arXiv:astro-ph/astro- ph/0203510]. https://doi.org/10.1046/j.1365-8711.2002.05806.x
-
[25]
Beyond Inside-Out Growth: Formation and Evolution of Disk Outskirts
Roškar, R.; Debattista, V .P .; Stinson, G.S.; Quinn, T.R.; Kaufmann, T.; Wadsley, J. Beyond Inside-Out Growth: Formation and Evolution of Disk Outskirts. ApJ2008,675, L65, [arXiv:astro-ph/0710.5523]. https://doi.org/10.1086/586734
work page internal anchor Pith review Pith/arXiv arXiv doi:10.1086/586734
-
[26]
Galaxy models with live halos
Sellwood, J.A. Galaxy models with live halos. A&A1980,89, 296–307
-
[27]
Angular Momentum Redistribution and the Evolution and Morphology of Bars
Athanassoula, L. Angular Momentum Redistribution and the Evolution and Morphology of Bars. InGalaxies and Chaos; Contopoulos, G.; Voglis, N., Eds.; 2003; Vol. 626, pp. 313–326. https://doi.org/10.1007/978-3-54 0-45040-5_26
-
[28]
The Secular Evolution of Disk Structural Parameters
Debattista, V .P .; Mayer, L.; Carollo, C.M.; Moore, B.; Wadsley, J.; Quinn, T. The Secular Evolution of Disk Structural Parameters. ApJ2006,645, 209–227, [arXiv:astro-ph/astro-ph/0509310]. https://doi.org/10.108 6/504147. 26 of 29 Figure A2.Decomposition results for PGC 731. Top: 2D maps as in Figure 5; bottom: radial slice as in Figure 4. Vertical dashe...
work page internal anchor Pith review Pith/arXiv arXiv
-
[29]
The impact of bars on disk breaks as probed by S4G imaging
Muñoz-Mateos, J.C.; Sheth, K.; Gil de Paz, A.; Meidt, S.; Athanassoula, E.; Bosma, A.; Comerón, S.; Elmegreen, D.M.; Elmegreen, B.G.; Erroz-Ferrer, S.; et al. The Impact of Bars on Disk Breaks as Probed by S 4G Imaging. ApJ2013,771, 59, [arXiv:astro-ph.CO/1304.6083]. https://doi.org/10.1088/0004-637X/771/1/59
work page internal anchor Pith review Pith/arXiv arXiv doi:10.1088/0004-637x/771/1/59
-
[30]
Goldreich, P .; Lynden-Bell, D. I. Gravitational stability of uniformly rotating disks. MNRAS1965,130, 97. https://doi.org/10.1093/mnras/130.2.97
-
[31]
The Star Formation Law in Galactic Disks
Kennicutt, Jr., R.C. The Star Formation Law in Galactic Disks. ApJ1989,344, 685. https://doi.org/10.1086/ 167834
-
[32]
Color Profiles of Spiral Galaxies: Clues on Outer-Disk Formation Scenarios
Bakos, J.; Trujillo, I.; Pohlen, M. Color Profiles of Spiral Galaxies: Clues on Outer-Disk Formation Scenarios. ApJ2008,683, L103, [arXiv:astro-ph/0807.2776]. https://doi.org/10.1086/591671
work page internal anchor Pith review Pith/arXiv arXiv doi:10.1086/591671
-
[33]
The edges of galaxies: Tracing the limits of star formation
Chamba, N.; Trujillo, I.; Knapen, J.H. The edges of galaxies: Tracing the limits of star formation. A&A2022, 667, A87, [arXiv:astro-ph.GA/2209.05497]. https://doi.org/10.1051/0004-6361/202243612
-
[34]
Revisiting the structure of galactic disks with deep imaging
Raji, S.; Trujillo, I.; Buitrago, F.; Golini, G.; Cejudo, I.R. Revisiting the structure of galactic disks with deep imaging. A&A2025,704, A335, [arXiv:astro-ph.GA/2510.24900]. https://doi.org/10.1051/0004-6361/2025 56488
-
[35]
The structure of galactic disks: Studying late-type spiral galaxies using SDSS
Pohlen, M.; Trujillo, I. The structure of galactic disks. Studying late-type spiral galaxies using SDSS. A&A 2006,454, 759–772, [arXiv:astro-ph/astro-ph/0603682]. https://doi.org/10.1051/0004-6361:20064883
work page internal anchor Pith review Pith/arXiv arXiv doi:10.1051/0004-6361:20064883 2006
-
[36]
Gutiérrez, L.; Erwin, P .; Aladro, R.; Beckman, J.E. The Outer Disks of Early-type Galaxies. II. Surface- brightness Profiles of Unbarred Galaxies and Trends with Hubble Type. AJ2011,142, 145, [arXiv:astro- ph.CO/1108.3662]. https://doi.org/10.1088/0004-6256/142/5/145
work page internal anchor Pith review Pith/arXiv arXiv doi:10.1088/0004-6256/142/5/145
-
[37]
Laine, J.; Laurikainen, E.; Salo, H. Influence of galaxy stellar mass and observed wavelength on disc breaks in S 4G, NIRS0S, and SDSS data. A&A2016,596, A25, [arXiv:astro-ph.GA/1610.00610]. https: //doi.org/10.1051/0004-6361/201628397
work page internal anchor Pith review Pith/arXiv arXiv doi:10.1051/0004-6361/201628397
-
[38]
Two-dimensional multi-component photometric decomposition of CALIFA galaxies
Méndez-Abreu, J.; Ruiz-Lara, T.; Sánchez-Menguiano, L.; de Lorenzo-Cáceres, A.; Costantin, L.; Catalán- Torrecilla, C.; Florido, E.; Aguerri, J.A.L.; Bland-Hawthorn, J.; Corsini, E.M.; et al. Two-dimensional multi-component photometric decomposition of CALIFA galaxies. A&A2017,598, A32, [arXiv:astro- ph.GA/1610.05324]. https://doi.org/10.1051/0004-6361/201629525
work page internal anchor Pith review Pith/arXiv arXiv doi:10.1051/0004-6361/201629525
-
[39]
New Constraints on the Origin of Surface Brightness Profile Breaks of Disk Galaxies from MaNGA
Tang, Y.; Chen, Q.; Zhang, H.X.; Lin, Z.; Chen, G.; Gao, Y.; Liang, Z.; Liu, H.; Kong, X. New Constraints on the Origin of Surface Brightness Profile Breaks of Disk Galaxies from MaNGA. ApJ2020,897, 79, [arXiv:astro-ph.GA/2006.01356]. https://doi.org/10.3847/1538-4357/ab98fd
-
[40]
A Strong Dichotomy in S0 Disk Profiles Between the Virgo Cluster and the Field
Erwin, P .; Gutiérrez, L.; Beckman, J.E. A Strong Dichotomy in S0 Disk Profiles between the Virgo Cluster and the Field. ApJ2012,744, L11, [arXiv:astro-ph.CO/1111.5027]. https://doi.org/10.1088/2041-8205/744/ 1/L11
work page internal anchor Pith review Pith/arXiv arXiv doi:10.1088/2041-8205/744/ 2041
-
[41]
Beyond S\'ersic + exponential disc morphologies in the Coma Cluster
Head, J.T.C.G.; Lucey, J.R.; Hudson, M.J. Beyond Sérsic + exponential disc morphologies in the Coma Cluster. MNRAS2015,453, 3729–3753, [arXiv:astro-ph.GA/1507.07930]. https://doi.org/10.1093/mnras/stv1662
work page internal anchor Pith review Pith/arXiv arXiv doi:10.1093/mnras/stv1662
-
[42]
The effect of environment on the structure of disc galaxies
Pranger, F.; Trujillo, I.; Kelvin, L.S.; Cebrián, M. The effect of environment on the structure of disc galaxies. MNRAS2017,467, 2127–2144, [arXiv:astro-ph.GA/1605.08845]. https://doi.org/10.1093/mnras/stx199
work page internal anchor Pith review Pith/arXiv arXiv doi:10.1093/mnras/stx199
-
[43]
The structure of large-scale stellar disks in cluster lenticular galaxies
Sil’chenko, O.K.; Kniazev, A.Y.; Chudakova, E.M. The Structure of Large-scale Stellar Disks in Cluster Lenticular Galaxies. AJ2018,156, 118, [arXiv:astro-ph.GA/1809.05202]. https://doi.org/10.3847/1538-388 1/aad37b. 27 of 29
work page internal anchor Pith review Pith/arXiv arXiv doi:10.3847/1538-388
-
[44]
The Structure of Stellar Disks in Isolated Lenticular Galaxies
Sil’chenko, O.K.; Kniazev, A.Y.; Chudakova, E.M. The Structure of Stellar Disks in Isolated Lenticular Galaxies. AJ2020,160, 95, [arXiv:astro-ph.GA/2007.01129]. https://doi.org/10.3847/1538-3881/ab9eaf
-
[45]
Pfeffer, J.L.; Bekki, K.; Forbes, D.A.; Couch, W.J.; Koribalski, B.S. Using the EAGLE simulations to elucidate the origin of disc surface brightness profile breaks as a function of mass and environment. MNRAS2022, 509, 261–271, [arXiv:astro-ph.GA/2110.03856]. https://doi.org/10.1093/mnras/stab2934
-
[46]
Mondelin, M.; Bournaud, F.; Cuillandre, J.C.; Codis, S.; Stone, C.; Bolzonella, M.; Sorce, J.G.; Kluge, M.; Hatch, N.A.; Marleau, F.R.; et al. Euclid: Early Release Observations – The surface brightness and colour profiles of the far outskirts of galaxies in the Perseus cluster. A&A2025,699, A214, [arXiv:astro-ph.GA/2506.02745]. https://doi.org/10.1051/00...
-
[47]
Down-bending Breaks in Galactic Disks Are an Intrinsic Byproduct of Inside-out Growth
Chen, L.; Du, M.; Lu, S.; Li, J.; Ho, L.C. Down-bending Breaks in Galactic Disks Are an Intrinsic Byproduct of Inside-out Growth.arXiv e-prints2026, p. arXiv:2602.00626, [arXiv:astro-ph.GA/2602.00626]. https: //doi.org/10.48550/arXiv.2602.00626
work page internal anchor Pith review Pith/arXiv arXiv doi:10.48550/arxiv.2602.00626
-
[48]
Nelson, D.; Springel, V .; Pillepich, A.; Rodriguez-Gomez, V .; Torrey, P .; Genel, S.; Vogelsberger, M.; Pakmor, R.; Marinacci, F.; Weinberger, R.; et al. The IllustrisTNG simulations: public data release.Computational Astrophysics and Cosmology2019,6, 2, [arXiv:astro-ph.GA/1812.05609]. https://doi.org/10.1186/s40668-019 -0028-x
-
[49]
Anti-Truncation of Disks in Early-Type Barred Galaxies
Erwin, P .; Beckman, J.E.; Pohlen, M. Antitruncation of Disks in Early-Type Barred Galaxies. ApJ2005, 626, L81–L84, [arXiv:astro-ph/astro-ph/0505216]. https://doi.org/10.1086/431739
work page internal anchor Pith review Pith/arXiv arXiv doi:10.1086/431739
-
[50]
Deep Surface Brightness Profiles of Spiral Galaxies from SDSS Stripe82: Touching Stellar Halos
Bakos, J.; Trujillo, I. Deep Surface Brightness Profiles of Spiral Galaxies from SDSS Stripe82: Touching Stellar Halos.arXiv e-prints2012, p. arXiv:1204.3082, [arXiv:astro-ph.CO/1204.3082]. https://doi.org/10.48550 /arXiv.1204.3082
work page internal anchor Pith review Pith/arXiv arXiv
-
[51]
The environmental dependence of the structure of outer galactic discs in STAGES spiral galaxies
Maltby, D.T.; Gray, M.E.; Aragón-Salamanca, A.; Wolf, C.; Bell, E.F.; Jogee, S.; Häußler, B.; Barazza, F.D.; Böhm, A.; Jahnke, K. The environmental dependence of the structure of outer galactic discs in STAGES spiral galaxies. MNRAS2012,419, 669–686, [arXiv:astro-ph.CO/1108.6206]. https://doi.org/10.1111/j.1365 -2966.2011.19727.x
work page internal anchor Pith review Pith/arXiv arXiv doi:10.1111/j.1365 2011
-
[52]
A unified picture of breaks and truncations in spiral galaxies from SDSS and S^{4}G imaging
Martín-Navarro, I.; Bakos, J.; Trujillo, I.; Knapen, J.H.; Athanassoula, E.; Bosma, A.; Comerón, S.; Elmegreen, B.G.; Erroz-Ferrer, S.; Gadotti, D.A.; et al. A unified picture of breaks and truncations in spiral galaxies from SDSS and S 4G imaging. MNRAS2012,427, 1102–1134, [arXiv:astro-ph.CO/1208.2893]. https: //doi.org/10.1111/j.1365-2966.2012.21929.x
work page internal anchor Pith review Pith/arXiv arXiv doi:10.1111/j.1365-2966.2012.21929.x 2012
-
[53]
Overview of the DESI Legacy Imaging Surveys
Dey, A.; Schlegel, D.J.; Lang, D.; Blum, R.; Burleigh, K.; Fan, X.; Findlay, J.R.; Finkbeiner, D.; Herrera, D.; Juneau, S.; et al. Overview of the DESI Legacy Imaging Surveys. AJ2019,157, 168, [arXiv:astro- ph.IM/1804.08657]. https://doi.org/10.3847/1538-3881/ab089d
work page internal anchor Pith review Pith/arXiv arXiv doi:10.3847/1538-3881/ab089d
-
[54]
Abdurro’uf.; Accetta, K.; Aerts, C.; Silva Aguirre, V .; Ahumada, R.; Ajgaonkar, N.; Filiz Ak, N.; Alam, S.; Allende Prieto, C.; Almeida, A.; et al. The Seventeenth Data Release of the Sloan Digital Sky Surveys: Com- plete Release of MaNGA, MaStar, and APOGEE-2 Data. ApJS2022,259, 35, [arXiv:astro-ph.GA/2112.02026]. https://doi.org/10.3847/1538-4365/ac4414
-
[55]
Surface photometry of edge-on spiral galaxies
van der Kruit, P .C.; Searle, L. Surface photometry of edge-on spiral galaxies. I - A model for the three- dimensional distribution of light in galactic disks. A&A1981,95, 105–115
-
[56]
Type-II surface brightness profiles in edge-on galaxies produced by flares
Borlaff, A.; Eliche-Moral, M.C.; Beckman, J.; Font, J. Type-II surface brightness profiles in edge-on galaxies produced by flares. A&A2016,591, L7, [arXiv:astro-ph.GA/1606.00448]. https://doi.org/10.1051/0004-636 1/201628868
work page internal anchor Pith review Pith/arXiv arXiv doi:10.1051/0004-636
-
[57]
de Grijs, R. The global structure of galactic discs. MNRAS1998,299, 595–610, [arXiv:astro-ph/astro- ph/9804337]. https://doi.org/10.1046/j.1365-8711.1998.01896.x
-
[58]
Flattening and truncation of stellar discs in edge-on spiral galaxies
Kregel, M.; van der Kruit, P .C.; de Grijs, R. Flattening and truncation of stellar discs in edge-on spiral galaxies. MNRAS2002,334, 646–668, [arXiv:astro-ph/astro-ph/0204154]. https://doi.org/10.1046/j.1365-8 711.2002.05556.x
work page internal anchor Pith review Pith/arXiv arXiv doi:10.1046/j.1365-8 2002
-
[59]
On the 3 dimensional structure of edge-on disk galaxies
Pohlen, M.; Zaroubi, S.; Peletier, R.F.; Dettmar, R.J. On the three-dimensional structure of edge-on disc galaxies. MNRAS2007,378, 594–616, [arXiv:astro-ph/astro-ph/0703768]. https://doi.org/10.1111/j.1365-2 966.2007.11790.x
work page internal anchor Pith review Pith/arXiv arXiv doi:10.1111/j.1365-2 2007
-
[60]
The Optical and Near-Infrared Properties of Galaxies: I. Luminosity and Stellar Mass Functions
Bell, E.F.; McIntosh, D.H.; Katz, N.; Weinberg, M.D. The Optical and Near-Infrared Properties of Galaxies. I. Luminosity and Stellar Mass Functions. ApJS2003,149, 289–312, [arXiv:astro-ph/astro-ph/0302543]. https://doi.org/10.1086/378847
work page internal anchor Pith review Pith/arXiv arXiv doi:10.1086/378847
-
[61]
Photometric stellar masses for galaxies in DESI Legacy Imaging Surveys
Ebrová, I.; Bílek, M.; Eliášek, J. Photometric stellar masses for galaxies in DESI Legacy Imaging Surveys. A&A2025,704, A232, [arXiv:astro-ph.GA/2510.02257]. https://doi.org/10.1051/0004-6361/202453448. 28 of 29
-
[62]
The edge-on Galaxies in the Pan-STARRS survey (EGIPS)
Makarov, D.; Savchenko, S.; Mosenkov, A.; Bizyaev, D.; Reshetnikov, V .; Antipova, A.; Tikhonenko, I.; Usachev, P .; Borisov, S.; Makarova, L.; et al. The edge-on Galaxies in the Pan-STARRS survey (EGIPS). MNRAS2022,511, 3063–3075, [arXiv:astro-ph.GA/2201.08888]. https://doi.org/10.1093/mnras/stac227
-
[63]
The Revised Flat Galaxy Catalogue
Karachentsev, I.D.; Karachentseva, V .E.; Kudrya, Y.N.; Sharina, M.E.; Parnovskij, S.L. The revised Flat Galaxy Catalogue.Bulletin of the Special Astrophysics Observatory1999,47, 5–185, [arXiv:astro-ph/astro-ph/0305566]. https://doi.org/10.48550/arXiv.astro-ph/0305566
work page internal anchor Pith review Pith/arXiv arXiv doi:10.48550/arxiv.astro-ph/0305566
-
[64]
Chambers, K.C.; Magnier, E.A.; Metcalfe, N.; Flewelling, H.A.; Huber, M.E.; Waters, C.Z.; Denneau, L.; Draper, P .W.; Farrow, D.; Finkbeiner, D.P .; et al. The Pan-STARRS1 Surveys.arXiv e-prints2016, p. arXiv:1612.05560, [arXiv:astro-ph.IM/1612.05560]. https://doi.org/10.48550/arXiv.1612.05560
work page internal anchor Pith review Pith/arXiv arXiv doi:10.48550/arxiv.1612.05560
-
[65]
The dust distribution in edge-on galaxies. Radiative transfer fits of V and K'-band images
Bianchi, S. The dust distribution in edge-on galaxies. Radiative transfer fits of V and K’-band images. A&A 2007,471, 765–773, [arXiv:astro-ph/0705.1471]. https://doi.org/10.1051/0004-6361:20077649
work page internal anchor Pith review Pith/arXiv arXiv doi:10.1051/0004-6361:20077649 2007
-
[66]
De Geyter, G.; Baes, M.; Camps, P .; Fritz, J.; De Looze, I.; Hughes, T.M.; Viaene, S.; Gentile, G. The distribution of interstellar dust in CALIFA edge-on galaxies via oligochromatic radiative transfer fitting. MNRAS2014, 441, 869–885, [arXiv:astro-ph.GA/1403.7527]. https://doi.org/10.1093/mnras/stu612
work page internal anchor Pith review Pith/arXiv arXiv doi:10.1093/mnras/stu612
-
[67]
Bertin, E.; Arnouts, S. SExtractor: Software for source extraction. A&AS1996,117, 393–404. https: //doi.org/10.1051/aas:1996164
-
[68]
New Features of SAOImage DS9
Joye, W.A.; Mandel, E. New Features of SAOImage DS9. In Proceedings of the Astronomical Data Analysis Software and Systems XII; Payne, H.E.; Jedrzejewski, R.I.; Hook, R.N., Eds., 2003, Vol. 295,Astronomical Society of the Pacific Conference Series, p. 489
2003
-
[69]
Gadotti, D.A.; Baes, M.; Falony, S. Radiative transfer in disc galaxies - IV . The effects of dust attenuation on bulge and disc structural parameters. MNRAS2010,403, 2053–2062, [arXiv:astro-ph.CO/1001.2303]. https://doi.org/10.1111/j.1365-2966.2010.16243.x
work page internal anchor Pith review Pith/arXiv arXiv doi:10.1111/j.1365-2966.2010.16243.x 2053
-
[70]
The effects of dust on the derived photometric parameters of disks and bulges in spiral galaxies
Pastrav, B.A.; Popescu, C.C.; Tuffs, R.J.; Sansom, A.E. The effects of dust on the derived photometric parameters of disks and bulges in spiral galaxies. A&A2013,553, A80, [arXiv:astro-ph.CO/1301.5602]. https://doi.org/10.1051/0004-6361/201220962
work page internal anchor Pith review Pith/arXiv arXiv doi:10.1051/0004-6361/201220962
-
[71]
The effects of dust on the photometric parameters of decomposed disks and bulges
Pastrav, B.A.; Popescu, C.C.; Tuffs, R.J.; Sansom, A.E. The effects of dust on the photometric parameters of decomposed disks and bulges. A&A2013,557, A137, [arXiv:astro-ph.CO/1308.0458]. https://doi.org/10.1 051/0004-6361/201322086
work page internal anchor Pith review Pith/arXiv arXiv
-
[72]
Savchenko, S.S.; Poliakov, D.M.; Mosenkov, A.V .; Smirnov, A.A.; Marchuk, A.A.; Il’in, V .B.; Gontcharov, G.A.; Seguine, J.; Baes, M. The problem of dust attenuation in photometric decomposition of edge-on galaxies and possible solutions. MNRAS2023,524, 4729–4745, [arXiv:astro-ph.GA/2309.06257]. https: //doi.org/10.1093/mnras/stad2189
-
[73]
The stellar disk thickness of LSB galaxies
Bizyaev, D.; Kajsin, S. The Stellar Disk Thickness of Low Surface Brightness Galaxies. ApJ2004,613, 886–897, [arXiv:astro-ph/astro-ph/0406498]. https://doi.org/10.1086/423229
work page internal anchor Pith review Pith/arXiv arXiv doi:10.1086/423229
-
[74]
Gadotti, D.A. Robust galaxy image decompositions with differential evolution optimization and the problem of classical bulges in and beyond the nearby Universe. MNRAS2026,545, staf2072, [arXiv:astro- ph.GA/2511.13823]. https://doi.org/10.1093/mnras/staf2072
-
[75]
Measuring the X-shaped structures in edge-on galaxies
Savchenko, S.S.; Sotnikova, N.Y.; Mosenkov, A.V .; Reshetnikov, V .P .; Bizyaev, D.V . Measuring the X- shaped structures in edge-on galaxies. MNRAS2017,471, 3261–3272, [arXiv:astro-ph.GA/1707.04700]. https://doi.org/10.1093/mnras/stx1802
work page internal anchor Pith review Pith/arXiv arXiv doi:10.1093/mnras/stx1802
-
[76]
Smirnov, A.A.; Savchenko, S.S. New X-shaped bulge photometric model as a tool for measuring B/PS bulges and their X-structures in photometric studies. MNRAS2020,499, 462–481, [arXiv:astro-ph.GA/2007.12121]. https://doi.org/10.1093/mnras/staa2892
-
[77]
Measuring Reddening with SDSS Stellar Spectra and Recalibrating SFD
Schlafly, E.F.; Finkbeiner, D.P . Measuring Reddening with Sloan Digital Sky Survey Stellar Spectra and Recalibrating SFD. ApJ2011,737, 103, [arXiv:astro-ph.GA/1012.4804]. https://doi.org/10.1088/0004-637X/ 737/2/103
work page internal anchor Pith review Pith/arXiv arXiv doi:10.1088/0004-637x/
-
[78]
Old stellar Galactic disc in near-plane regions according to 2MASS: scales, cut-off, flare and warp
López-Corredoira, M.; Cabrera-Lavers, A.; Garzón, F.; Hammersley, P .L. Old stellar Galactic disc in near-plane regions according to 2MASS: Scales, cut-off, flare and warp. A&A2002,394, 883–899, [arXiv:astro- ph/astro-ph/0208236]. https://doi.org/10.1051/0004-6361:20021175
work page internal anchor Pith review Pith/arXiv arXiv doi:10.1051/0004-6361:20021175
-
[79]
The shape of galaxy disks: how the scale height increases with galactocentric distance
de Grijs, R.; Peletier, R.F. The shape of galaxy disks: how the scale height increases with galactocentric distance. A&A1997,320, L21–L24, [arXiv:astro-ph/astro-ph/9702215]. https://doi.org/10.48550/arXiv. astro-ph/9702215
work page internal anchor Pith review Pith/arXiv arXiv doi:10.48550/arxiv
-
[80]
Origin of Radially Increasing Stellar Scaleheight in a Galactic Disk
Narayan, C.A.; Jog, C.J. Origin of radially increasing stellar scaleheight in a galactic disk. A&A2002, 390, L35–L38, [arXiv:astro-ph/astro-ph/0207453]. https://doi.org/10.1051/0004-6361:20020961. 29 of 29
work page internal anchor Pith review Pith/arXiv arXiv doi:10.1051/0004-6361:20020961
discussion (0)
Sign in with ORCID, Apple, or X to comment. Anyone can read and Pith papers without signing in.