REVIEW 2 major objections 6 minor 39 references
Signatures of photospheric convection throughout the solar atmosphere: the EVE Sun-as-a-star mHz continuum
T0 review · 2 major / 6 minor · reviewed 2026-07-11 · grok-4.5
Pith's one-line read Photospheric convection imprints a steep Doppler continuum through the solar atmosphere, with no Kolmogorov signature.
desk verdict Clean first full-disk EUV Doppler continuum above 10 mHz and a model-independent Kolmogorov null; height reading is secondary and already flagged. read the letter →
The pith
A machine-rendered reading of the paper's core claim, the machinery that carries it, and where it could break.
The reading
What carries the argument
Incoherent averaging of hundreds of daily three-hour Doppler time series (centroid wavelengths of Gaussian-fitted emission lines) yields high signal-to-noise power spectra whose continuum shape is described by generalized Harvey functions; band-limited integrals of those spectra then quantify the height-dependent attenuation of granulation-scale power.
What would settle it
A quantitative Sun-as-a-star synthesis that folds realistic contribution functions and optical-depth effects into the same line set should recover (or fail to recover) the observed systematic drop of 5 mHz Doppler power with formation temperature.
Extended reading notes
Core claim
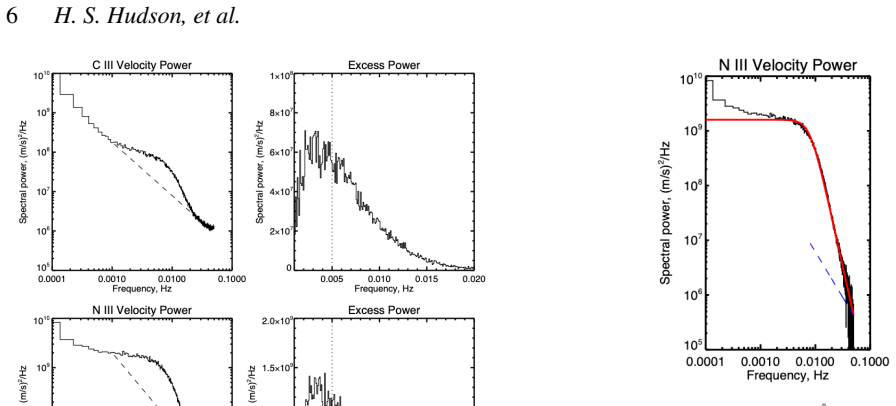
Incoherently summed Doppler power spectra of 26 EUV emission lines spanning 35–104 nm reveal a broadband continuum with two Harvey-like components, one of which continues as a steep power-law tail to the 50 mHz Nyquist frequency. Coronal lines show substantially less amplitude in the 5 mHz granulation component than chromospheric/transition-region lines. No line exhibits the flat Kolmogorov continuum (Doppler variance proportional to f^{-5/3}). The total non-thermal RMS velocities above 0.1 mHz are of order 15 km/s, consistent with classical coronal microturbulence estimates. These are the first clear Sun-as-a-star detections of EUV Doppler variability above ~10 mHz.
Load-bearing premise
The only height proxy used is the ionization-equilibrium formation temperature of each line; optical-depth weighting, active-region structure, and true contribution functions are left unmodeled.
Editorial analysis
A structured set of objections, weighed in public.
Referee Report
Summary. The paper presents Sun-as-a-star Doppler power spectra constructed from EVE/MEGS-B Level-2 Gaussian line centroids for 26 EUV lines (35–104 nm), using incoherent averages of ~200 clean 3-hour chunks from 2011. The spectra show a broadband continuum with Harvey-like form, a granulation-scale excess near 5 mHz, and a steep high-frequency tail extending to the 50 mHz Nyquist frequency without a white-noise floor in most lines. Coronal lines exhibit weaker power in the ~5 mHz component than chromospheric/transition-region lines (most clearly in O and Mg ionization sequences). No Kolmogorov f^{-5/3} continuum is detected; an upper limit W_turb/W_tot ≲ 10^{-5} is obtained by normalizing such a component to the n-band (45–50 mHz). Integrated non-thermal RMS velocities above 0.1 mHz are ~15 km/s, consistent with classical microturbulence widths. The work claims the first clear detection of Sun-as-a-star EUV Doppler variability above ~10 mHz.
Significance. If the continuum detection, Kolmogorov null, and ~15 km/s RMS hold, the paper supplies a new global observational constraint on how photospheric convective power is redistributed through the chromosphere, transition region, and low corona. The data reduction is transparent (public EVE Level-2, ephemeris-corrected centroids, empirical chunk scatter, Table 2 band powers), the Kolmogorov limit is falsifiable and model-light once the continuum shape is accepted, and the result is directly relevant to stellar EUV spectroscopy, non-thermal line widths, and wave/turbulence energy transport. The high-frequency reach (to 50 mHz) and multi-line temperature coverage are genuine strengths not available from TSI or photospheric Doppler alone.
major comments (2)
- [§2.6, Fig. 8, Abstract] §2.6 and Fig. 8: The Kolmogorov upper limit is obtained by normalizing an f^{-5/3} component to the n-band (45–50 mHz) after subtracting that band as white noise, yielding W_turb/W_tot ≲ 10^{-5}. The same section notes that high-frequency power generally has a solar origin (line-to-line differences) and that the spectra flatten near Nyquist, possibly from jitter or residual solar power. If the n-band still contains solar continuum, the normalization procedure and the quoted limit need explicit justification or a more conservative bound (e.g., using only the excess above the steepest observed Harvey tail). The abstract’s phrasing “flat continuum component with Doppler variance ⟨v^{2}⟩ ∝ f^{-5/3}” is also imprecise relative to the usual PSD ~ f^{-5/3} statement used in the body.
- [§2.4, §2.7, Fig. 10, Abstract, §4] §2.4, §2.7, Fig. 10, and Abstract/Conclusions: The statement that coronal lines have “substantially less Doppler amplitude in the 5 mHz Harvey component” is clear for the O and Mg sequences but does not hold cleanly across the full 26-line set (Fig. 10). The paper correctly flags the absence of quantitative contribution functions, optical-depth weighting, and active-region structure, yet the abstract and conclusions still present the temperature/height attenuation as a primary result. Given the G(T) high-temperature tails illustrated for the Ne/Mg pair (Fig. 13) and the acknowledged blend/active-region complications, this interpretation should be more carefully caveated as suggestive for selected sequences rather than established for the atmosphere as a whole.
minor comments (6)
- [Fig. 6] Fig. 6 caption: “Niii 91.1 nm” is a typographical error; the line is 99.1 nm / 991.51 Å elsewhere.
- [§2.4, Fig. 5] The paper states that direct multi-component Harvey fits are not performed (§2.4), yet shows one illustrative fit (Fig. 5) and repeatedly refers to “two Harvey-like components.” A short quantitative fit (or explicit statement that band integrals replace formal fits) would reduce ambiguity.
- [Table 1, Abstract, Table 2] Table 1 lists 25 lines in the text but the abstract and Table 2 refer to 26; reconcile the count and ensure Fe XVI / Si XII entries are consistently included or excluded.
- [Eq. (1), §2.6] Equation (1) uses both A f^{-n} and the Harvey term with index α; the text later quotes α ≈ 4–4.5 without reporting formal fit uncertainties or the role of the free power-law term A. Clarify which parameters are fixed versus free in the illustrative fits.
- [Figs. 5–9, Table 2] Several figure panels and the appendix table would benefit from explicit units on the power-spectral density axes (already stated as (m/s)^2/Hz in the text) and a brief note on whether the FFT is one-sided or two-sided.
- [Abstract, §2] Minor wording: “incoherently summed” is used for power-spectrum averaging; “incoherent average of periodograms” would be more standard and avoid confusion with coherent stacking of time series.
Circularity Check
No circularity: purely observational power spectra from EVE centroids compared to external Harvey/Kolmogorov forms
full rationale
The paper's load-bearing claims (detection of the mHz Doppler continuum above ~10 mHz, absence of a Kolmogorov f^{-5/3} component, and band-integrated RMS velocities of order 15 km/s) are obtained by direct processing of public EVE Level-2 spectra: single-Gaussian centroid fits on 10 s samples, residual timeseries after ephemeris correction, incoherent averaging of ~200 clean 3-hour chunks, and numerical integration of the resulting power spectra over fixed bands (Table 2, Figs. 5–9). The Harvey form (Eq. 1) is used only as a descriptive template taken from the literature (Harvey 1985); the authors explicitly state they do not perform formal multi-parameter fits. The Kolmogorov upper limit is obtained by normalizing an external f^{-5/3} spectrum to the observed n-band floor after white-noise subtraction (Fig. 8), yielding a model-independent ratio W_turb/W_tot ≲ 10^{-5}. The ~15 km/s figure is simply the square root of the measured integrated power (>0.1 mHz) under an isotropy assumption; consistency with prior microturbulence numbers is a post-hoc comparison, not an input. No parameter is fitted and then re-presented as a prediction, no uniqueness theorem is imported, and no self-citation carries the central result. The analysis is therefore self-contained against external benchmarks.
Assumptions & free parameters
free parameters (3)
- Harvey high-frequency index α =
≈4–4.5
- Frequency band edges (0.1–1, 1–5, 5–20, 45–50 mHz) =
fixed by authors
- n-band white-noise floor subtraction =
measured per line
assumptions (4)
- domain assumption CHIANTI ionization-equilibrium peak temperatures are adequate proxies for relative formation height
- domain assumption Single-Gaussian plus quadratic background yields unbiased line centroids even for mildly blended lines
- domain assumption High-frequency continuum power is of solar origin because its amplitude varies systematically with formation temperature
- domain assumption The generalized Harvey function (flat + power-law roll-over) correctly describes convective continuum shapes
Cite this review
Pith. "Pith review of Signatures of photospheric convection throughout the solar atmosphere: the EVE Sun-as-a-star mHz continuum." pith.science (2026). https://pith.science/paper/ZXKZG5B2
@misc{pith2026260705108,
  author       = {Pith},
  title        = {Pith review of: Signatures of photospheric convection throughout the solar atmosphere: the EVE Sun-as-a-star mHz continuum},
  year         = {2026},
  howpublished = {\url{https://pith.science/paper/ZXKZG5B2}},
  note         = {Machine review of arXiv:2607.05108}
}
read the original abstract
Convectively driven motions in the solar photosphere can generate broadband Doppler variability across the chromosphere, transition region and corona. Here we investigate this variability using "Sun-as-a-Star" observations from the Extreme Ultraviolet Variability Experiment (EVE) aboard the Solar Dynamics Observatory, constructing high signal-to-noise Doppler power spectra from incoherently summed 3-hour sequences of the centroid wavelengths of emission lines that span wavelengths 35-104 nm. The spectra reveal a broad power-spectral continuum with two Harvey-like components, one of which extends to the Nyquist frequency at 50 mHz with a steep power-law tail. Lines formed in the corona, as compared with those of the chromosphere/transition region, have substantially less Doppler amplitude in the 5 mHz Harvey component associated with granulation-scale convection. Based on the observed continuum, there is no evidence (in any of the 26 lines studied) for Kolmogorov turbulence, which predicts a flat continuum component with Doppler variance <v^2> ~ f^{-5/3) as a function of frequency f. The total inferred non-thermal RMS velocities (>0.1 mHz) are of order 15 km/s, consistent with previous coronal "microturbulence" estimates from non-thermal line widths. These observations provide the first clear detection of Sun-as-a-star EUV Doppler variability above about 10 mHz and demonstrate the potential of full-disk EUV spectroscopy to probe turbulent energy transport throughout the solar atmosphere.
Figures


Figures from the paper (8 more)




Reference graph
Works this paper leans on
-
[1]
The Frequency Content of the VIRGO/SoHO Light Curves: Implications for Planetary Transit Detection from Space. Scientific Frontiers in Research on Extrasolar Planets , year = 2003, editor =. doi:10.48550/arXiv.astro-ph/0208529 , archivePrefix =. astro-ph/0208529 , primaryClass =
work page Pith review arXiv doi:10.48550/arxiv.astro-ph/0208529 2003
-
[2]
Characterising stellar micro-variability for planetary transit searches. , eprint =. doi:10.1051/0004-6361:20034039 , adsurl =
-
[3]
The Solar Dynamics Observatory (SDO). , keywords =. doi:10.1007/s11207-011-9841-3 , adsurl =
-
[4]
Extreme Ultraviolet Variability Experiment (EVE) on the Solar Dynamics Observatory (SDO): Overview of Science Objectives, Instrument Design, Data Products, and Model Developments. , keywords =. doi:10.1007/s11207-009-9487-6 , adsurl =
-
[5]
First detection of acoustic-like flux in the middle solar corona. , keywords =. doi:10.1051/0004-6361/202554034 , archivePrefix =. 2507.13487 , primaryClass =
-
[6]
Biometrics , year = 1950, month = jan, volume =
Periodogram Analysis and Continuous Spectra. Biometrics , year = 1950, month = jan, volume =. doi:10.1093/biomet/37.1-2.1 , adsurl =
-
[7]
A Global Survey of EUV Coronal Power Spectra. , keywords =. doi:10.1007/s11207-019-1399-5 , adsurl =
-
[8]
A guide to the solar corona
Show all 39 references
-
[9]
Journal of Geophysical Research (Space Physics) , keywords =
Flux tube texture of the solar wind: Strands of the magnetic carpet at 1 AU?. Journal of Geophysical Research (Space Physics) , keywords =. doi:10.1029/2007JA012684 , adsurl =
- [10]
- [11]
-
[12]
, year = 1973, month = sep, volume =
Vertical Phase Variation and Mechanical Flux in the Solar 5-MINUTE Oscillation. , year = 1973, month = sep, volume =. doi:10.1086/181306 , adsurl =
1973 doi
-
[13]
, keywords =
The dynamical properties of the solar corona from intensities and line widths of EUV forbidden lines of Si VIII, Fe XI, and Fe XII. , keywords =. doi:10.1086/156811 , adsurl =
-
[14]
, archivePrefix = "arXiv", eprint =
Dynamics of the Solar Magnetic Bright Points Derived from Their Horizontal Motions. , archivePrefix = "arXiv", eprint =. doi:10.1088/0004-637X/752/1/48 , adsurl =
-
[15]
, keywords =
Solar structure from global studies of the 5-minute oscillation. , keywords =. doi:10.1038/282591a0 , adsurl =
-
[16]
, keywords =
Spectral diagnostics with the SDO EVE flare lines. , keywords =. doi:10.1051/0004-6361/201220988 , adsurl =
-
[17]
Living Reviews in Solar Physics , archivePrefix = "arXiv", eprint =
Solar UV and X-ray spectral diagnostics. Living Reviews in Solar Physics , archivePrefix = "arXiv", eprint =. doi:10.1007/s41116-018-0015-3 , adsurl =
-
[18]
, keywords =
CHIANTI - an atomic database for emission lines. , keywords =. doi:10.1051/aas:1997368 , adsurl =
- [19]
-
[20]
SolAster: 'Sun-as-a-star' radial velocity variations
-
[21]
, keywords =
Full-Disk Observations of Solar Oscillations from the Geographic South-Pole - Latest Results. , keywords =. doi:10.1007/BF00145545 , adsurl =
-
[22]
, keywords =
The Coronal Diagnostic Spectrometer for the Solar and Heliospheric Observatory. , keywords =. doi:10.1007/BF00733431 , adsurl =
-
[23]
Future Missions in Solar, Heliospheric & Space Plasma Physics , year = 1985, editor =
High-Resolution Helioseismology. Future Missions in Solar, Heliospheric & Space Plasma Physics , year = 1985, editor =
1985
-
[24]
GONG 1992
Chromospheric Oscillations and the Background Spectrum. GONG 1992. Seismic Investigation of the Sun and Stars , year = 1993, series =
1992
-
[25]
, keywords =
Evidence of 5 minute Oscillations from Parker Solar Probe. , keywords =. doi:10.3847/2041-8213/ae43ec , archivePrefix =. 2511.10906 , primaryClass =
-
[26]
, keywords =
The EVE Doppler Sensitivity and Flare Observations. , keywords =. doi:10.1007/s11207-011-9862-y , adsurl =
-
[27]
, archivePrefix = "arXiv", eprint =
Temporal variations in the acoustic signal from faculae. , archivePrefix = "arXiv", eprint =. doi:10.1111/j.1365-2966.2012.20542.x , adsurl =
2012 doi
- [28]
- [29]
- [30]
- [31]
- [32]
-
[33]
, keywords =
Propagating Kink Waves in Chromospheric Jetlike Structures and Coronal Plumelets. , keywords =. doi:10.3847/1538-4357/ae5792 , archivePrefix =. 2603.24892 , primaryClass =
-
[34]
, year = 2012, month = jan, volume = 275, pages =
The Helioseismic and Magnetic Imager (HMI) Investigation for the Solar Dynamics Observatory (SDO). , year = 2012, month = jan, volume = 275, pages =. doi:10.1007/s11207-011-9834-2 , adsurl =
2012 doi
-
[35]
Toward a Theory of Interstellar Turbulence. I. Weak Alfvenic Turbulence. , keywords =. doi:10.1086/174600 , adsurl =
-
[36]
Science , year = 2007, month = aug, volume = 317, pages =
Alfv \'e n Waves in the Solar Corona. Science , year = 2007, month = aug, volume = 317, pages =. doi:10.1126/science.1143304 , adsurl =
2007 doi
-
[37]
, keywords =
Frequencies, amplitudes and linewidths of solar oscillations from total irradiance observations. , keywords =. 1983. doi:10.1038/305589a0 , adsurl =
1983 doi
- [38]
- [39]
Reviewed July 11, 2026 · model on record in the stance chip above.
Discussion (0). Sign in to comment.