Characterizing an inverse Compton X-ray source and determining its electron beam parameters using a genetic algorithm
Reviewed by Pith T0 review T1 audit T2 compute T3 formal T4 kernel 2026-07-08 12:39 UTCglm-5.2pith:7DPUOHJJrecord.jsonopen to challenge →
The pith
Electron beam parameters extracted from a single X-ray spectrum
A machine-rendered reading of the paper's core claim, the machinery that carries it, and where it could break.
Core claim
The central discovery is that the shape of a single inverse Compton X-ray spectrum encodes enough information to recover four electron beam parameters simultaneously—horizontal and vertical emittances, mean energy, and energy spread—provided the laser and X-ray beam parameters are independently characterized. This becomes practical through the STARS analytical model, which collapses the computation of Compton scattering spectra from a multidimensional Monte Carlo integration into a three-dimensional integral by exploiting Gaussian beam assumptions and analytic integration over electron phase space. The reduction in computation time from weeks to hours is what makes the genetic-algorithm fit—
What carries the argument
STARS (Statistical Treatment of Advanced Radiation Spectra): an analytical model for inverse Compton scattering spectra that analytically integrates over electron beam emittances and energy spread, reducing spectral computation to a 3D integration (2D aperture + 1D scattering angle). Coupled to a genetic algorithm that optimizes four electron beam parameters (horizontal emittance, vertical emittance, mean energy, energy spread) by minimizing chi-squared between simulated and measured spectra. The iterative procedure alternates between the genetic-algorithm emittance fit and a focus-size update derived from the projected X-ray source size measured by knife-edge scan.
If this is right
- Real-time, non-invasive emittance monitoring becomes feasible at compact inverse Compton sources where physical space for conventional diagnostics is scarce, if the genetic algorithm is replaced by a faster gradient-based optimizer as the authors suggest.
- The method could extend to synchrotron storage rings as a permanent emittance diagnostic using a low-power continuous-wave laser, since only a spectrum measurement is needed and no intercepting diagnostic hardware is required.
- The factor-of-2.9 discrepancy between simulated and measured X-ray flux, if it persists after diagnostic recalibration, may point to unmodeled physics such as timing jitter between laser and electron beams or deviations from the assumed Gaussian beam profiles.
- The STARS model's speed could enable automated feedback loops for beam tuning during ICS operation, where operators adjust magnet settings or injection parameters based on real-time emittance and energy-spread readouts.
Where Pith is reading between the lines
- If the single global minimum in emittance space that the authors identified holds generally for other ICS configurations, the genetic algorithm could be replaced by deterministic optimization for routine monitoring, dramatically reducing the computational footprint and latency of the diagnostic.
- The factor-of-2.9 flux discrepancy suggests that the absolute flux prediction depends sensitively on parameters the model does not fully capture (charge calibration, timing overlap, bunch length). If flux were brought into the fit, it could serve as an additional constraint—but only after these systematic uncertainties are resolved.
- The observation that the emittance minimum is shallow toward higher emittances and steep toward lower ones implies that the method is more reliable for detecting emittance degradation than for precisely distinguishing small differences at the high-emittance end, which would affect its utility as a precision monitor.
Load-bearing premise
The iterative procedure assumes the electron beam focus size can be independently and accurately determined from a knife-edge measurement of the projected X-ray source size while holding the divergence constant, effectively decoupling the focus-size estimate from the emittance fit. If the knife-edge measurement carries systematic error or the Gaussian beam profile assumption breaks down, the retrieved emittance values would shift, because both the focus size and the emittance
What would settle it
If the electron beam focus size cannot be reliably decoupled from the emittance in the way the iterative procedure assumes—for instance, if the knife-edge X-ray source size measurement carries systematic errors of more than a few percent, or if the electron beam deviates significantly from a Gaussian phase-space distribution—then the emittance values returned by the genetic algorithm would be correspondingly biased, and the claimed precision of the retrieval would not hold.
Figures



read the original abstract
Inverse Compton X-ray sources are laboratory-scale devices providing quasi-monochromatic synchrotron radiation which is generated by laser photons Compton-scattering off highly relativistic electrons. Since the shape and width of the X-ray spectrum are determined by the properties of the colliding beams, these must be carefully optimised. However, device compactness limits the space for diagnostics, rendering a complete characterisation challenging, especially if an electron storage ring is combined with a laser enhancement cavity. Here, a framework for laser, electron and X-ray beam parameter determination is proposed to address this issue. First, methods for determining the laser- and X-ray parameters are presented. Knowing these, electron beam parameters are retrieved from the shape of the X-ray spectrum. To this end, an analytical physical model enabling a rapid calculation of inverse Compton scattering spectra is developed and combined with a genetic algorithm. This strategy's effectiveness is demonstrated by applying the concept at the Munich Compact Light Source, a storage ring-based inverse Compton X-ray source facility. Since the analytical model is computationally very inexpensive, the proposed framework could enable real-time monitoring of inverse Compton X-ray sources or be used as a non-invasive diagnostic based on a single spectrum for the electron beam emittance of storage rings or accelerators.
Editorial analysis
A structured set of objections, weighed in public.
Referee Report
Summary. This manuscript presents a framework for characterizing inverse Compton X-ray sources (ICS), combining a fast analytical spectral model (STARS) with a genetic algorithm to retrieve electron beam parameters (horizontal/vertical emittances, mean energy, energy spread) from a single measured X-ray spectrum. The STARS model is validated against ICCS3D and CAIN (Appendix A). The framework is applied at the Munich Compact Light Source (MuCLS), yielding best-fit parameters εx = 9.0 mm·mrad, εy = 10.8 mm·mrad, E = 37.59 MeV, σE/E = 0.31%. The paper also presents laser and X-ray beam characterization methods and discusses the potential for real-time, non-invasive emittance monitoring.
Significance. The development of a computationally inexpensive analytical model for ICS spectra, validated against two independent codes (ICCS3D, CAIN), is a genuine technical contribution that enables iterative fitting approaches that were previously impractical. The systematic study of genetic algorithm convergence (Figures 5–6) and the demonstration of a complete characterization pipeline at a working ICS facility are valuable. The potential for non-invasive emittance monitoring is a compelling application. However, the significance of the retrieved parameter values is diminished by the absence of quantitative uncertainties and the unexplained flux discrepancy.
major comments (3)
- Section VII.C, Figure 5a: The χ² landscape in (εx, εy) space exhibits a hyperbolic valley, and the 1% contour spans approximately ±2 mm·mrad around the best fit (9.0, 10.8). The paper does not provide formal error bars or confidence intervals on any of the retrieved electron beam parameters. Since the central claim is that individual εx and εy can be retrieved from the spectral shape, quantitative uncertainty estimates are load-bearing. The contour map in Figure 5a provides qualitative information, but the paper should translate this into explicit confidence intervals (e.g., via the χ² threshold method or a bootstrap analysis) for all four fitted parameters.
- Section VIII, flux discrepancy: The simulated flux (2.13×10¹⁰ ph/s) exceeds the measured flux (0.73×10¹⁰ ph/s) by a factor of 2.9. While the authors acknowledge this and discuss possible causes (charge calibration, timing jitter, laser power calibration), the discrepancy raises a concern about the self-consistency of the input parameters used in the spectral fit. Specifically, if the stored laser power or electron charge is significantly overestimated, could this systematically bias the beam-size estimate from the knife-edge measurement (step 3c) or the spectral normalization, thereby shifting the retrieved emittances? The paper should clarify whether the flux discrepancy affects only the absolute normalization (which STARS handles separately from spectral shape) or whether it also impacts the shape-based emittance retrieval.
- Section III, steps 3c–3f: The iterative procedure couples the electron beam focus size determination (from the projected X-ray source size) to the emittance fit (which updates the divergence and hence the projected source size). The convergence is demonstrated in Figures 5b–c over 14 iterations, which is encouraging. However, no systematic error on the knife-edge measurement (42.6 µm h, 46.3 µm v) is reported, and the sensitivity of the final emittance values to this input is not quantified. A simple sensitivity analysis—e.g., varying the knife-edge source sizes by a plausible systematic error (±5–10%) and re-running the fit—would establish how strongly the retrieved emittances depend on this external input.
minor comments (8)
- Section II: The acronym 'STARS' is introduced in Section II.D but used earlier in Section II.A (Figure 1 caption). Please introduce the acronym at first use.
- Equation (3): 'Raperture' is used before its full definition is given. Consider reordering for clarity.
- Section VI.A: The knife-edge measurement reports source sizes of 42.6 µm and 46.3 µm but no measurement uncertainty. Please state the estimated precision of this measurement.
- Table I: The electron beam charge is listed as 240 pC in the table but 250 pC in Section IV.A. Please reconcile.
- Figure 4: The colorbar label in panel (a) is not fully described (what quantity is color-coded and in what units). The caption mentions mean electron energy but the colorbar itself lacks a label.
- Section VII.C: The χ² definition in Eq. (11) is a mean squared error, not a reduced χ² in the standard statistical sense (no division by variance). This should be clarified to avoid confusion, especially since the value 5.6×10⁻³ is reported without units or context for what constitutes a 'good' fit.
- Appendix C: The interaction angle is estimated as 6–7 mrad. The paper states this justifies assumption (iv) (head-on collision). It would help to quantify the spectral effect of a 6 mrad crossing angle to support this claim.
- Reference [22] is cited as 'In preparation (2026)' for the detailed derivation of the mathematical formalism. Since key aspects of the model are deferred to this reference, the manuscript's self-containedness is somewhat limited. If possible, a more complete derivation should be included, at least in supplementary material.
Simulated Author's Rebuttal
We thank the referee for a careful and constructive report. The referee correctly identifies the core technical contributions of the manuscript—the STARS analytical model, its validation against ICCS3D and CAIN, the genetic algorithm convergence study, and the demonstration at MuCLS—and raises three major comments concerning: (1) the absence of formal confidence intervals on retrieved parameters, (2) whether the factor-of-2.9 flux discrepancy could bias the shape-based emittance retrieval, and (3) the lack of a sensitivity analysis for the knife-edge source size input. We agree that all three points warrant attention and will revise the manuscript accordingly. On the flux discrepancy (Comment 2), we can clarify on the basis of the existing manuscript content that the spectral shape fit is decoupled from absolute normalization; on the other two points, we will add new quantitative analysis. No standing objections remain.
read point-by-point responses
-
Referee: Section VII.C, Figure 5a: The chi-squared landscape exhibits a hyperbolic valley, and the 1% contour spans approximately +/-2 mm mrad around the best fit. The paper does not provide formal error bars or confidence intervals on any of the retrieved electron beam parameters. Quantitative uncertainty estimates are load-bearing. The contour map provides qualitative information but should be translated into explicit confidence intervals for all four fitted parameters.
Authors: We agree with the referee that formal confidence intervals should accompany the retrieved parameter values. The chi-squared landscape in Figure 5a already contains the information needed to construct such intervals for the emittances; we will extract explicit confidence regions using the standard chi-squared threshold method (i.e., Delta-chi-squared = 2.30, 4.61, 9.21 for 1-sigma, 90%, and 99% confidence levels for two parameters, and the corresponding one-parameter thresholds for marginal intervals). For the mean electron energy and energy spread, we will report confidence intervals derived from the one-dimensional chi-squared projections already shown in Figure 4 (panels d, e, g, h). We will add a new subsection or paragraph in Section VII.C presenting these quantitative uncertainty estimates for all four fitted parameters, and we will update the abstract and Table I to include them. We note that the hyperbolic valley structure means the individual uncertainties on epsilon_x and epsilon_y are larger than the uncertainty on any linear combination along the valley floor; we will make this explicit. revision: yes
-
Referee: Section VIII, flux discrepancy: Simulated flux (2.13e10 ph/s) exceeds measured flux (0.73e10 ph/s) by a factor of 2.9. If stored laser power or electron charge is significantly overestimated, could this systematically bias the beam-size estimate from the knife-edge measurement (step 3c) or the spectral normalization, thereby shifting the retrieved emittances? The paper should clarify whether the flux discrepancy affects only the absolute normalization or also the shape-based emittance retrieval.
Authors: We thank the referee for raising this important point and will add explicit clarification to the manuscript. The flux discrepancy affects only the absolute normalization of the spectrum, not the shape-based emittance retrieval. The reasons are as follows: (1) The genetic algorithm fit minimizes the chi-squared between the measured and simulated spectral shapes (Eq. 11), where both spectra are normalized. The absolute flux does not enter the chi-squared objective function. (2) The knife-edge measurement (step 3c) determines the projected X-ray source size from the spatial profile of the X-ray beam, which is independent of the absolute flux calibration. The electron beam size is inferred from matching the projected source size (a convolution of electron and laser beam sizes) to the measured X-ray spot size; this depends on the spatial intensity distribution, not on the total photon count. (3) The laser power and electron charge enter the STARS calculation only through the overall normalization factor N_tot (Section II.C), which scales the spectral density uniformly across all energies. An overestimate of N_tot would inflate the predicted absolute flux but would not alter the spectral shape that determines the emittance, energy, and energy spread. (4) The energy-dependent detector absorption function (Section VI.B) is applied as a multiplicative correction to the simulated spectrum before comparison; it is determined from known material properties and detector geometry, not from the absolute flux. We will add a paragraph in Section VIII making these points explicit, so that the reader can verify that the flux discrepancy and the shape-based parameter retrieval are decoupled. revision: yes
-
Referee: Section III, steps 3c-3f: No systematic error on the knife-edge measurement (42.6 um h, 46.3 um v) is reported, and the sensitivity of the final emittance values to this input is not quantified. A simple sensitivity analysis—varying the knife-edge source sizes by a plausible systematic error (+/-5-10%) and re-running the fit—would establish how strongly the retrieved emittances depend on this external input.
Authors: We agree that a sensitivity analysis with respect to the knife-edge source size is a valuable addition and we will perform it. We will vary the horizontal and vertical X-ray source sizes by +/-10% (i.e., 42.6 +/- 4.3 um and 46.3 +/- 4.6 um) and re-run the iterative genetic algorithm fit for each variation. The resulting spread in the retrieved emittances, mean energy, and energy spread will be reported. Based on the physics of the model, we expect the sensitivity to be moderate: the electron beam size enters the spectral calculation through the effective source size sigma_s (Eq. 1) and the reduction factor R_aperture (Eq. 3), which affect the spectral shape primarily through the low-energy fall-off. A 10% change in the X-ray source size translates to a smaller fractional change in the electron beam size (because the X-ray source size is a convolution of electron and laser beam sizes, and the laser beam size is comparable), and the emittance enters through the divergence sigma_theta = sqrt(epsilon / beta), so the chain of dependencies partially buffers the emittance result. We will report the quantitative results of this analysis in a revised Section VII.C or VIII, and we will also state the estimated systematic error on the knife-edge measurement itself (arising from point-spread function deconvolution, fit uncertainty, and camera calibration, which we estimate at approximately 5-10%). revision: yes
Circularity Check
No significant circularity found; derivation is self-contained and externally validated.
full rationale
The paper's central derivation chain proceeds from first-principles Compton/Thomson scattering kinematics (Eqs. 1–10) to a fast analytical model (STARS), which is then used in a genetic algorithm to fit electron beam parameters to a measured X-ray spectrum. The STARS model is validated against two independent codes—ICCS3D (prior work by overlapping authors) and CAIN (by Chen et al., external authors)—in Appendix A, with all three codes producing identical spectra and fluxes. The electron beam parameter retrieval is a standard model-to-data fit: the genetic algorithm minimizes χ² between simulated and measured spectra over four free parameters (εx, εy, mean energy, energy spread). The iterative coupling between beam-size determination (step 3c, from the knife-edge X-ray source size measurement) and emittance fitting (step 3d, from spectral shape) uses two distinct experimental data streams—projected source size and spectral distribution—and Appendix B explicitly demonstrates that beam size and emittance have distinguishable effects on the spectrum (Figure 8a vs. 8b), so the iteration is solving a coupled system rather than defining one quantity in terms of itself. The only self-citation of note is reference [22], an in-preparation paper by overlapping authors that will contain the full mathematical derivation of the STARS formalism. However, the key equations (1–10) are presented in the paper itself, and the model's correctness is independently checked against CAIN. This self-citation is therefore not load-bearing for the circularity question. No step in the derivation chain reduces to its own inputs by construction. The factor-of-2.9 flux discrepancy between STARS prediction and measurement, which the paper openly acknowledges and discusses, further confirms the model is not tautologically reproducing the data. Score 1 reflects the minor in-preparation self-citation for the full derivation, with no impact on the central claims. No circular steps identified. No circular steps identified. No circular steps identified. No circular steps identified. No circular steps identified. No circular steps identified. No circular steps identified. No circular steps identified. No circular steps identified. No circular steps identified. No circular steps identified. No circular steps identified. No circular steps identified. No circular steps identified. No circular steps identified. No circular steps identified. No circular steps identified. No circular steps identified
Axiom & Free-Parameter Ledger
free parameters (6)
- Mean electron energy =
37.59 MeV
- Electron energy spread =
0.31%
- Horizontal normalized emittance εx =
9.0 mm mrad
- Vertical normalized emittance εy =
10.8 mm mrad
- Electron beam horizontal spot size =
42.3 µm
- Electron beam vertical spot size =
50.6 µm
axioms (6)
- domain assumption Gaussian spatial and energy distribution of the laser beam
- domain assumption Gaussian phase space distribution of the electron beam
- domain assumption Emittance ellipse aligned with coordinate system (αx = αy = 0)
- domain assumption Head-on collision of laser and electron beam
- domain assumption Aperture centred on axis
- standard math Thomson limit (no recoil correction beyond Klein-Nishina in rest frame)
Reference graph
Works this paper leans on
-
[1]
(b) Determination of the interaction laser’s pulse length
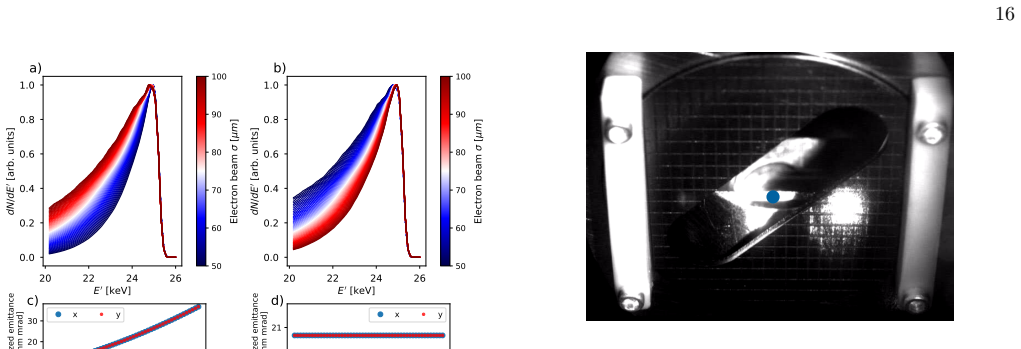
Characterisation of the interaction laser (a) Determination of the interaction angle by measuring the laser beam orbit tilt with re- spect to the electron beam orbit. (b) Determination of the interaction laser’s pulse length. In our case, an autocorrelator is em- ployed for this purpose, cf. [1, Chapter 7.2.2]. (c) Determination of the laser focal spot si...
-
[2]
(b) Determination of the transverse X-ray sources size from a knife-edge measurement [27]
Characterisation of the X-ray beam (a) Measurement of the X-ray spectrum with a silicon drift detector. (b) Determination of the transverse X-ray sources size from a knife-edge measurement [27]. (c) Retrieval of the total X-ray photon flux with a calibrated CCD camera [27]. The cited literature provides more details on the men- tioned procedures. Once the...
-
[3]
Characterisation of the electron beam Inferring the electron beam parameters requires an iterative procedure. First, the start parameters are estimated. (a) Determine the electron beam pulse length. In our case, this was done by the manufacturer of our ICS, cf. [28]. (b) Calculate an initial guess for the electron 7 beam divergence based on the nominal sy...
work page 2048
-
[4]
and Alternate PISA (APISA) from Cornell Univer- sity [40]. The codes are changed to enable efficient job execution and management on various (parallel) com- putational platforms, as well as to easily plug in differ- ent “function evaluators”—simulation software programs which carry out numerical simulations. In this study, that isSTARS. For a detailed and...
-
[5]
It is accounted for by computing the 14 brilliance reduction factorR hg, as outlined by Furman et al
Reduction in brilliance due to the hourglass effect The three-dimensional focus geometry results in a geo- metric reduction of the scattering rates, called the hour- glass effect [42]. It is accounted for by computing the 14 brilliance reduction factorR hg, as outlined by Furman et al. [42], for the MuCLS parameters. The reduction is less than 6.4 %
-
[6]
Since the opening angle is asymmetric, cf
Expected X-ray flux The X-ray flux is measured behind the MuCLS’s exit window whileSTARSsimulates MuCLS’s flux at the in- teraction point by integrating the spectro-angular flux across the opening angle of the aperture and the total spectral range. Since the opening angle is asymmetric, cf. [43], a circular aperture with the mean opening an- gle of both d...
-
[7]
The full divergence angle of the X- ray beam is∼4.5 mrad
The back-thinned area of the mirror forms the X- ray aperture. The full divergence angle of the X- ray beam is∼4.5 mrad. Hence, the half-angle is ∼2.25 mrad. Mirror M4 is located at a distance of∼1.25 m from the interaction point. Accord- ingly, the radius of the back-thinned area is about 2.9 mm. The laser waist on M4 is∼3 mm as well. Accordingly, the la...
-
[8]
It is positioned at a dis- tance of 1 m from the interaction point
A screen with a mm-grid exists to monitor the laser beam position after M4. It is positioned at a dis- tance of 1 m from the interaction point. The centre of the laser beam is at about 6 mm from the centre, cf. Figure 9. This would result in a collision angle of about 6 mrad, or 0.34 ◦. In conclusion, the interaction angle is about 6 mrad to 7 mrad. Since...
-
[9]
B. S. G¨ unther,Storage Ring-Based Inverse Compton X- ray Sources: Cavity Design, Beamline Development and X-ray Applications(Springer International Publishing,
-
[10]
J. Melcher, M. Dierolf, B. G¨ unther, K. Achter- hold, D. Pfeiffer, and F. Pfeiffer, High-energy x- ray diffraction experiment employing a compact syn- chrotron x-ray source based on inverse compton scat- tering, Zeitschrift f¨ ur Medizinische Physik (2024), doi:10.1016/j.zemedi.2024.03.003
-
[11]
Graves, The CXFEL project at Arizona State Univer- sity, 67th ICFA Adv
W. Graves, The CXFEL project at Arizona State Univer- sity, 67th ICFA Adv. Beam Dyn. Workshop Future Light Sources , JACoW PublishingFLS2023, TU1C4 (2023)
work page 2023
-
[12]
I. Drebot, A. Bacci, A. Bosotti, F. Broggi, F. Canella, P. Cardarelli, S. Cialdi, L. Faillace, G. Galzerano, M. Gambaccini, D. Giannotti, D. Giove, G. Mettivier, P. Michelato, L. Monaco, R. Paparella, G. Patern´ o, V. Petrillo, F. Prelz, M. Rossetti Conti, A. R. Rossi, P. Russo, A. Sarno, E. Suerra, A. Taibi, and L. Serafini, BriXs Ultra High Flux Inverse...
work page 2019
-
[13]
A. Bacci, D. Palmer, L. Serafini, V. Torri, V. Petrillo, P. Tomassini, E. Puppin, D. Alesini, M. Anania, M. Bellaveglia, F. Bisesto, G. Di Pirro, A. Esposito, M. Ferrario, A. Gallo, G. Gatti, A. Ghigo, B. Spataro, C. Vaccarezza, F. Villa, A. Cianchi, R. Agostino, G. Borgese, M. Ghedini, F. Martire, C. Pace, T. Lev- ato, G. Dauria, A. Fabris, and M. Marazz...
work page 2014
-
[14]
A. Bacci, I. Drebot, L. Serafini, V. Torri, V. Petrillo, M. R. Conti, E. Puppin, D. Alesini, M. Bellaveglia, F. Bisesto, B. Buonomo, G. Di Pirro, A. Esposito, F. Iungo, J. J. Beltrano, G. Borgese, G. Di Raddo, A. Gallo, A. Ghigo, L. Pellegrino, A. Stella, C. Vac- carezza, A. Cianchi, R. G. Agostino, R. Barberi, M. Ghe- dini, F. Martire, C. Pace, G. Dauria...
work page 2016
-
[15]
M. Jacquet, P. Alexandre, M. Alkaldi, and et al., First production of x-rays at the thomx high-intensity compton source, Eur. Phys. J. Plus139, 459 (2024)
work page 2024
-
[16]
Z. Chi, Y. Du, L. Yan, D. Wang, and H. Zhang, Ex- perimental feasibility of dual-energy computed tomogra- phy based on the Thomson scattering X-ray source re- search papers, Journal of Synchrotron Radiation25, 1797 (2018)
work page 2018
-
[17]
C. P. Barty, J. M. Algots, J. Amador, Alexander, and et al., Design, construction, and test of compact distributed-charge, x-band accelerator systems that en- able image-guided, vhee flash radiotherapy, Front. Phys. 12, 1472759 (2024)
work page 2024
-
[18]
O. Luiten,KNAW-Agenda Grootschalige Onderzoeks- facaliteiten: Smart*Light: a Dutch table-top syn- chrotron light source, Tech. Rep. (Koninklijke Neder- landse Akademie van Wetenschappen (KNAW), 2016)
work page 2016
-
[19]
R. Hajima, Bandwidth of a Compton radiation source with an electron beam of asymmetric emittance, Nuclear Instruments and Methods in Physics Research Section A: Accelerators, Spectrometers, Detectors and Associated Equipment985, 164655 (2021)
work page 2021
-
[20]
Jackson,Classical Electrodynamics(Wiley, 1975)
J. Jackson,Classical Electrodynamics(Wiley, 1975)
work page 1975
-
[21]
V. Berestetskii, L. Pitaevskii, and E. Lifshitz, Quantum electrodynamics: Volume 4 (Pergamon, 1980) Chap. X
work page 1980
- [22]
-
[23]
V. Petrillo, A. Bacci, R. Ben Al` ı Zinati, I. Chaikovska, C. Curatolo, M. Ferrario, C. Maroli, C. Ronsivalle, A. Rossi, L. Serafini, P. Tomassini, C. Vaccarezza, and A. Variola, Photon flux and spectrum ofgamma-rays Compton sources, Nuclear Instruments and Methods in Physics Research Section A: Accelerators, Spectrometers, Detectors and Associated Equipm...
work page 2012
-
[24]
G. A. Krafft, E. Johnson, K. Deitrick, B. Terzi´ c, R. Kel- mar, T. Hodges, W. Melnitchouk, and J. R. Delayen, Laser pulsing in linear Compton scattering, Physical Re- view Accelerators and Beams19, 121302 (2016)
work page 2016
- [25]
-
[26]
A. Martens, F. Zomer, M. Amer, L. Amoudry, K. Cassou, K. Dupraz, and D. Nutarelli, Towards ultimate band- width photon sources based on compton backscattering: Design constraints due to nonlinear effects, Phys. Rev. Accel. Beams24, 091601 (2021)
work page 2021
-
[27]
P. Chen, G. Horton-Smith, T. Ohgaki, A. Weide- mann, and K. Yokoya, Cain: Conglom´ erat d’ABEL et d’interactions non-lin´ eaires, Nuclear Instruments and Methods in Physics Research Section A: Accelerators, Spectrometers, Detectors and Associated Equipment 355, 107 (1995)
work page 1995
-
[28]
P. Tomassini, A. Giulietti, D. Giulietti, and L. A. Gizzi, Thomson backscattering X-rays from ultra-relativistic electron bunches and temporally shaped laser pulses, Ap- plied Physics B80, 419 (2005)
work page 2005
-
[29]
G. A. Krafft, B. Terzi´ c, E. Johnson, and G. Wilson, Scat- tered spectra from inverse compton sources operating at high laser fields and high electron energies, Physical Re- view Special Topics Accelerators and Beams26, 034401 (2023)
work page 2023
- [30]
-
[31]
F. R. Arutyunian and V. A. Tumanian, The Compton effect on relativistic electrons and the possibility of ob- taining high energy beams, Journal of Experimental and Theoretical Physics17, 326 (1963)
work page 1963
- [32]
-
[33]
K. An, C. Yang, R. R. Dasari, and M. S. Feld, Cav- ity ring-down technique and its application to the mea- surement of ultraslow velocities, Optics Letters20, 1068 (1995)
work page 1995
-
[34]
The Virgo Collaboration, Measurement of the optical pa- rameters of the Virgo interferometer, Applied Optics46, 3466 (2007)
work page 2007
-
[35]
B. G¨ unther, M. Dierolf, K. Achterhold, and F. Pfeiffer, Device for source position stabilization and beam param- eter monitoring at inverse Compton X-ray sources, Jour- nal of Synchrotron Radiation26, 1546 (2019)
work page 2019
-
[36]
Schleede,X-ray Phase-Contrast Imaging at a Compact Laser-Driven Synchrotron Source, Ph.D
S. Schleede,X-ray Phase-Contrast Imaging at a Compact Laser-Driven Synchrotron Source, Ph.D. thesis, Technis- che Universit¨ at M¨ unchen (2013)
work page 2013
-
[37]
R. V. Pound, Electronic Frequency Stabilization of Mi- crowave Oscillators, Review of Scientific Instruments17, 490 (1946)
work page 1946
-
[38]
R. W. P. Drever, J. L. Hall, F. V. Kowalski, J. Hough, G. M. Ford, a. J. Munley, and H. Ward, Laser phase and frequency stabilization using an optical resonator, Applied Physics B Photophysics and Laser Chemistry 31, 97 (1983)
work page 1983
-
[39]
E. D. Black, An introduction to Pound–Drever–Hall laser frequency stabilization, American Journal of Physics69, 79 (2001)
work page 2001
-
[40]
B. G¨ unther, R. Gradl, C. Jud, E. Eggl, J. Huang, S. Kulpe, K. Achterhold, B. Gleich, M. Dierolf, and F. Pfeiffer, The versatile X-ray beamline of the Munich Compact Light Source : design , instrumentation and applications, Journal of Synchrotron Radiation27, 1395 (2020)
work page 2020
-
[41]
A. Stochino, K. Arai, and R. X. Adhikari, Technique for in situ measurement of free spectral range and transverse mode spacing of optical cavities, Applied Optics51, 6571 (2012)
work page 2012
-
[42]
L. Djevahirdjian, G. M´ ejean, and D. Romanini, Gouy phase shift measurement in a high-finesse cavity by opti- cal feedback frequency locking, Measurement Science and Technology31, 035013 (2020)
work page 2020
-
[43]
N. Uehara and K. Ueda, Accurate measurement of the radius of curvature of a concave mirror and the power dependence in a high-finesse Fabry-Perot interferometer, Applied Optics34, 5611 (1995). 19
work page 1995
-
[44]
N. Uehara and K. Ueda, Accurate measurement of ul- tralow loss in a high-finesse Fabry-Perot interferometer using the frequency response functions, Applied Physics B61, 9 (1995)
work page 1995
-
[45]
C. L. Mueller, P. Fulda, R. X. Adhikari, K. Arai, A. F. Brooks, R. Chakraborty, V. V. Frolov, P. Fritschel, E. J. King, D. B. Tanner, H. Yamamoto, and G. Mueller, In situ characterization of the thermal state of resonant op- tical interferometers via tracking of their higher-order mode resonances, Classical and Quantum Gravity32, 135018 (2015)
work page 2015
-
[46]
R. J. Loewen,SLAC-Report-632, Ph.D. thesis, Stanford University (2003)
work page 2003
-
[47]
S. Bleuler, M. Laumanns, L. Thiele, and E. Zitzler,PISA - a platform and programming language independent in- terface for search algorithms, Tech. Rep. 154 (Institut f¨ ur Technische Informatik und Kommunikationsnetze, ETH Zurich, 2002)
work page 2002
-
[48]
I. V. Bazarov and C. K. Sinclair, Multivariate optimiza- tion of a high brightness DC gun photoinjector, Physical Review Special Topics Accelerators and Beams8, 034202 (2005)
work page 2005
- [49]
-
[50]
M. Furman, Hourglass effect for asymmetric colliders, in Proceedings of the 1991 Particle Accelerator Conference (1991) pp. 422–424
work page 1991
-
[51]
E. Eggl, M. Dierolf, K. Achterhold, C. Jud, B. G¨ unther, E. Braig, B. Gleich, and F. Pfeiffer, The Munich Compact Light Source: Initial performance measures, Journal of Synchrotron Radiation23, 1137 (2016)
work page 2016
-
[52]
C. R. Locke, D. Stuart, E. N. Ivanov, and A. N. Luiten, A simple technique for accurate and complete character- isation of a Fabry-Perot cavity, Optics Express17, 21935 (2009)
work page 2009
-
[53]
Corning Incorporated, ULE ® Corning Code 7972, avail- able athttps://www.corning.com/media/worldwide/ csm/documents/7f674d33bf65415991f66861245349d32. pdf, accessed 2026.06.12
work page 2026
-
[54]
C. J. Glassbrenner and G. A. Slack, Thermal conductiv- ity of silicon and germanium from 3°k to the melting point, Phys. Rev.134, A1058 (1964)
work page 1964
-
[55]
T. Middelmann, A. Walkov, G. Bartl, and R. Sch¨ odel, Thermal expansion coefficient of single-crystal silicon from 7 k to 293 k, Phys. Rev. B92, 174113 (2015)
work page 2015
discussion (0)
Sign in with ORCID, Apple, or X to comment. Anyone can read and Pith papers without signing in.