REVIEW 2 major objections 6 minor 6 references
Single-laser stimulated Brillouin scattering microscopy
T0 review · 2 major / 6 minor · reviewed 2026-07-09 · glm-5.2
Pith's one-line read Single-laser scheme cuts Brillouin microscopy noise 10-fold
desk verdict Single-laser EOM-based SBS microscope with RF-defined frequency scanning — real architectural advance, one secondary claim is fragile read the letter →
The pith
A machine-rendered reading of the paper's core claim, the machinery that carries it, and where it could break.
The reading
What carries the argument
The load-bearing mechanism is common-mode laser-noise cancellation: because pump and probe originate from the same optical carrier, the carrier's frequency fluctuations appear identically in both beams and cancel when their difference is taken. The residual frequency-difference uncertainty reduces to RF source stability and electronic phase noise, which are orders of magnitude more controllable than independent-laser frequency noise. The electro-optic modulator in carrier-suppressed double-sideband mode generates the pump sideband; a tunable fiber Bragg grating filter selects the desired sideband; the RF source directly programs the spectral scan axis.
What would settle it
If the intrinsic Brillouin linewidth of the As₂Se₃ batch used in this work is broader than 27.69 MHz, the excess linewidth attributed to instrumental broadening would be overestimated, inflating the effective spectral resolution claim. Conversely, if the intrinsic linewidth is narrower, the system's resolution would be better than stated.
Extended reading notes
Core claim
The central object is the SL-EOM architecture: a single optical carrier split into pump and probe arms, where an electro-optic modulator generates an RF-defined sideband as the pump, making the pump-probe frequency difference equal to the RF drive frequency. This architecture transfers the frequency-difference definition from the optical domain (where two independent lasers introduce non-common-mode noise and tuning artifacts) to the RF domain (where frequency is set by a programmable source with high accuracy and stability). The key experimental finding is that this transfer yields Brillouin frequency-shift precision of 0.07 MHz and linewidth precision of 0.30 MHz — roughly an order of magn
Load-bearing premise
The claim of ~3 MHz effective spectral resolution depends on using a previously reported low-NA Brillouin linewidth of 27.69 MHz for As₂Se₃ glass as the reference for the intrinsic linewidth. The paper itself notes that samples from different batches were used across measurements and that absolute Brillouin frequency shifts differ among them. If the intrinsic linewidth of the specific glass batch used in this work differs from 27.69 MHz, the 3.1 MHz excess linewidth — and the
Editorial extensions
If this is right
- SBS microscopy could become practical for detecting mechanical contrasts at the 10⁻⁴ level in materials and potentially biological samples, where prior systems struggled to reliably resolve contrasts below ~10⁻³.
- The RF-defined frequency axis could enable sub-megahertz frequency step sizes without mechanical tuning, allowing denser sampling of Brillouin resonances and reducing fitting bias from sparse spectral data.
- Common-mode noise rejection via single-laser architectures could be adopted in other coherent spectroscopy techniques that rely on a tunable frequency difference between two optical fields.
- The architecture simplifies SBS systems by removing the need for auxiliary heterodyne metrology or laser locking to track the pump-probe detuning, potentially reducing system complexity and cost.
Reading between the lines
- If the ~3 MHz effective spectral resolution can be further reduced (e.g., by improving sideband suppression, reducing NA-related broadening, or using lower-noise RF sources), the system could approach the intrinsic Brillouin linewidth limit, enabling measurement of true acoustic damping rather than instrument-broadened estimates.
- The current demonstration uses As₂Se₃ glass at 1551 nm; extending to biologically relevant wavelengths (e.g., 780 nm) would require different EOM and fiber components, and the common-mode rejection advantage may depend on the specific laser source used.
- The 10⁻⁴ modulus contrast sensitivity, if achievable in biological specimens at biocompatible powers, could resolve mechanical heterogeneity at sub-cellular scales that is currently inaccessible, though the high pump/probe powers used here (36–60 mW) would need reduction for live-sample imaging.
- Comparing the SL-EOM architecture against a conventional dual-laser wavelength-tuning system (rather than the controlled dual-laser comparison used here, which replaces only the probe arm) would provide a more direct benchmark against the actual systems the authors claim to improve upon.
Editorial analysis
A structured set of objections, weighed in public.
Referee Report
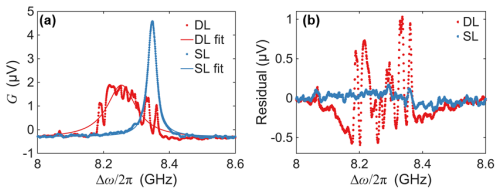
Summary. This manuscript presents a single-laser electro-optic-modulation (SL-EOM) architecture for stimulated Brillouin scattering (SBS) microscopy. In this scheme, pump and probe beams are derived from the same optical carrier, and their frequency difference is set by an RF-driven EOM sideband rather than by independent laser wavelength tuning. This makes laser frequency noise largely common mode and replaces optical wavelength scanning with RF-frequency scanning. The authors demonstrate the system on As₂Se₃ chalcogenide glass, reporting Brillouin frequency-shift and linewidth precisions of 0.07 MHz and 0.30 MHz (from 10 repeated measurements at 0.5 MHz frequency step, 1 ms integration per point), and an effective spectral resolution of ~3 MHz estimated by comparison to a low-NA reference linewidth. A controlled dual-laser (DL) comparison isolates the effect of non-common-mode laser noise. Imaging of femtosecond-laser-modified As₂Se₃ glass resolves MHz-level Brillouin frequency contrasts (~1.7 MHz minimum, ~2.75–2.82 MHz between adjacent modified regions), corresponding to 10⁻⁴-level apparent longitudinal-modulus contrast.
Significance. The central architectural contribution—transferring the pump–probe frequency-difference definition from optical wavelength tuning to RF-domain control via a single-laser EOM scheme—is a well-motivated and technically sound approach that directly addresses a real limitation in frequency-domain SBS microscopy. The controlled SL-vs-DL comparison (Fig. 3, Fig. 4) is a well-designed experiment that cleanly isolates the effect of non-common-mode laser noise under otherwise identical conditions. The reported precision values (0.07 MHz frequency-shift, 0.30 MHz linewidth) are measured directly as standard deviations over 10 repeated measurements and are not circularly defined. The imaging demonstration on femtosecond-laser-modified glass provides a concrete, falsifiable application showing MHz-level contrast resolution. The effective spectral resolution claim of ~3 MHz, however, depends on a cross-study linewidth comparison that is sensitive to sample-batch variation; this is a secondary metric, not a load-bearing element of the core architecture claim.
major comments (2)
- §3.2 and Supplementary S4, Eq. (S14): The effective spectral resolution of ~3 MHz is derived from the difference between the measured linewidth (30.82 MHz at NA=0.125) and a low-NA reference linewidth of 27.69 MHz from Ref. [23] (Sonehara et al., measured at NA=0.0135 on a different sample batch). Supplementary S5 explicitly states that 'samples from different batches were used' across Sections 3.1–3.3, and the absolute Brillouin frequency shifts vary by ~25–30 MHz between batches (8347.59 MHz in §3.2 vs. ~8371–8377 MHz in §3.3). If the intrinsic linewidth of the specific As₂Se₃ batch used in §3.2 differs from 27.69 MHz by even ±2 MHz, the 3.13 MHz excess linewidth—and thus the ~3 MHz effective spectral resolution—would shift substantially or could vanish. The precision values (0.07 MHz, 0.30 MHz) are repeatability measures from 10 trials on one spot and do not depend on this external参考,
- Table S1: The cross-system comparison lists effective spectral resolution values for prior SBS systems alongside the present work's ~3 MHz value. Given that the ~3 MHz figure is an operational estimate dependent on a cross-batch linewidth subtraction (see major comment 1), presenting it in the same table as a headline performance metric alongside other systems' resolutions risks overstating the precision of this comparison. The authors should either (a) clearly flag this entry as an approximate operational estimate with explicit error bounds, or (b) provide an independent measurement of the intrinsic linewidth of the specific As₂Se₃ batch used in §3.2 (e.g., via a low-NA measurement on the same sample) to substantiate the ~3 MHz claim. At minimum, the abstract and conclusion should qualify the ~3 MHz figure as an upper-bound estimate rather than a resolved instrumental bandwidth.
minor comments (6)
- §2.1, Eq. (1) and surrounding text: The notation switches between angular frequency (ω) and ordinary frequency (f or Ω/2π) without consistent flagging. While Supplementary S1 provides a symbol table, a brief note in the main text clarifying the convention would help readers.
- Fig. 4(c) and (f): The gray dashed line at 27.69 MHz in panel (c) is labeled as the low-NA reference linewidth from Ref. [23]. In panel (f), the same dashed line is described as 'only a scale reference.' This dual use of the same line for different purposes could confuse readers; consider using distinct line styles or adding a clarifying note.
- §3.3: The modulus contrast is estimated using ΔM'/M' ≈ 2ΔΩ_B/Ω_B, which assumes that local changes in refractive index and density are small compared to the acoustic-velocity change. The authors acknowledge this in Supplementary S6, but a brief caveat in the main text (one sentence) would improve transparency for readers who do not consult the supplement.
- Supplementary S5: The statement that 'samples from different batches were used' across Sections 3.1–3.3 is important context for interpreting the different absolute Brillouin frequency shifts reported. This information should be briefly noted in the main text at the point where the different frequency shifts are first presented (§3.1 vs. §3.2 vs. §3.3), rather than only in the supplement.
- §3.2: The pump and probe powers at the sample are stated as 36 mW and 27 mW for the spectral measurements, while §3.3 uses 40 mW and 60 mW for imaging. A brief note on whether the higher powers used for imaging affected the observed linewidths or introduced any thermal effects would be useful.
- Author contributions list a 'C.F.K.' among supervisors, but this name does not appear in the author list above. This should be corrected.
Simulated Author's Rebuttal
We thank the referee for a careful and constructive review. The referee correctly identifies the core contribution of the paper—the SL-EOM architecture and the controlled SL-vs-DL comparison—and raises two related major comments concerning the ~3 MHz effective spectral resolution estimate, which depends on a cross-batch linewidth subtraction using a reference value from Ref. [23] (Sonehara et al.). We agree that this estimate is sensitive to sample-batch variation and that the manuscript does not adequately qualify it as an approximate operational upper bound rather than a precisely measured instrumental bandwidth. We will revise the manuscript accordingly.
read point-by-point responses
-
Referee: §3.2 and Supplementary S4, Eq. (S14): The effective spectral resolution of ~3 MHz is derived from the difference between the measured linewidth (30.82 MHz at NA=0.125) and a low-NA reference linewidth of 27.69 MHz from Ref. [23] (Sonehara et al., measured at NA=0.0135 on a different sample batch). Supplementary S5 explicitly states that 'samples from different batches were used' across Sections 3.1–3.3, and the absolute Brillouin frequency shifts vary by ~25–30 MHz between batches (8347.59 MHz in §3.2 vs. ~8371–8377 MHz in §3.3). If the intrinsic linewidth of the specific As₂Se₃ batch used in §3.2 differs from 27.69 MHz by even ±2 MHz, the 3.13 MHz excess linewidth—and thus the ~3 MHz effective spectral resolution—would shift substantially or could vanish. The precision values (0.07 MHz, 0.30 MHz) are repeatability measures from 10 trials on one spot and do not depend on this external参考.
Authors: The referee is correct on all points. The ~3 MHz effective spectral resolution is an operational estimate derived from a cross-study linewidth subtraction, and it is sensitive to batch-to-batch variation in the intrinsic Brillouin linewidth of As₂Se₃. We acknowledge that the 25–30 MHz absolute frequency-shift differences between batches (8347.59 MHz in §3.2 vs. ~8371–8377 MHz in §3.3) underscore that the reference linewidth of 27.69 MHz from Sonehara et al. (Ref. [23]) may not exactly match the intrinsic linewidth of the specific batch used in §3.2. If the intrinsic linewidth of our batch differs by ±2 MHz, the 3.13 MHz excess would shift to ~1–5 MHz or could in principle vanish. We agree that this sensitivity must be stated explicitly. We also agree that the precision values (0.07 MHz, 0.30 MHz) are independent of this cross-batch comparison—they are measured directly as standard deviations over 10 repeated measurements on one spot and do not rely on the external reference. In the revised manuscript, we will: (1) add explicit language in §3.2 and Supplementary S4 stating that the ~3 MHz figure is an approximate operational estimate that depends on a cross-batch reference linewidth and is therefore subject to sample-batch variation; (2) note that an independent low-NA measurement on the same batch would be needed to substantiate the exact value; and (3) ensure the abstract and conclusion qualify the ~3 MHz as an upper-bound estimate rather than a resolved instrumental bandwidth. The core architecture claim, the controlled SL-vs-DL comparison, and the directly measured precision values are unaffected by this qualification. revision: yes
-
Referee: Table S1: The cross-system comparison lists effective spectral resolution values for prior SBS systems alongside the present work's ~3 MHz value. Given that the ~3 MHz figure is an operational estimate dependent on a cross-batch linewidth subtraction (see major comment 1), presenting it in the same table as a headline performance metric alongside other systems' resolutions risks overstating the precision of this comparison. The authors should either (a) clearly flag this entry as an approximate operational estimate with explicit error bounds, or (b) provide an independent measurement of the intrinsic linewidth of the specific As₂Se₃ batch used in §3.2 (e.g., via a low-NA measurement on the same sample) to substantiate the ~3 MHz claim. At minimum, the abstract and conclusion should qualify the ~3 MHz figure as an upper-bound estimate rather than a resolved instrumental bandwidth.
Authors: We agree with the referee's concern. Presenting the ~3 MHz value in Table S1 alongside other systems' effective spectral resolutions without adequate qualification could overstate the rigor of the comparison, given that our value is derived from a cross-batch linewidth subtraction while the other entries may use different methodologies. We will adopt option (a): in the revised Table S1, we will add an explicit footnote or annotation flagging our effective spectral resolution entry as an approximate operational estimate derived from a cross-batch reference linewidth subtraction, subject to sample-batch variation, rather than a directly measured instrumental bandwidth. We will also add a note that the comparison across systems should be interpreted as an approximate benchmark rather than a strictly normalized performance ranking, as the values were obtained using different samples, configurations, and methodologies. Regarding option (b), we do not currently have an independent low-NA measurement on the specific As₂Se₃ batch used in §3.2, and we cannot honestly claim to have one. We will therefore not pursue option (b) and will instead clearly qualify the entry as an upper-bound estimate. The abstract and conclusion will be revised to state that the ~3 MHz figure is an approximate upper-bound estimate of the effective spectral resolution, dependent on a cross-study reference linewidth, rather than a directly resolved instrumental bandwidth. revision: yes
Circularity Check
No circularity found: precision is measured by repeatability, effective resolution is estimated from an external reference
full rationale
The paper's central claims are not circular. The frequency-shift precision (0.07 MHz) and linewidth precision (0.30 MHz) are measured directly as the standard deviation of fitted Brillouin parameters over 10 repeated measurements on the same spot—no fitted parameter is defined in terms of the result it claims to predict. The effective spectral resolution (~3 MHz) is estimated from the excess of the measured linewidth (30.82 MHz) over an external reference linewidth (27.69 MHz from Sonehara et al., Ref. [23]). While the skeptic correctly notes that this secondary claim is sensitive to batch-to-batch variation in the intrinsic linewidth (acknowledged in Supplementary S5), this is a correctness risk, not circularity: the reference value comes from an independent external publication, not from the authors' own prior work or from a fit to the data being predicted. The SL-vs-DL comparison uses a controlled experiment with identical conditions except for the laser configuration, and the imaging results (MHz-level contrasts) are validated against the independently measured precision. No self-citation chain, no fitted input renamed as prediction, no self-definitional loop was found in the derivation chain. The derivation is self-contained against external benchmarks.
Assumptions & free parameters
free parameters (3)
- RF drive frequency scan range and step size =
7.5-9.5 GHz range, 0.5-20 MHz steps
- Lock-in amplifier sensitivity =
500 μV (imaging), not specified for spectral measurements
- Pump and probe powers at sample =
36/27 mW (spectral), 40/60 mW (imaging)
assumptions (4)
- standard math The measured SBS spectral response is well-described by a Lorentzian function (Eq. S2).
- domain assumption Local variations in refractive index n and density ρ are small compared with the acoustic-velocity change, so ΔM'/M' ≈ 2ΔΩ_B/Ω_B (Eq. S17).
- domain assumption The low-NA reference linewidth of 27.69 MHz from Ref. [23] is a valid proxy for the intrinsic Brillouin linewidth of the As₂Se₃ sample used in this work.
- domain assumption The AOM frequency shifts in the pump and probe arms are matched (both 80 MHz) and do not affect the scanned frequency-difference axis.
Cite this review
Pith. "Pith review of Single-laser stimulated Brillouin scattering microscopy." pith.science (2026). https://pith.science/paper/E62SWRFJ
@misc{pith2026260706961,
  author       = {Pith},
  title        = {Pith review of: Single-laser stimulated Brillouin scattering microscopy},
  year         = {2026},
  howpublished = {\url{https://pith.science/paper/E62SWRFJ}},
  note         = {Machine review of arXiv:2607.06961}
}
read the original abstract
Stimulated Brillouin scattering (SBS) microscopy enables label-free mapping of local viscoelastic properties, but frequency-domain implementations are often limited by uncertainty in the pump-probe frequency-difference axis. We demonstrate an RF-defined single-laser electro-optic-modulation SBS microscope in which the pump and probe are derived from the same optical carrier and their frequency difference is set by an electro-optically generated sideband. This architecture makes laser-frequency noise largely common mode and eliminates optical wavelength tuning during spectral scanning. It achieves Brillouin frequency shift and linewidth precisions of 0.07 MHz and 0.30 MHz, respectively. Comparison with a low-NA reference linewidth indicates a system-level spectral broadening of approximately 3.1 MHz, corresponding to an effective spectral resolution of approximately 3 MHz. Imaging of femtosecond-laser-modified chalcogenide glass resolves MHz-level Brillouin contrasts corresponding to 10^-4-level apparent longitudinal-modulus contrast. This work demonstrates the feasibility of transferring the frequency definition of SBS spectral scanning from optical wavelength tuning to RF-domain control, providing a new conceptual and technical basis for high-precision, high-spectral-fidelity Brillouin imaging.
Figures


Reference graph
Works this paper leans on
-
[1]
I. Remer, R. Shaashoua, N. Shemesh , et al. , "High-sensitivity and high -specificity biomechanical imaging by stimulated Brillouin scattering microscopy," Nat. Methods 17, 913–916 (2020)
work page 2020
-
[2]
Pulsed stimulated Brillouin microscopy,
D. M. Chow and S. H. Yun, "Pulsed stimulated Brillouin microscopy," Opt. Express 31, 19818–19827 (2023)
work page 2023
-
[3]
F. Yang, C. Bevilacqua, S. Hambura , et al. , "Pulsed stimulated Brillouin microscopy enables high -sensitivity mechanical imaging of live and fragile biological specimens," Nat. Methods 20, 1971–1979 (2023)
work page 1971
-
[4]
Stimulated Brillouin scattering microscopy with a high -peak-power 780-nm pulsed laser system,
Y. Qi, S. Yao, Z. -X. Du, et al. , "Stimulated Brillouin scattering microscopy with a high -peak-power 780-nm pulsed laser system," Nat. Photonics 19, 879–887 (2025)
work page 2025
-
[5]
Frequency-modulated stimulated Brillouin spectroscopy in high - refractive-index glasses,
T. Sonehara, H. Kaminaga, E. Tatsu , et al. , "Frequency-modulated stimulated Brillouin spectroscopy in high - refractive-index glasses," J. Non-Cryst. Solids 354, 1768–1773 (2008)
work page 2008
-
[6]
Brillouin microscopy: an emerging tool for mechanobiology,
R. Prevedel, A. Diz -Munoz, G. Ruocco, et al. , "Brillouin microscopy: an emerging tool for mechanobiology," Nat. Methods 16, 969–977 (2019). (a) (c) (b) (d) (e) 5μm 0.32 μJ 0.65 μJ 1.18 μJ 1.73 μJ
work page 2019
Reviewed July 9, 2026 · model on record in the stance chip above.
Discussion (0). Sign in to comment.