REVIEW 2 major objections 7 minor 1 cited by
Predicting ionised gas emission in 3D with SKIRT. I. Framework and validation
T0 review · 2 major / 7 minor · reviewed 2026-07-14 · grok-4.5
Pith's one-line read A new SKIRT module predicts 3D ionised-gas emission lines from hydrodynamical simulations in one Monte Carlo run with dust.
desk verdict Solid engineering paper: a usable 3D photoionisation module inside SKIRT, validated honestly against Cloudy and COLT, with residuals diagnosed rather than hidden. read the letter →
The pith
A machine-rendered reading of the paper's core claim, the machinery that carries it, and where it could break.
The reading
What carries the argument
DiffuseIonizedGasMix: a hybrid module that characterises the local 1–6 Ryd radiation field by log U and four spectral-shape ratios, maps them via dual pre-computed Cloudy tables to temperature and opacity inside SKIRT’s iteration cycle, then uses an inline multi-element ionisation solver at the converged temperature to compute recombination and collisional line emissivities.
What would settle it
Re-run the same 60 spherical-shell grid and the Milky Way-analogue with a full on-the-fly multi-element thermal solver or with finer spectral binning; if the median [S II] ratio moves substantially closer to unity and the three-dimensional [O III]/[S II] excesses disappear while hydrogen lines remain unchanged, the five-bin table approximation is insufficient.
Extended reading notes
Core claim
DiffuseIonizedGasMix enables self-consistent three-dimensional synthetic observations of ionised-gas emission lines, dust attenuation and dust re-emission in a single Monte Carlo radiative-transfer run. On a 60-model one-dimensional grid the hydrogen lines agree with Cloudy to within a few per cent (Hα median ratio 0.97) and most forbidden lines to ~5 %; on a Milky Way-analogue galaxy integrated luminosities and pixel maps agree with COLT at r ≥ 0.92, making the module applicable to arbitrary hydrodynamical simulations.
Load-bearing premise
That five energy bins plus solar-scaled Cloudy tables recover gas temperature accurately enough near ionisation fronts for the metal-line calculation to stay reliable.
Editorial extensions
If this is right
- Any hydrodynamical snapshot can be post-processed into emission-line maps that already include dust attenuation and re-emission without separate photoionisation steps.
- Mock integral-field observations (MUSE, JWST/NIRSpec) can be generated with consistent geometry, inclination and multi-phase ISM structure.
- BPT diagrams and other line-ratio diagnostics can be forward-modelled across cosmic time by varying ionising spectra and abundance patterns inside the same radiative-transfer framework.
- Compact H II regions can still be treated by sub-grid libraries while the resolved diffuse ionised gas is handled self-consistently on the grid.
Reading between the lines
- Once multi-metallicity tables exist, the same module can test whether non-solar abundance patterns or harder spectra drive the high-redshift BPT offset without changing the radiative-transfer core.
- The residual [S II] and [O III] excesses already flag that ionisation-front resolution and diffuse Lyman-continuum treatment remain the dominant modelling uncertainties for low-ionisation lines.
- Pairing the module with adaptive mesh refinement guided by local ionisation state would tighten the comparison to pure on-the-fly photoionisation codes.
Editorial analysis
A structured set of objections, weighed in public.
Referee Report
Summary. The paper introduces DiffuseIonizedGasMix, a new SKIRT material-mix module for 3D photoionisation of ionised gas. It characterises the local ionising field (1–6 Ryd) by log U and four spectral-shape ratios, maps these via dual pre-computed Cloudy STAB tables to temperature and opacity, and evaluates line emissivities with an inline multi-element ionisation solver at the converged state. The module is validated on 60 one-dimensional spherical shells against Cloudy (and COLT) and on a three-dimensional Milky Way-analogue Arepo/SMUGGLE snapshot against COLT. In 1D, Hα and Hβ agree with Cloudy to a few per cent (median ratios 0.97 and 0.94), [O III] and [N II] to ~2–4%, while [S II] λ6717 is high by a median factor 1.23, attributed to a temperature overestimate near the ionisation front. In 3D, pixel correlations reach r ≥ 0.92, hydrogen lines and [N II] agree well in integrated luminosity, and [O III]/[S II] are systematically elevated by ~70–80%, with a cell-level decomposition in Appendix D. The authors conclude that the module enables self-consistent synthetic observations of ionised-gas lines, dust attenuation, and dust re-emission in a single MCRT run.
Significance. If the reported accuracy holds under the stated assumptions, this is a substantial and timely methods contribution. SKIRT is already a standard tool for dust radiative transfer on hydrodynamical snapshots; adding a publicly released, grid-native photoionisation module that shares the same iteration cycle, spatial grids, and instrument pipeline removes a major post-processing gap for IFU-style mock observations (MaNGA, MUSE, JWST/NIRSpec). Strengths include: (i) external validation against two independent codes (Cloudy and COLT) in both 1D and 3D; (ii) quantitative residual diagnostics (Figs. 7–9, 12–15; Tables 5, 7; Appendices B and D) rather than only headline agreement; (iii) a modular hybrid design that imports Cloudy microphysics for T/κ while retaining wavelength-resolved ion fractions for emission; and (iv) open release of the module and tables in the SKIRT codebase. The solar-only, dust-free validation scope is clearly flagged for future papers, so the engineering claim is appropriately bounded.
major comments (2)
- [Abstract; §3; §4 Limitations] Abstract and §4 claim that the module enables self-consistent synthetic observations in which ionised-gas lines, dust attenuation, and dust re-emission are computed in a single MCRT run. All quantitative validation (§3.1–3.2) is deliberately dust-free. While §4 correctly notes that dust media can be co-deployed and that dust-modified (log U, Ri) can query the existing tables, the manuscript should more sharply separate (a) physics that has been validated (photoionisation T, κ, and lines without dust) from (b) architectural capability that is enabled but not yet benchmarked with dust present. A short explicit statement in the abstract and at the start of §3 would prevent over-reading of the current accuracy numbers.
- [§3.2.2; Table 7; Appendix D; §4] The 3D integrated excesses for [O III] λ5007 (ΣS/ΣC = 1.68) and [S II] λ6717 (1.78) are large enough to matter for BPT and DIG science applications, even though Appendix D provides a clear cell-level decomposition (temperature offset for [O III]; diffuse-LyC vs OTS Case B for [S II] midplane cells). The main text (§3.2.2 and §4) should elevate a concise user-facing accuracy statement: which lines and which diagnostics (e.g. Balmer decrement, [N II]/Hα, [O III]/Hβ) are reliable at the ~0.1–0.2 dex level under the current tables and reemission treatment, and which require the forthcoming multi-metallicity / refined-front work. Without that, readers may either over-trust or dismiss the module based on the raw 70–80% factors alone.
minor comments (7)
- [Fig. 8; Table 5] Fig. 8 caption and text: the logarithmic 1−r/rS axis is effective, but the coloured bars (10th–90th percentile of Cloudy cumulative emissivity) would be easier to read if the corresponding peak r/rS values were also listed in the caption or in Table 5.
- [§2.3; Table 2] Table 2 and §2.3: the transition-table Ri ranges extend to very large positive values (e.g. log R5 up to +31.1). A brief note on whether these extremes are actually sampled in the 1D/3D runs, or only pad the interpolation domain, would help readers judge table coverage.
- [§2.7] §2.7: the statement that collisional excitation of hydrogen lines is neglected (to be added later) is appropriate, but a one-sentence bound on the expected Lyα error at the temperatures reached in the MW run (T ≲ 10^4 K for most emitting cells) would be useful for users planning UV applications.
- [§2.4; Appendix A] Appendix A: the per-cell converged fraction plateaus near ~64% while global NH+ converges; this is well explained, but a short remark in §2.4 pointing to Appendix A would help readers who only skim the methods.
- [Fig. 15; §3.2.2] Fig. 15 BPT comparison: the broader COLT composite/LINER wing is attributed to Courant-limited cooling preserving hot low-density gas. Consider adding a one-line note on whether a temperature floor or cut on shock-heated cells was applied in either code for the BPT pixels, to aid reproducibility.
- [Abstract; §2.3] Minor typography: abstract and body mix Halpha/Hα and [S II] 6717 vs λ6717; standardise to journal style. Also, ‘T wo’ appears as a split word in §2.3 (‘T wo sets of tables’).
- [§3.2.1; References] References: the COLT 3D comparison relies on McClymont et al. 2025 (arXiv:2510.13952); ensure the citation is updated if a journal version appears before final acceptance, and that the snapshot configuration (density ceiling, abundances) is fully specified for external reproduction.
Circularity Check
No circularity: hybrid Cloudy-table + inline-solver module is validated against independent external codes, not forced by construction.
full rationale
DiffuseIonizedGasMix is an engineering methods paper. Temperature and opacity come from pre-computed Cloudy STAB tables indexed by log U and four spectral-shape ratios; ion fractions and line emissivities are then computed by an independent inline solver on the converged wavelength-resolved field (Sect. 2.3, 2.7). Validation is against full Cloudy on 60 1D shells and against COLT on a 3D MW-analogue (Sect. 3.1–3.2), with residuals reported rather than absorbed (Hα median 0.97; [S II] 1.23 from front temperature overestimate; 3D [O III]/[S II] excesses decomposed in Appendix D). Agreement is not guaranteed by construction: a bad 5-bin characterisation or table handoff would produce large line errors, and the paper measures those errors. Self-citations are to prior SKIRT infrastructure (grids, dust, TODDLERS), not to uniqueness theorems or fitted targets that force the present photoionisation results. No fitted-input-as-prediction, no self-definitional loop, no ansatz smuggled as external fact. The derivation chain is self-contained against external benchmarks.
Assumptions & free parameters
free parameters (5)
- number of ionising spectral bins =
5
- per-cell convergence threshold ϵ_cell =
0.01
- global NH+ convergence threshold ϵ_global =
0.001
- density ceiling for emission =
1000 cm^{-3}
- table blending width in log U =
0.3 dex
assumptions (4)
- domain assumption Local photoionisation and thermal equilibrium can be tabulated from Cloudy as a function of log U and four spectral-shape ratios at fixed solar abundances.
- domain assumption Case B recombination coefficients (Hui & Gnedin 1997; Storey & Hummer 1995) and CHIANTI collisional rates adequately describe the optical lines of interest.
- domain assumption Diffuse re-emission of ionising photons can be treated as isotropic scattering with Wood et al. (2004) channel probabilities and OTS for He Lyα.
- ad hoc to paper Monte Carlo noise and residual unconverged low-U cells do not bias integrated line luminosities once the global NH+ criterion is met.
invented entities (3)
-
DiffuseIonizedGasMix material-mix module
-
Five-bin radiation-field characterisation (log U + R2–R5)
-
Dual STAB table system (standard + transition)
Cite this review
Pith. "Pith review of Predicting ionised gas emission in 3D with SKIRT. I. Framework and validation." pith.science (2026). https://pith.science/paper/FH6E6SO6
@misc{pith2026260709961,
  author       = {Pith},
  title        = {Pith review of: Predicting ionised gas emission in 3D with SKIRT. I. Framework and validation},
  year         = {2026},
  howpublished = {\url{https://pith.science/paper/FH6E6SO6}},
  note         = {Machine review of arXiv:2607.09961}
}
read the original abstract
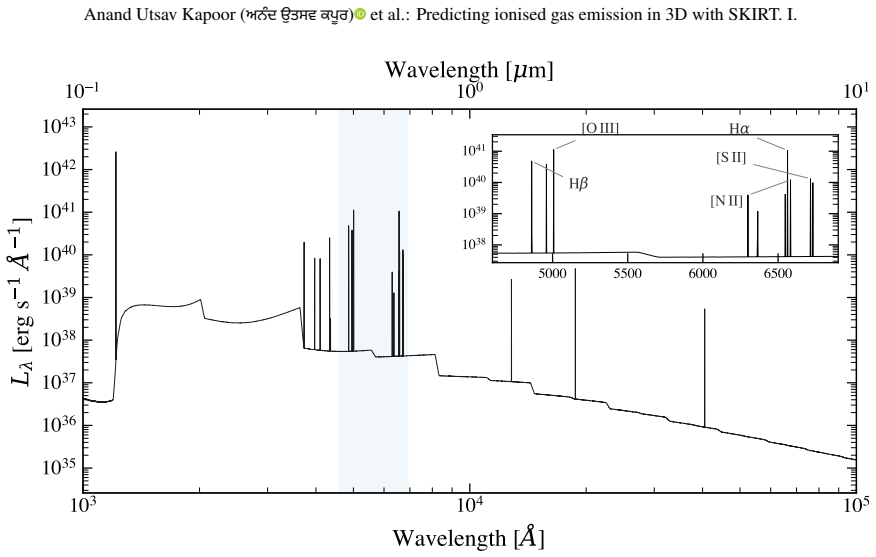
Emission lines from ionised gas are key diagnostics of star formation, metallicity, and ionisation conditions in galaxies. Interpreting spatially resolved observations from integral-field surveys (e.g. MaNGA, MUSE, JWST/NIRSpec) and comparing them with hydrodynamical simulations requires 3D photoionisation models that handle realistic geometries, dust attenuation, and synthetic instrument output. We present a new photoionisation module for the Monte Carlo radiative transfer code SKIRT that predicts emission-line luminosities of ionised gas in 3D, combining pre-computed Cloudy tables for gas temperature and opacity with a direct calculation of ion fractions and line emissivities. The local ionising radiation field (1-6 Ryd) is characterised by log U and four spectral-shape ratios; Cloudy tables map these to temperature and opacity, converging through SKIRT's existing iteration cycle. An inline solver then determines ion fractions from the converged field and temperature and evaluates line emissivities. We validate against Cloudy on 60 spherical shell models and against COLT on a Milky Way-analogue galaxy. On the 1D grid, hydrogen recombination lines agree with Cloudy to within a few per cent (Halpha median ratio 0.97) and the forbidden lines to within ~5%, except [S II] 6717 (1.23), whose offset traces a temperature overestimate near the ionisation front. In 3D, integrated luminosities agree with COLT to within 18% for the hydrogen lines and 2% for [N II], while [O III] and [S II] are elevated by ~70 and ~80%. Pixel-by-pixel correlation coefficients reach r >= 0.92, with luminosity-weighted scatter of 0.14-0.31 dex and broadly consistent BPT ratios. The module enables self-consistent synthetic observations in which ionised-gas emission lines, dust attenuation, and dust re-emission are computed in a single MCRT run, applicable to any hydrodynamical simulation.
Figures


Figures from the paper (12 more)




Forward citations
Cited by 1 Pith paper
-
The TNG50-SKIRT Atlas: Spatially resolved synthetic galaxies from the ultraviolet to the submillimetre (DR2)
TNG50-SKIRT Atlas DR2 provides 1154 simulated galaxies with resolved UV-to-submm images, spectral cubes, and dust-aware synthetic observables, publicly released.
Reference graph
Works this paper leans on
-
[1]
2022, A&A, 666, A101 2 https://github.com/SKIRT/SKIRT9 Article number, page 14 of 18 Anand Utsav Kapoor ( ਅਨੰਦ ਉਤਸਵ ਕਪੂਰ ) et al.: Predicting ionised gas emission in 3D with SKIRT
Baes, M., Camps, P ., & Matsumoto, K. 2022, A&A, 666, A101 2 https://github.com/SKIRT/SKIRT9 Article number, page 14 of 18 Anand Utsav Kapoor ( ਅਨੰਦ ਉਤਸਵ ਕਪੂਰ ) et al.: Predicting ionised gas emission in 3D with SKIRT. I
2022
-
[2]
D., Lunttila, T., et al
Baes, M., Gordon, K. D., Lunttila, T., et al. 2016, A&A, 590, A55
2016
-
[3]
2011, ApJS, 196, 22
Baes, M., Verstappen, J., De Looze, I., et al. 2011, ApJS, 196, 22
2011
-
[4]
Bakes, E. L. O. & Tielens, A. G. G. M. 1994, ApJ, 427, 822
1994
-
[5]
A., Phillips, M
Baldwin, J. A., Phillips, M. M., & Terlevich, R. 1981, PASP , 93, 5
1981
-
[6]
2016, MNRAS, 461, 3111
Belfiore, F., Maiolino, R., Maraston, C., et al. 2016, MNRAS, 461, 3111
2016
-
[7]
2022, A&A, 659, A26
Belfiore, F., Santoro, F., Groves, B., et al. 2022, A&A, 659, A26
2022
-
[8]
Burke, J. R. & Hollenbach, D. J. 1983, ApJ, 265, 223
1983
Show all 70 references
-
[9]
& Baes, M
Camps, P . & Baes, M. 2015, Astronomy and Computing, 9, 20
2015
-
[10]
& Baes, M
Camps, P . & Baes, M. 2020, Astronomy and Computing, 31, 100381
2020
-
[11]
2013, A&A, 560, A35
Camps, P ., Baes, M., & Saftly, W. 2013, A&A, 560, A35
2013
-
[12]
U., & Grand, R
Camps, P ., Behrens, C., Baes, M., Kapoor, A. U., & Grand, R. 2021, ApJ, 916, 39
2021
-
[13]
2015, A&A, 580, A87
Camps, P ., Misselt, K., Bianchi, S., et al. 2015, A&A, 580, A87
2015
-
[14]
2003, PASP , 115, 763 Del Zanna, G., Dere, K
Chabrier, G. 2003, PASP , 115, 763 Del Zanna, G., Dere, K. P ., Y oung, P . R., & Landi, E. 2021, ApJ, 909, 38
2003
-
[15]
P ., Landi, E., Mason, H
Dere, K. P ., Landi, E., Mason, H. E., Monsignori Fossi, B. C., & Y oung, P . R. 1997, A&AS, 125, 149
1997
-
[16]
W., Victor, G
Drake, G. W., Victor, G. A., & Dalgarno, A. 1969, Physical Review, 180, 25
1969
-
[17]
J., Stanway, E
Eldridge, J. J., Stanway, E. R., Xiao, L., et al. 2017, PASA, 34, e058
2017
-
[18]
J., & Storey, P
Ercolano, B., Barlow, M. J., & Storey, P . J. 2005, MNRAS, 362, 1038
2005
-
[19]
J., Storey, P
Ercolano, B., Barlow, M. J., Storey, P . J., & Liu, X.-W . 2003, MNRAS, 340, 1136
2003
-
[20]
& Storey, P
Ercolano, B. & Storey, P . J. 2006, MNRAS, 372, 1875
2006
-
[21]
J., Chatzikos, M., Guzmán, F., et al
Ferland, G. J., Chatzikos, M., Guzmán, F., et al. 2017, Rev. Mexicana Astron. Astrofis., 53, 385 Förster Schreiber, N. M. & Wuyts, S. 2020, ARA&A, 58, 661
2017
-
[22]
L., Tsujita, A., et al
Fujimoto, S., Faisst, A. L., Tsujita, A., et al. 2025, arXiv e-prints, arXiv:2510.16116
2025
-
[23]
J., & Scott, P
Grevesse, N., Asplund, M., Sauval, A. J., & Scott, P . 2010, Ap&SS, 328, 179
2010
-
[24]
M., Dettmar, R.-J., Beckman, J
Haffner, L. M., Dettmar, R.-J., Beckman, J. E., et al. 2009, Reviews of Modern Physics, 81, 969
2009
-
[25]
& Gnedin, N
Hui, L. & Gnedin, N. Y . 1997, MNRAS, 292, 27
1997
-
[26]
2022, MNRAS, 511, 4005
Kannan, R., Garaldi, E., Smith, A., et al. 2022, MNRAS, 511, 4005
2022
-
[27]
2020, MNRAS, 499, 5732
Kannan, R., Marinacci, F., Vogelsberger, M., et al. 2020, MNRAS, 499, 5732
2020
-
[28]
2025, The Open Journal of Astro- physics, 8, 153
Kannan, R., Puchwein, E., Smith, A., et al. 2025, The Open Journal of Astro- physics, 8, 153
2025
-
[29]
2019, MNRAS, 485, 117
Kannan, R., Vogelsberger, M., Marinacci, F., et al. 2019, MNRAS, 485, 117
2019
-
[30]
U., Baes, M., van der Wel, A., et al
Kapoor, A. U., Baes, M., van der Wel, A., et al. 2023, MNRAS, 526, 3871
2023
-
[31]
U., Baes, M., van der Wel, A., et al
Kapoor, A. U., Baes, M., van der Wel, A., et al. 2024, A&A, 692, A79
2024
-
[32]
P ., Cadiou, C., et al
Katz, H., Rey, M. P ., Cadiou, C., et al. 2025, arXiv e-prints, arXiv:2510.05201
2025
-
[33]
2023, The Open Journal of Astrophysics, 6, 44
Katz, H., Rosdahl, J., Kimm, T., et al. 2023, The Open Journal of Astrophysics, 6, 44
2023
-
[34]
M., Tremonti, C., et al
Kauffmann, G., Heckman, T. M., Tremonti, C., et al. 2003, MNRAS, 346, 1055
2003
-
[35]
J., Dopita, M
Kewley, L. J., Dopita, M. A., Sutherland, R. S., Heisler, C. A., & Trevena, J. 2001, ApJ, 556, 121
2001
-
[36]
J., Nicholls, D
Kewley, L. J., Nicholls, D. C., & Sutherland, R. S. 2019, ARA&A, 57, 511
2019
-
[37]
2024, A&A, 689, A13
Lauwers, A., Baes, M., Camps, P ., & Vander Meulen, B. 2024, A&A, 689, A13
2024
-
[38]
F., Y ajima, H., Zhu, Q., & Maji, M
Li, Y ., Gu, M. F., Y ajima, H., Zhu, Q., & Maji, M. 2020, MNRAS, 494, 1919
2020
-
[39]
V ., Vogelsberger, M., Torrey, P ., & Springel, V
Marinacci, F., Sales, L. V ., Vogelsberger, M., Torrey, P ., & Springel, V . 2019, MNRAS, 489, 4233
2019
-
[40]
2023, A&A, 678, A175
Matsumoto, K., Camps, P ., Baes, M., et al. 2023, A&A, 678, A175
2023
-
[41]
H., Long, K
Matthews, J. H., Long, K. S., Knigge, C., et al. 2025, MNRAS, 536, 879
2025
-
[42]
2024, MNRAS, 535, 2889
McCallum, L., Wood, K., Benjamin, R., Krishnarao, D., & Vandenbroucke, B. 2024, MNRAS, 535, 2889
2024
-
[43]
2025, arXiv e-prints, arXiv:2510.13952
McClymont, W., Smith, A., & Tacchella, S. 2025, arXiv e-prints, arXiv:2510.13952
2025
-
[44]
2024, MNRAS, 532, 2016
McClymont, W., Tacchella, S., Smith, A., et al. 2024, MNRAS, 532, 2016
2024
-
[45]
Osterbrock, D. E. & Ferland, G. J. 2006, Astrophysics of gaseous nebulae and active galactic nuclei (University Science Books)
2006
-
[46]
2017, A&A, 601, A92
Peest, C., Camps, P ., Stalevski, M., Baes, M., & Siebenmorgen, R. 2017, A&A, 601, A92
2017
-
[47]
2018, MNRAS, 473, 4077
Pillepich, A., Springel, V ., Nelson, D., et al. 2018, MNRAS, 473, 4077
2018
-
[48]
2018, MNRAS, 479, 994
Rosdahl, J., Katz, H., Blaizot, J., et al. 2018, MNRAS, 479, 994
2018
-
[49]
2014, A&A, 561, A77
Saftly, W., Baes, M., & Camps, P . 2014, A&A, 561, A77
2014
-
[50]
2013, A&A, 554, A10
Saftly, W., Camps, P ., Baes, M., et al. 2013, A&A, 554, A10
2013
-
[51]
2025, arXiv e-prints, arXiv:2508.21126
Schaye, J., Chaikin, E., Schaller, M., et al. 2025, arXiv e-prints, arXiv:2508.21126
2025 arXiv
-
[52]
A., Bower, R
Schaye, J., Crain, R. A., Bower, R. G., et al. 2015, MNRAS, 446, 521
2015
-
[53]
E., Sanders, R
Shapley, A. E., Sanders, R. L., Topping, M. W., et al. 2025, ApJ, 980, 242
2025
-
[54]
2022, MNRAS, 517, 1
Smith, A., Kannan, R., Tacchella, S., et al. 2022, MNRAS, 517, 1
2022
-
[55]
Smith, A., Kannan, R., Tsang, B. T. H., Vogelsberger, M., & Pakmor, R. 2020, ApJ, 905, 27
2020
-
[56]
2019, MNRAS, 484, 39
Smith, A., Ma, X., Bromm, V ., et al. 2019, MNRAS, 484, 39
2019
-
[57]
2015, MNRAS, 449, 4336
Smith, A., Safranek-Shrader, C., Bromm, V ., & Milosavljević, M. 2015, MNRAS, 449, 4336
2015
-
[58]
2010, MNRAS, 401, 791
Springel, V . 2010, MNRAS, 401, 791
2010
-
[59]
Storey, P . J. & Hummer, D. G. 1995, MNRAS, 272, 41
1995
-
[60]
2018, MAPPINGS V: As- trophysical plasma modeling code, Astrophysics Source Code Library, record ascl:1807.005
Sutherland, R., Dopita, M., Binette, L., & Groves, B. 2018, MAPPINGS V: As- trophysical plasma modeling code, Astrophysics Source Code Library, record ascl:1807.005
2018
-
[61]
2022, MNRAS, 513, 2904
Tacchella, S., Smith, A., Kannan, R., et al. 2022, MNRAS, 513, 2904
2022
-
[62]
2021, A&A, 653, A34
Vandenbroucke, B., Baes, M., Camps, P ., et al. 2021, A&A, 653, A34
2021
-
[63]
& Camps, P
Vandenbroucke, B. & Camps, P . 2020, A&A, 641, A66
2020
-
[64]
& Wood, K
Vandenbroucke, B. & Wood, K. 2018, Astronomy and Computing, 23, 40 Vander Meulen, B., Camps, P ., Savić, Ð., et al. 2024, A&A, 689, A297 Vander Meulen, B., Camps, P ., Stalevski, M., & Baes, M. 2023, A&A, 674, A123
2018
-
[65]
2024, A&A, 691, A19
Venturi, G., Carniani, S., Parlanti, E., et al. 2024, A&A, 691, A19
2024
-
[66]
Verner, D. A. & Ferland, G. J. 1996, ApJS, 103, 467
1996
-
[67]
A., Ferland, G
Verner, D. A., Ferland, G. J., Korista, K. T., & Y akovlev, D. G. 1996, ApJ, 465, 487
1996
-
[68]
2017, Astronomy and Computing, 20, 16
Verstocken, S., Van De Putte, D., Camps, P ., & Baes, M. 2017, Astronomy and Computing, 20, 16
2017
-
[69]
Weingartner, J. C. & Draine, B. T. 2001, ApJS, 134, 263
2001
-
[70]
S., & Ercolano, B
Wood, K., Mathis, J. S., & Ercolano, B. 2004, MNRAS, 348, 1337 Y ajima, H., Li, Y ., Zhu, Q., & Abel, T. 2012, MNRAS, 424, 884 Article number, page 15 of 18 A&A proofs: manuscript no. aanda Appendix A: Convergence of the Milky Way simulation Figure A.1 shows the convergence be...
2004
Reviewed July 14, 2026 · model on record in the stance chip above.
Discussion (0). Sign in to comment.