REVIEW 4 major objections 5 minor 42 references
Deep Simulation-Based Inference for Inhomogeneous Bivariate Log-Gaussian Cox Processes
T0 review · 4 major / 5 minor · reviewed 2026-08-02 · deepseek-v4-flash
Pith's one-line read A two-step neural-network estimator recovers latent-field parameters of inhomogeneous bivariate log-Gaussian Cox processes, using only simulated data and no likelihood evaluations.
desk verdict A solid, honest within-subfield extension: two-step DSBI for inhomogeneous bivariate LGCPs with a new image-input class; the simulations support the interpolated claim, but the gorilla application is shakier than the paper lets on. read the letter →
The pith
A machine-rendered reading of the paper's core claim, the machinery that carries it, and where it could break.
The reading
What carries the argument
The central mechanism is the two-step deep simulation-based inference pipeline: a Poisson estimating function provides the trend, and a convolutional-plus-dense neural network maps the combined inputs to the latent-field parameters. The newly introduced spatial structure inputs — standardized residual count images on a regular grid — are the key innovation; they retain spatial arrangement that aggregated summary statistics discard, and are processed through a 2D convolutional branch. All network outputs are square-root transformed and then squared to enforce positivity of variances and ranges.
What would settle it
Simulate datasets with a known trend, then compare the network's latent-field estimates when its inputs are computed from the true intensity versus from the Poisson-fitted intensity; a substantial discrepancy would indicate that the plug-in of estimated trend parameters is the limiting factor.
Extended reading notes
Core claim
By separating first-order trend estimation from second-order latent-field estimation, the paper shows that a neural network can learn to recover the covariance parameters of a bivariate LGCP without computing the intractable likelihood. The network takes three input classes: Poisson estimates of the trend coefficients, inhomogeneous within- and cross-type L-function statistics, and standardized count images that preserve spatial layout. Across simulation studies, this approach gave the most accurate estimates of variance and range parameters in the homogeneous setting, and produced reasonably accurate, near-unbiased estimates in the inhomogeneous setting, with larger windows reducing bias an
Load-bearing premise
The first-stage Poisson estimates of the trend are treated as known when building the network's inputs, so if those estimates are biased in a finite sample the network learns from corrupted summary statistics.
Editorial extensions
If this is right
- Once trained, the network estimates all six latent-field parameters on a new point pattern almost instantly, bypassing likelihood evaluation, Markov chain Monte Carlo, or numerical quadrature.
- The two-step separation removes the need to specify broad simulation ranges for covariate coefficients, making simulation-based inference practical for inhomogeneous processes with many covariates.
- The standardized count-image inputs improve accuracy by letting the network learn directly from spatial layout, and this input class could be extended to density images, residual images, or other spatial summaries.
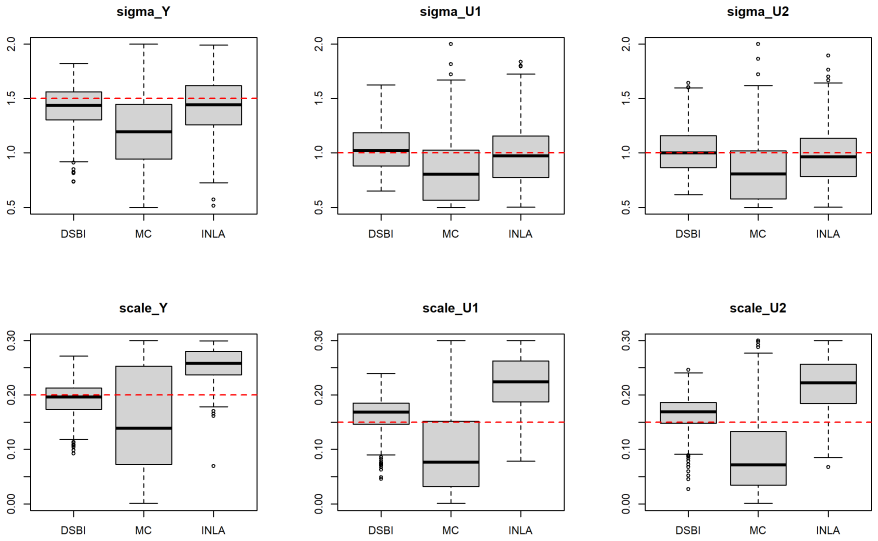
- In the homogeneous benchmark, the method had the smallest root mean squared error on the variance parameters and smaller relative errors on the scale parameters than the two compared classical alternatives.
- On the gorilla dataset, envelope tests and simulated realizations indicate that the fitted bivariate LGCP adequately captures both type-specific and cross-type spatial dependence.
Reading between the lines
- The plug-in of first-stage Poisson estimates as known inputs is a potential weak link; an iterative scheme that re-estimates the trend using the network-fitted latent fields could reduce any finite-sample bias.
- Because accuracy is demonstrated only within the predefined training ranges, the method's behaviour on out-of-range data is untested; adding an out-of-distribution warning or an uncertainty estimate would make the tool safer in practice.
- The same two-step recipe — Poisson trend plus neural network on summary and image inputs — should transfer to other intractable point-process families, such as Neyman–Scott or Gibbs processes, wherever simulation is feasible.
- The relative contributions of the three input classes are not isolated; an ablation study comparing network accuracy with and without the count images would clarify how much the new image inputs actually add.
Editorial analysis
A structured set of objections, weighed in public.
Referee Report
Summary. The paper proposes a two-step deep simulation-based inference (DSBI) procedure for inhomogeneous bivariate log-Gaussian Cox processes. In the first step, the first-order trend parameters are estimated by fitting separate inhomogeneous Poisson process models; in the second step, a neural network maps first-order estimates, inhomogeneous within- and cross-type L-functions, and newly proposed standardized count images to the six latent-field parameters (variances and scales of a shared field and two type-specific exponential-covariance fields). The method is evaluated in a homogeneous simulation study against minimum contrast estimation and INLA, in an inhomogeneous simulation study across two window sizes, and on the gorilla nest dataset, where model adequacy is checked with simulation envelopes and the DCLF test. The paper claims that the proposed approach provides accurate estimates of the latent-field parameters and is computationally efficient after training.
Significance. If the claims are substantiated, the paper offers a practically useful amortized inference tool for a challenging class of multivariate LGCPs, with potentially large computational savings after the one-off training stage. The two-step separation of first-order and second-order estimation is sensible and follows the well-established Waagepetersen-Guan framework. The introduction of image-based spatial inputs is an interesting idea that could complement classical summary statistics. The simulation effort is substantial: 100,000 training realizations and independent test sets are used, and comparisons against MC and INLA are included in the homogeneous case. However, the evidence currently supports the method only as an interpolation estimator on a correctly specified model, and the application section does not address the misspecification that the paper itself acknowledges. The absence of an ablation study for the proposed image inputs also leaves the novelty claim under-supported.
major comments (4)
- [§3.1, Table 2] The comparison with INLA is not conducted on equal terms. The text states that INLA estimates outside the DSBI training range were excluded from the comparison, while DSBI predictions are not subject to the same exclusion. If INLA tends to produce out-of-range estimates, dropping them selectively improves INLA's reported bias/RMSE, which is the opposite of the paper's conclusion; alternatively, if those estimates are poor, the proportion excluded should be reported and all estimates should be included in a sensitivity analysis. As written, the claim that 'DSBI provided the most accurate estimates overall' is not fully supported by Table 2.
- [§3.2, Table 3] The inhomogeneous simulation study evaluates the method only on test parameters drawn strictly inside the training ranges: for example, σY and σUp are tested in [1,1.5] while trained on [0.5,2], and the scale parameters are tested in [0.07,0.13] while trained on [0.001,0.2]. This is an interpolation check, not a demonstration that the estimator is accurate over the claimed operating range. Moreover, no alternative method is benchmarked in the inhomogeneous setting, so the comparative strength of DSBI is not established there. The authors should either test extrapolation outside the training ranges or clearly restrict the paper's claim to interpolation and add an inhomogeneous benchmark.
- [§4 and §5, Discussion] The gorilla application is vulnerable to first-order model misspecification. Training simulations always generate data from the same correctly specified Poisson model with all covariates included, and the network inputs S2 and S3 are computed using the fitted intensity. The paper itself notes in the Discussion that 'some relevant covariates remain unobserved' for the gorilla data. In that case the intensity surfaces used to construct the L-functions and standardized count images are systematically biased, and the network has never seen such inputs during training. The reported estimates (Table 5) and the DCLF p-values (Figure 8) therefore do not establish that the method is reliable under the misspecification present in real data. A concrete response would be a simulation study with omitted covariates or a training scheme that includes misspecified first-order models.
- [§2.2 and §5] The standardized count images S3 are presented as a new and important input class, but no ablation study shows their marginal contribution relative to S1 and S2. Since the paper repeatedly highlights S3 as one of its innovations and the Discussion admits that 'the simple convolutional network employed in this work may be insufficient,' the authors should report performance with and without S3, and ideally with alternative image representations, to justify the architectural choice and the novelty claim.
minor comments (5)
- [§2.2] The notation I12 is used for the pooled count image, not for a cross-type image. This is confusing because L12 denotes the cross-type L-function. Rename the pooled image Ipooled or I11+22.
- [Algorithm 1 and §4] Algorithm 1 says a square-root transformation is applied to θ and the outputs are squared. Section 4 then says 'we applied a square-root transformation to the response inputs,' which appears to be a typo. Please clarify that the transformation is applied to the response targets, not the inputs.
- [Table 1 and Table 3] The homogeneous table uses 'Testing value' while the inhomogeneous table uses 'Testing' as a range. For consistency, report fixed test values as distinct from sampling intervals.
- [Table 5] The gorilla estimates are reported as averages over 10 training runs with different seeds, but no variability (e.g., SD or range) is given. Since the DCLF validation uses point estimates, it would be informative to know whether the estimated parameters are stable across training runs.
- [§5] The Discussion states that the simple convolutional network 'may be insufficient ... resulting in biased predicted values in scale parameters,' but this limitation is not quantified. Please connect this remark to the observed scale-parameter biases in Tables 2 and 4.
Circularity Check
No significant circularity: the central evaluation is a supervised benchmark against known simulated parameters, the two-step framework relies on an independently authored theoretical result, and the gorilla limitations are misspecification concerns rather than constructional circularity.
full rationale
The paper's derivation chain is not circular. The main claim that DSBI provides accurate latent-field estimates is supported by Algorithm 1, which trains a neural network on 100,000 simulated bivariate LGCP realisations with known parameter targets and then evaluates on independently generated test data with fixed true parameters (Tables 1-4). This is a standard supervised-learning evaluation against an external benchmark (the true θ values), not a fitted parameter renamed as a prediction. The two-step estimation doctrine is imported from Waagepetersen (2007) and Waagepetersen and Guan (2009), an external and author-disjoint theoretical source, and is used only to justify separating first-order Poisson estimation from second-order estimation; it does not define the latent-field estimates as functions of the inputs by construction. The exponential covariance and stationarity/isotropy assumptions are stated explicitly as model choices, not smuggled in via citation. The gorilla application does use in-sample calibration of training ranges (β from ppm confidence intervals, ξ from observed interpoint distances) and in-sample DCLF/envelope validation, but this is a misspecification and overfitting risk, which the paper itself acknowledges ('some relevant covariates remain unobserved'); it does not make any estimated θ equal to an input by construction. The reported gorilla estimates could be unreliable if the first-order model is wrong, but that is a correctness concern, not circularity. No equation or algorithmic step reduces the claimed predictions to the network inputs or to a self-citation chain.
Assumptions & free parameters
free parameters (4)
- Gorilla xi training upper bounds (869.881, 869.881, 679.928) =
observed max/min interpoint distances of the pooled and type-specific gorilla patterns
- Gorilla beta sampling ranges =
95% confidence intervals of ppm() estimates on the same gorilla data
- Testing intervals in Simulation Study 2 =
sigma in [1,1.5], xi in [0.07,0.13]
- Grid discretization and L-function radius set =
50x50 grid; radius values r not stated
assumptions (4)
- domain assumption The Poisson estimating function for beta remains consistent under the bivariate LGCP, so beta-hat can be treated as known when constructing S2 and S3.
- domain assumption All three latent fields (shared Y, individual U1, U2) are stationary, isotropic, zero-mean Gaussian fields with exponential covariance.
- domain assumption The learned summary-to-parameter mapping generalizes across the training range (amortized-inference assumption).
- ad hoc to paper The standardized count images S3 carry second-order information not already contained in the L-function summaries S2.
invented entities (1)
-
Spatial structure inputs S3 = {I11, I22, I12} (standardized count images)
Cite this review
Pith. "Pith review of Deep Simulation-Based Inference for Inhomogeneous Bivariate Log-Gaussian Cox Processes." pith.science (2026). https://pith.science/paper/ZPO6CWJD
@misc{pith2026260713113,
  author       = {Pith},
  title        = {Pith review of: Deep Simulation-Based Inference for Inhomogeneous Bivariate Log-Gaussian Cox Processes},
  year         = {2026},
  howpublished = {\url{https://pith.science/paper/ZPO6CWJD}},
  note         = {Machine review of arXiv:2607.13113}
}
read the original abstract
We propose a computationally efficient simulation-based estimation method with a two-step procedure for inhomogeneous bivariate Log-Gaussian Cox Processes. It combines classical Poisson estimation for the first-order parameters with simulation-based inference using neural networks for the latent field parameters. By separating the estimations, it reduces the complexity of high dimensional parameter estimation and the need for the simulation-based method to specify broad parameter ranges in the presence of covariates. In addition, we introduce two dimensional image inputs that enable the model to learn spatial information directly. Simulation results demonstrate that the proposed approach provides accurate estimates of the latent field parameters. We further illustrate the method's practical applicability using the gorilla dataset.
Figures


Figures from the paper (8 more)


Reference graph
Works this paper leans on
-
[1]
arXiv preprint arXiv:1803.08375 , year=
Deep learning using rectified linear units (relu) , author=. arXiv preprint arXiv:1803.08375 , year=
-
[2]
1977 , publisher=
Ripley, Brian D , journal=. 1977 , publisher=
1977
-
[3]
Statistica Neerlandica , volume=
Baddeley, Adrian J and M. Statistica Neerlandica , volume=. 2000 , publisher=
2000
-
[4]
2001 , publisher=
Brix, Anders and Diggle, Peter J , journal=. 2001 , publisher=
2001
-
[5]
Spatstat: an
Baddeley, Adrian and Turner, Rolf , journal=. Spatstat: an
-
[6]
Ecological monographs , volume=
On tests of spatial pattern based on simulation envelopes , author=. Ecological monographs , volume=. 2014 , publisher=
2014
-
[7]
Spatial point patterns: methodology and applications with
Baddeley, Adrian and Rubak, Ege and Turner, Rolf , volume=. Spatial point patterns: methodology and applications with. 2016 , publisher=
2016
-
[8]
Regularized estimation for highly multivariate log
Choiruddin, Achmad and Cuevas-Pacheco, Francisco and Coeurjolly, Jean-Fran. Regularized estimation for highly multivariate log. Statistics and Computing , volume=. 2020 , publisher=
2020
Show all 42 references
-
[9]
Proceedings of the National Academy of Sciences , volume=
The frontier of simulation-based inference , author=. Proceedings of the National Academy of Sciences , volume=. 2020 , publisher=
2020
-
[10]
Journal of the Royal Statistical Society Series B: Statistical Methodology , volume=
Bivariate Cox processes: some models for bivariate spatial point patterns , author=. Journal of the Royal Statistical Society Series B: Statistical Methodology , volume=. 1983 , publisher=
1983
-
[11]
An introduction to the theory of point processes: volume
Daley, Daryl J and Vere-Jones, David , year=. An introduction to the theory of point processes: volume
-
[12]
1984 , publisher=
Diggle, Peter J and Gratton, Richard J , journal=. 1984 , publisher=
1984
-
[13]
Spatial and spatio-temporal log-
Diggle, Peter and Moraga Serrano, Paula Esther and Rowlingson, Barry and Taylor, Benjamin , journal=. Spatial and spatio-temporal log-. 2013 , publisher=
2013
-
[14]
Fast, approximate maximum likelihood estimation of log-
Dovers, Elliot and Brooks, Wesley and Popovic, Gordana C and Warton, David I , journal=. Fast, approximate maximum likelihood estimation of log-. 2023 , publisher=
2023
-
[15]
Fitting log-
Dovers, Elliot and Stoklosa, Jakub and Warton, David I , journal=. Fitting log-. 2024 , publisher=
2024
-
[16]
The integrated nested
Flagg, Kenneth and Hoegh, Andrew , journal=. The integrated nested. 2023 , publisher=
2023
-
[17]
Understanding the nesting spatial behaviour of gorillas in the
Funwi-Gabga, Neba and Mateu, Jorge , journal=. Understanding the nesting spatial behaviour of gorillas in the. 2012 , publisher=
2012
-
[18]
Journal of the American Statistical Association , volume=
A composite likelihood approach in fitting spatial point process models , author=. Journal of the American Statistical Association , volume=. 2006 , publisher=
2006
-
[19]
Journal of the American Statistical Association , volume=
Semiparametric multinomial logistic regression for multivariate point pattern data , author=. Journal of the American Statistical Association , volume=. 2022 , publisher=
2022
-
[20]
Second-order semi-parametric inference for multivariate log
Hessellund, Kristian Bj. Second-order semi-parametric inference for multivariate log. Journal of the Royal Statistical Society Series C: Applied Statistics , volume=. 2022 , publisher=
2022
-
[21]
International conference on artificial intelligence and statistics , pages=
Benchmarking simulation-based inference , author=. International conference on artificial intelligence and statistics , pages=. 2021 , organization=
2021
-
[22]
Scandinavian Journal of Statistics , volume=
Adaptive estimating function inference for nonstationary determinantal point processes , author=. Scandinavian Journal of Statistics , volume=. 2021 , publisher=
2021
-
[23]
Bayesian spatial modelling with
Lindgren, Finn and Rue, H. Bayesian spatial modelling with. Journal of statistical software , volume=
-
[24]
M. Log. Scandinavian journal of statistics , volume=. 1998 , publisher=
1998
-
[25]
Annual Review of Statistics and Its Application , volume=
Some recent developments in statistics for spatial point patterns , author=. Annual Review of Statistics and Its Application , volume=. 2017 , publisher=
2017
-
[26]
Spatial point processes and neural networks:
Mateu, Jorge and Jalilian, Abdollah , journal=. Spatial point processes and neural networks:. 2022 , publisher=
2022
-
[27]
Journal of the American Statistical Association , volume=
An efficient surrogate model for emulation and physics extraction of large eddy simulations , author=. Journal of the American Statistical Association , volume=. 2018 , publisher=
2018
-
[28]
Spatial statistics for data science: theory and practice with
Moraga, Paula , year=. Spatial statistics for data science: theory and practice with
-
[29]
Approximate
Rue, H. Approximate. Journal of the Royal Statistical Society Series B: Statistical Methodology , volume=. 2009 , publisher=
2009
-
[30]
Environmetrics , volume=
A comparison of statistical emulation methodologies for multi-wave calibration of environmental models , author=. Environmetrics , volume=. 2016 , publisher=
2016
-
[31]
Parameter estimation and model selection for
Tanaka, Ushio and Ogata, Yosihiko and Stoyan, Dietrich , journal=. Parameter estimation and model selection for. 2008 , publisher=
2008
-
[32]
lgcp: an
Taylor, Benjamin M and Davies, Tilman M and Rowlingson, Barry S and Diggle, Peter J , journal=. lgcp: an
-
[33]
Bayesian computation for
Teng, Ming and Nathoo, Farouk and Johnson, Timothy D , journal=. Bayesian computation for. 2017 , publisher=
2017
-
[34]
Bayesian inference and data augmentation schemes for spatial, spatiotemporal and multivariate log-
Taylor, Benjamin M and Davies, Tilman M and Rowlingson, Barry S and Diggle, Peter J , journal=. Bayesian inference and data augmentation schemes for spatial, spatiotemporal and multivariate log-
-
[35]
2014 , publisher=
Taylor, Benjamin M and Diggle, Peter J , journal=. 2014 , publisher=
2014
-
[36]
Spatial Statistics , volume=
Using neural networks to estimate parameters in spatial point process models , author=. Spatial Statistics , volume=. 2022 , publisher=
2022
-
[37]
An estimating function approach to inference for inhomogeneous
Waagepetersen, Rasmus Plenge , journal=. An estimating function approach to inference for inhomogeneous. 2007 , publisher=
2007
-
[38]
Journal of the Royal Statistical Society Series B: Statistical Methodology , volume=
Two-step estimation for inhomogeneous spatial point processes , author=. Journal of the Royal Statistical Society Series B: Statistical Methodology , volume=. 2009 , publisher=
2009
-
[39]
Analysis of multispecies point patterns by using multivariate log-
Waagepetersen, Rasmus and Guan, Yongtao and Jalilian, Abdollah and Mateu, Jorge , journal=. Analysis of multispecies point patterns by using multivariate log-. 2016 , publisher=
2016
-
[40]
Technometrics , volume=
Statistical emulation of large linear dynamic models , author=. Technometrics , volume=. 2011 , publisher=
2011
-
[41]
Annual Review of Statistics and Its Application , volume=
Neural methods for amortized inference , author=. Annual Review of Statistics and Its Application , volume=. 2025 , publisher=
2025
-
[42]
Electronic Journal of Statistics , volume=
On minimum contrast method for multivariate spatial point processes , author=. Electronic Journal of Statistics , volume=. 2025 , publisher=
2025
Reviewed August 2, 2026 · model on record in the stance chip above.
Discussion (0). Sign in to comment.