REVIEW 2 major objections 5 minor 49 references
Fine-Grained Open-Set Fault Diagnosis via Metric-Guided Time-Frequency Configuration Selection and Class-Specific Autoencoders
T0 review · 2 major / 5 minor · reviewed 2026-08-02 · deepseek-v4-flash
Pith's one-line read Fine-grained open-set fault diagnosis—separating unseen severity levels of a known fault type—is achievable with class-specific autoencoders and a Silhouette-score STFT screen, reaching H-scores of 0.9924 and 0.9509 on two bearing datasets.
desk verdict The CSAE-based severity open-set pipeline is credible and worth engaging, but the MGDC efficiency claim is overstated: the Silhouette screen behaves like a frequency-bin sweep and R=9/R=2 are hindsight, not a priori budgets. read the letter →
The pith
A machine-rendered reading of the paper's core claim, the machinery that carries it, and where it could break.
The reading
What carries the argument
The load-bearing machinery is the bank of class-specific autoencoders (CSAE)—K independent encoder-decoder pairs sharing a three-layer lightweight CNN feature extractor, trained with an error-based softmax cross-entropy so that branch k reconstructs class k best—combined with a dual-criteria anomaly rejection rule: per-class element-wise α-quantile bounds on the latent vector and a per-class α-quantile threshold on the L1 reconstruction error, with AND-to-accept logic. The preprocessing-level machinery is MGDC: candidate STFT configurations are transformed by square-root scaling and per-frequency-bin min-max normalization, flattened, and scored by the Silhouette score (using known severity l
What would settle it
Take a third rotating-machinery dataset with an STFT search grid where the exhaustive-best H-score sits at a low-Silhouette configuration (Table 4 already shows such non-monotonicity), run MGDC with R fixed, and check whether the top-R Silhouette candidates ever include the exhaustive best; if they do not, the screening claim fails. A minimal version: replace the top-9/top-2 Silhouette picks on CWRU/PU with nine/two random configurations and ask whether the achieved best H-score is statistically indistinguishable.
Extended reading notes
Core claim
The central claim is that fine-grained open-set fault severity diagnosis can be decomposed into two mechanisms that each address a known failure mode. The CSAE bank addresses the failure of global autoencoders: one autoencoder per known severity class learns a compact, class-specific manifold, and the cross-entropy over softmax-normalized negative reconstruction errors drives each branch to specialize. The dual-criteria rejection addresses the failure of scalar anomaly scores: instead of compressing the latent vector into one distance or probability, the method keeps an element-wise quantile boundary per latent dimension and combines it with a class-specific reconstruction-error threshold in
Load-bearing premise
The load-bearing premise is that the Silhouette score computed on flattened, normalized spectrograms ranks STFT configurations in the same order as the downstream open-set H-score; if that ranking is mostly a frequency-resolution artifact, the claimed efficiency of MGDC collapses to a heuristic frequency-bin sweep.
Editorial extensions
If this is right
- If the CSAE plus dual-criteria recipe is correct, a maintenance system can report both the fault type and the progression stage of a known degradation while flagging unseen stages, without collapsing to a scalar anomaly score.
- MGDC makes STFT configuration selection an anytime procedure: on CWRU the top-1 candidate gives H-score 0.9323 in 147 s and the top-9 candidate matches the exhaustive-search best 0.9948 at a 5.69x cost reduction; on PU the top-2 candidate matches the global best 0.9883 at 29.87x reduction.
- The same architecture remains competitive but not best-in-class for coarse fault-type OSFD on PU, where a distance-based baseline reaches a higher H-score; so the method's claimed advantage is specific to dense severity manifolds.
- The dual-criteria rejection concentrates most of the gain in the latent-boundary criterion: ablations show latent-boundary-only already achieves H-scores of 0.9786 (CWRU severity) and 0.9469 (PU severity), while reconstruction-error-only or AND-reject variants drop sharply.
Reading between the lines
- The Silhouette ranking in the paper's tables is nearly monotone in frequency-bin count while H-score is not (e.g., the 3-revolution row: Silhouette decreases 0.1593→0.0407 as bins drop 2048→16, but H-score peaks at 512 bins and falls at 256). This raises the possibility that MGDC is mostly sweeping frequency resolution rather than measuring true separability, and that R=9 and R=2 were chosen by lo
- A falsifying-style extension: compare Silhouette-ranked top-R against R random configurations. If random subsets of the same size find the same best H-score, the metric adds no information beyond a resolution prior.
- The element-wise latent quantile boundary is a nonparametric, coordinate-wise stand-in for distance-based out-of-distribution scores; it should transfer to other dense-manifold OOD problems, but its success here may depend on the latent dimension being deliberately small (dz=2), so scaling to higher dz needs its own study.
- The paper's limitation section says MGDC uses known labels during screening; an unlabeled variant (e.g., clustering without label supervision) is the natural next test for real deployments where clean severity labels are not available at pre-processing time.
Editorial analysis
A structured set of objections, weighed in public.
Referee Report
Summary. This paper proposes a two-stage method for fine-grained open-set fault diagnosis of rotating machinery. The first stage, Metric-Guided Data-Centric (MGDC) STFT configuration selection, ranks predefined time-frequency resolutions by the Silhouette score computed on flattened, normalized spectrograms, retains the top-R candidates, and picks the one with the highest H-score on a selection set. The second stage trains a shared lightweight CNN feature extractor and a bank of class-specific autoencoders (CSAEs); classification is by minimum reconstruction error, and rejection of unknown severities uses a conjunction of element-wise latent quantile bounds and a reconstruction-error quantile threshold. Experiments on CWRU and PU report H-scores of 0.9924 and 0.9509 for fine-grained severity diagnosis, with large margins over Global AE, OpenMax, CPL, and ARPL, and claim that MGDC identifies the exhaustive-search-best STFT configuration after validating only 9/38 or 2/39 candidates (speedups of 5.69x and 29.87x).
Significance. If validated, the CSAE bank plus dual-criteria rejection is a valuable recipe for severity-level OSFD. The gains are large and consistent across datasets: e.g., CWRU severity H-score 0.9924 vs 0.8015 (Global AE) and 0.4449 (CPL); PU severity 0.9509 vs 0.8822 (CPL). The evaluation protocol is careful: disjoint 0.6/0.1/0.1/0.2 train/validation/selection/test splits, selection-set-based hyperparameter choice, ablations, a threshold-sensitivity analysis, and explicit limitations. The math in Section 3.5.1 is correct, and the class-specific vs global threshold ablation shows that class-specific calibration matters. However, the MGDC efficiency claim is not presently established: the Silhouette screen appears confounded with frequency-bin count, and R is chosen retrospectively from exhaustive-search curves. The diagnostic architecture may stand on its own, but the abstract and Section 4.7 overstate the preprocessing contribution.
major comments (2)
- [§3.3; Tables 4 and 9; Figs. 7 and 13] The central efficiency claim is not supported as a metric-guided property. In Tables 4 and 9, Silhouette decreases almost monotonically with frequency-bin count within every signal length (CWRU 3-rev: 0.1593 at 2048 bins down to 0.0407 at 16 bins), whereas H-score is non-monotone (0.8615, 0.9844, 0.9948, 0.6943, ...). On CWRU the best configuration (3 rev, 512 bins, 16 steps) is ranked 9th by Silhouette only because eight 2048/1024-bin candidates precede it; on PU the best configuration is a 2048-bin candidate ranked near the top. This is exactly what a ranking by descending frequency-bin count would predict, so the Silhouette computation may add no information beyond a frequency-resolution heuristic. The paper should include a control baseline—e.g., ranking by bin count alone or a random ranking—and show that Silhouette tracks H-score better than such a baseline. Without that, the phras
- [§3.3, §4.5.2, §4.6.2, Table 12] R is a free parameter chosen after seeing the exhaustive-search curves. Section 3.3 says candidates are sorted and the top R retained, but gives no rule for choosing R; Figs. 7 and 13 then report that the cumulative-best H-score reaches the global best at R=9 (CWRU) and R=2 (PU). These R values are therefore read off the ground-truth curves, not produced by MGDC under a pre-specified budget. The speedup factors in Table 12 and the abstract ('evaluating only 9 of 38 ... 2 of 39 ... reducing selection cost by factors of 5.69 and 29.87') are retrospective. To support the claim, the authors should either fix R (or a validation budget) in advance and report the resulting performance, or explicitly reframe MGDC as an anytime heuristic whose reported R values are illustrative post-hoc examples.
minor comments (5)
- [§4.1, §4.3] No repeated trials or random seeds are reported. The severity-task margins are large, so the qualitative conclusions are likely robust, but standard deviations would help, especially for the PU type-level comparison (H-score 0.8698 vs CPL 0.9583).
- [§4.7, Table 12] The TPE/Hyperband/BOHB comparison lacks budget details (number of trials, early-stopping thresholds, seed handling). Without these, the 'Speedup' column is hard to interpret fairly.
- [§4.8, Fig. 19] The H-score distributions at α=0.9999 are wide across STFT configurations. Reporting the spread (or at least min/max) would strengthen the sensitivity analysis and support the conclusion that configuration quality matters.
- [§3.5.1] The union-bound false-rejection rate ≤ 2dz(1−α) is correct for population quantiles. Since thresholds are estimated from a finite training set, actual coverage may differ; the paper could note that the bound is asymptotic or conditional on the estimated thresholds.
- [§2.2] Minor notation inconsistency: 'LetS∈R^{M×B}' should be 'Let S∈...' with proper math formatting. Also, 'Section 3 addresses these three problems' is slightly abrupt; adding a short roadmap would improve readability.
Circularity Check
MGDC efficiency gain is post-hoc: R=9/R=2 are read from the exhaustive-search curves, making the 9/38 and 2/39 speedup claims reduce by construction.
-
fitted input called prediction
[Section 3.3 Eq. (5); Section 4.5.2 (Fig. 7); Section 4.6.2 (Fig. 13)]
"The Silhouette score identifies the globally best H-score of 0.9948 at R=9, whereas the Centroid Cosine Distance and Dunn index require R=10. ... For the CWRU dataset, MGDC identifies the best-performing STFT configuration by validating only the nine highest-ranked candidates, reducing the number of network-based evaluations from 38 to 9."
Eq. (5) specifies only h* = arg max over H_R; it gives no a priori stopping rule for R. The reported R=9 (CWRU) and R=2 (PU) are the ranks at which the global-best H-score first appears under the Silhouette ordering, read from the exhaustive-search cumulative curves (Figs. 7 and 13). The Silhouette metric itself is also chosen among nine metrics by comparing convergence on those same exhaustive H-scores. Thus the claim 'MGDC identifies the best configuration while evaluating only 9/38 (2/39)' is a restatement of the rank of the exhaustive best, not a prediction of MGDC; the 5.69x/29.87x speedups are retrospective and forced by the post-hoc choice of R.
full rationale
Most of the paper's derivation is self-contained: the reported H-scores are measured on held-out test splits (Section 4.1), the CSAE dual-criteria thresholds are calibrated only on training/selection samples (Algorithm 1), and the severity-wise unknown classes are genuine out-of-distribution tests. I find no self-definitional identity between the Silhouette score and the H-score, no load-bearing self-citation, and no imported uniqueness/ansatz argument. The one circular element is confined to the MGDC efficiency claim. The method as specified has no rule for choosing the reduced-set size R; the reported values R=9 and R=2 are read off the exhaustive-search curves after the fact, and the screening metric is selected using the same exhaustive H-score results. Consequently, the abstract's central efficiency claim—identifying the exhaustive best while evaluating only 9 of 38 or 2 of 39 candidates—reduces by construction to the rank of the best configuration under a post-hoc-chosen ranking. This does not invalidate the measured diagnostic H-scores or the ablation comparisons, but it makes the selection-cost claim partially circular, supporting a score of 6.
Assumptions & free parameters
free parameters (5)
- α (confidence percentile) =
0.9999
- CSAE hidden/latent dims (dh, dz) =
dh=32, dz=2
- Reduced candidate-set size R (MGDC stopping point) =
9 (CWRU), 2 (PU)
- Selected STFT configuration =
512 bins/16 time steps/3 rev (CWRU); 2048 bins/7 time steps/4 rev (PU)
- Optimizer hyperparameters =
lr 0.0001, batch 25, 10 epochs
assumptions (5)
- domain assumption An autoencoder yields magnified reconstruction error on out-of-distribution samples.
- domain assumption Silhouette score on flattened normalized spectrograms predicts downstream OSFD H-score.
- domain assumption Held-out severity classes in CWRU/PU fairly represent the unknown-class space U.
- standard math STFT resolution trade-off (Gabor uncertainty) bounds diagnostic separability.
- standard math Element-wise quantile bounds with union-bound error control are valid without an independence assumption.
Cite this review
Pith. "Pith review of Fine-Grained Open-Set Fault Diagnosis via Metric-Guided Time-Frequency Configuration Selection and Class-Specific Autoencoders." pith.science (2026). https://pith.science/paper/YIXOAPSE
@misc{pith2026260713368,
  author       = {Pith},
  title        = {Pith review of: Fine-Grained Open-Set Fault Diagnosis via Metric-Guided Time-Frequency Configuration Selection and Class-Specific Autoencoders},
  year         = {2026},
  howpublished = {\url{https://pith.science/paper/YIXOAPSE}},
  note         = {Machine review of arXiv:2607.13368}
}
read the original abstract
Reliable fault diagnosis of rotating machinery is essential for the safe and stable operation of industrial systems. Although deep learning methods perform well under closed-set conditions, real machinery may encounter previously unseen fault states. Existing open-set fault diagnosis (OSFD) methods remain limited in fine-grained severity diagnosis because they often rely on coarse type levels, heuristically selected Short-Time Fourier Transform (STFT) settings, and global class boundaries. We propose a fine-grained OSFD method that combines metric-guided data-centric (MGDC) STFT configuration selection with class-specific autoencoder (CSAE)-based anomaly rejection. MGDC screens candidate STFT configurations using the Silhouette score computed from spectrogram representations, identifying promising time-frequency representations before network training. The diagnostic model then uses a bank of CSAEs to learn compact class-specific manifolds for known degradation states. During inference, reconstruction-error-based class affinity identifies known classes, while a dual-criteria mechanism based on latent dimension-wise boundaries and class-specific reconstruction error rejects unknown samples. Experiments on the Case Western Reserve University (CWRU) and Paderborn University (PU) bearing datasets show that the proposed method achieves H-scores of 0.9924 and 0.9509 for fine-grained fault severity diagnosis. MGDC also identifies the best-performing configuration found by exhaustive search while evaluating only 9 of 38 candidates on CWRU and 2 of 39 candidates on PU, reducing the selection cost by factors of 5.69 and 29.87, respectively. These results indicate that the proposed method supports accurate open-set severity diagnosis with substantially lower configuration-selection cost.
Figures


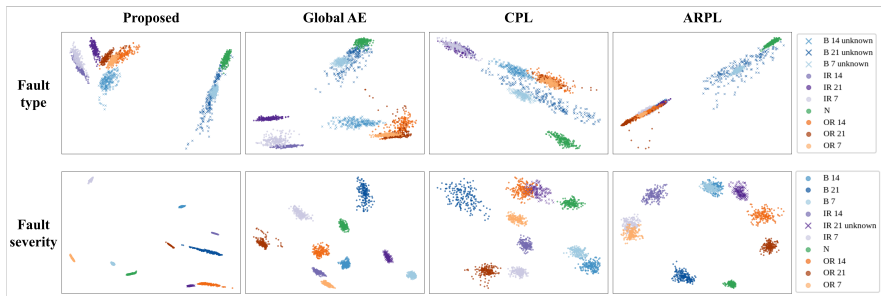
Figures from the paper (16 more)




Reference graph
Works this paper leans on
-
[1]
Applications of machine learning to machine fault diagnosis: A review and roadmap.Mechanical systems and signal processing, 138:106587, 2020
Yaguo Lei, Bin Yang, Xinwei Jiang, Feng Jia, Naipeng Li, and Asoke K Nandi. Applications of machine learning to machine fault diagnosis: A review and roadmap.Mechanical systems and signal processing, 138:106587, 2020
2020
-
[2]
Jongmin Park, Jinoh Yoo, Taehyung Kim, Minjung Kim, Jong Moon Ha, and Byeng D. Youn. Spectral kurtosis attention network (SKAN): Synergizing signal processing and deep learning for fault diagnosis of rolling element bearings.Expert Systems with Applications, 292:128581, 2025
2025
-
[3]
A transferable diagnosis method with incipient fault detection for a digital twin of wind turbine.Digital Engineering, 1:100001, 2024
Weifei Hu, Qing Jiao, Hongwei Liu, Kai Wang, Zhiyu Jiang, Jianwei Wu, Feiyun Cong, and Guangbo Hao. A transferable diagnosis method with incipient fault detection for a digital twin of wind turbine.Digital Engineering, 1:100001, 2024
2024
-
[4]
From theory to industry: A survey of deep learning-enabled bearing fault diagnosis in complex environments.Engineering Applications of Artificial Intelligence, 163:113068, 2026
Zhiqiang Bao, Changfu Liu, Hui Yang, Jiayao Zhang, and Yuqi Li. From theory to industry: A survey of deep learning-enabled bearing fault diagnosis in complex environments.Engineering Applications of Artificial Intelligence, 163:113068, 2026
2026
-
[5]
Deep learn- ing and its applications to machine health monitoring.Mechanical systems and signal processing, 115:213–237, 2019
Rui Zhao, Ruqiang Yan, Zhenghua Chen, Kezhi Mao, Peng Wang, and Robert X Gao. Deep learn- ing and its applications to machine health monitoring.Mechanical systems and signal processing, 115:213–237, 2019
2019
-
[6]
Te Han, Yan-Fu Li, and Min Qian. A hybrid generalization network for intelligent fault diagnosis of rotating machinery under unseen working conditions.IEEE Transactions on Instrumentation and Measurement, 70:1–11, 2021
2021
-
[7]
Haike Guo and Xiaoqiang Zhao. A fault diagnosis method for rotating machinery based on spline- modulated wavelet and energy topology-guided graph convolution neural network.Engineering Applications of Artificial Intelligence, 181:115566, 2026. 33
2026
-
[8]
A lightweight hybrid model-based condition monitoring method for grinding wheels using acoustic emission signals.Measurement Science and Technology, 36(1):016145, 2025
Fan Xu, Jianwei Wu, Duo Hong, Feng Zhao, Junhui Wu, Jianguo Yan, and Weifei Hu. A lightweight hybrid model-based condition monitoring method for grinding wheels using acoustic emission signals.Measurement Science and Technology, 36(1):016145, 2025
2025
Show all 49 references
-
[9]
Yang Liu, Aidong Deng, Minqiang Deng, Xue Ding, and Dongying Liu. Mitigating overconfi- dence in unknown sample predictions: A confidence-enhanced one-versus-all network for open-set transfer fault diagnosis.Knowledge-Based Systems, 310:113013, 2025
2025
-
[10]
Opensetrecognition methods for fault diagnosis: A review
AttiqUrRehman, WeidongJiao, JianfengSun, HuilinPan, andTianyuYan. Opensetrecognition methods for fault diagnosis: A review. In2023 15th International Conference on Advanced Computational Intelligence (ICACI), pages 1–8. IEEE, 2023
2023
-
[11]
Center margin loss-based uncertainty-aware fault diagnosis for rotating machines to identify unseen faults.Journal of Computational Design and Engineering, page qwag057, 2026
Hyeongmin Kim, Minseok Chae, Sang Kyung Lee, Hansoo Kim, Hye Jun Oh, Heonjun Youn, and Byeng D Youn. Center margin loss-based uncertainty-aware fault diagnosis for rotating machines to identify unseen faults.Journal of Computational Design and Engineering, page qwag057, 2026
2026
-
[12]
Te Han and Yan-Fu Li. Out-of-distribution detection-assisted trustworthy machinery fault diag- nosis approach with uncertainty-aware deep ensembles.Reliability Engineering & System Safety, 226:108648, 2022
2022
-
[13]
From coarse to fine-grained open-set recognition
Nico Lang, Vésteinn Snæbjarnarson, Elijah Cole, Oisin Mac Aodha, Christian Igel, and Serge Belongie. From coarse to fine-grained open-set recognition. InProceedings of the IEEE/CVF conference on computer vision and pattern recognition, pages 17804–17814, 2024
2024
-
[14]
Rolling element bearing diagnostics using the case western reserve university data: A benchmark study.Mechanical systems and signal processing, 64:100– 131, 2015
Wade A Smith and Robert B Randall. Rolling element bearing diagnostics using the case western reserve university data: A benchmark study.Mechanical systems and signal processing, 64:100– 131, 2015
2015
-
[15]
Towards open set deep networks
Abhijit Bendale and Terrance E Boult. Towards open set deep networks. InProceedings of the IEEE conference on computer vision and pattern recognition, pages 1563–1572, 2016
2016
-
[16]
An adaptive expansion network for incremental fault diagnosis in open and dynamic industrial systems.Engineering Applications of Artificial Intelligence, 181:115589, 2026
Zongzhen Ye, Weixiong Jiang, Xuesong He, Jixian Dong, and Jun Wu. An adaptive expansion network for incremental fault diagnosis in open and dynamic industrial systems.Engineering Applications of Artificial Intelligence, 181:115589, 2026
2026
-
[17]
Convolutional pro- totype network for open set recognition.IEEE Transactions on Pattern Analysis and Machine Intelligence, 44(5):2358–2370, 2020
Hong-Ming Yang, Xu-Yao Zhang, Fei Yin, Qing Yang, and Cheng-Lin Liu. Convolutional pro- totype network for open set recognition.IEEE Transactions on Pattern Analysis and Machine Intelligence, 44(5):2358–2370, 2020
2020
-
[18]
Adversarial reciprocal points learning for open set recognition.IEEE Transactions on Pattern Analysis and Machine Intelli- gence, 44(11):8065–8081, 2021
Guangyao Chen, Peixi Peng, Xiangqian Wang, and Yonghong Tian. Adversarial reciprocal points learning for open set recognition.IEEE Transactions on Pattern Analysis and Machine Intelli- gence, 44(11):8065–8081, 2021
2021
-
[19]
A comparative study of time–frequency representations for bearing and rotating fault diagnosis using vision transformer.Machines, 13(8):737, 2025
Ahmet Orhan, Nikolay Yordanov, Merve Ertarğın, Marin Zhilevski, and Mikho Mikhov. A comparative study of time–frequency representations for bearing and rotating fault diagnosis using vision transformer.Machines, 13(8):737, 2025
2025
-
[20]
Frequency-enhanced neural networks with a hybrid spall-size estimator for bearing fault diagnosis.Journal of Computational Design and Engineering, 12(5):1–20, 2025
Mikyung Hwang, Minseok Choi, and Hyunseok Oh. Frequency-enhanced neural networks with a hybrid spall-size estimator for bearing fault diagnosis.Journal of Computational Design and Engineering, 12(5):1–20, 2025
2025
-
[21]
Rao Fu, Yuanguo Bi, Guangjie Han, Xiaoling Zhang, Li Liu, Liang Zhao, and Bing Hu. Magva: An open-set fault diagnosis model based on multi-hop attentive graph variational autoencoder for autonomous vehicles.IEEE transactions on intelligent transportation systems, 24(12):14873–...
2023
-
[22]
An efficient adaptive window size selection method for improving spectrogram visualization.Computational intelligence and neu- roscience, 2016(1):6172453, 2016
Shibli Nisar, Omar Usman Khan, and Muhammad Tariq. An efficient adaptive window size selection method for improving spectrogram visualization.Computational intelligence and neu- roscience, 2016(1):6172453, 2016
2016
-
[23]
A fault information-guided variational mode decomposition (fivmd) method for rolling element bearings diagnosis.Mechanical Systems and Signal Processing, 164:108216, 2022
Qing Ni, JC Ji, Ke Feng, and Benjamin Halkon. A fault information-guided variational mode decomposition (fivmd) method for rolling element bearings diagnosis.Mechanical Systems and Signal Processing, 164:108216, 2022
2022
-
[24]
A motor bearing fault method using fast optimized signal decomposition-based deep learning model.Journal of Mechanical Science and Technology, 40(2):977–991, 2026
Wenqiang Gui, Yuanbo Xu, and Yu Wei. A motor bearing fault method using fast optimized signal decomposition-based deep learning model.Journal of Mechanical Science and Technology, 40(2):977–991, 2026
2026
-
[25]
Deep-learning-based open set fault diagnosis by extreme value theory.IEEE Transactions on Industrial Informatics, 18(1):185–196, 2021
Xiaolei Yu, Zhibin Zhao, Xingwu Zhang, Qiyang Zhang, Yilong Liu, Chuang Sun, and Xuefeng Chen. Deep-learning-based open set fault diagnosis by extreme value theory.IEEE Transactions on Industrial Informatics, 18(1):185–196, 2021
2021
-
[26]
Open set fault classification for rotatory machine by dnn’s neuron activation similarity score.IEEE Sensors Journal, 2025
Praveen Chopra, Himanshu Kumar, and Sandeep Yadav. Open set fault classification for rotatory machine by dnn’s neuron activation similarity score.IEEE Sensors Journal, 2025
2025
-
[27]
Deep variational autoencoder classifier for intelligent fault diagnosis adaptive to unseen fault categories.IEEE Transactions on Reliability, 70(4):1581–1595, 2021
Anqi He and Xiaoning Jin. Deep variational autoencoder classifier for intelligent fault diagnosis adaptive to unseen fault categories.IEEE Transactions on Reliability, 70(4):1581–1595, 2021
2021
-
[28]
A simple unified framework for detecting out-of-distribution samples and adversarial attacks.Advances in neural information processing systems, 31, 2018
Kimin Lee, Kibok Lee, Honglak Lee, and Jinwoo Shin. A simple unified framework for detecting out-of-distribution samples and adversarial attacks.Advances in neural information processing systems, 31, 2018
2018
-
[29]
Improving reconstruction autoencoder out-of-distribution detection with mahalanobis distance.arXiv preprint arXiv:1812.02765, 2018
Taylor Denouden, Rick Salay, Krzysztof Czarnecki, Vahdat Abdelzad, Buu Phan, and Sachin Vernekar. Improving reconstruction autoencoder out-of-distribution detection with mahalanobis distance.arXiv preprint arXiv:1812.02765, 2018
2018 arXiv
-
[30]
Gaussian latent representations for uncertainty estimation using mahalanobis distance in deep classifiers
Aishwarya Venkataramanan, Assia Benbihi, Martin Laviale, and Cédric Pradalier. Gaussian latent representations for uncertainty estimation using mahalanobis distance in deep classifiers. InProceedings of the IEEE/CVF International Conference on Computer Vision, pages 4488– 4497, 2023
2023
-
[31]
Mahalanobis++: Improving ood detection via feature normalization.arXiv preprint arXiv:2505.18032, 2025
Maximilian Mueller and Matthias Hein. Mahalanobis++: Improving ood detection via feature normalization.arXiv preprint arXiv:2505.18032, 2025
2025 arXiv
-
[32]
Open-set fault diagnosis for industrial rotating machines based on trustworthy deep learning.IEEE Transactions on Industrial Cyber-Physical Systems, 2025
Dongdong Wei, Mingjian Zuo, and Zhigang Tian. Open-set fault diagnosis for industrial rotating machines based on trustworthy deep learning.IEEE Transactions on Industrial Cyber-Physical Systems, 2025
2025
-
[33]
Implicit supervision for fault detection and segmentation of emerging fault types with deep variational autoencoders.Neurocomputing, 454:324–338, 2021
Manuel Arias Chao, Bryan T Adey, and Olga Fink. Implicit supervision for fault detection and segmentation of emerging fault types with deep variational autoencoders.Neurocomputing, 454:324–338, 2021
2021
-
[34]
Class-specific semantic recon- struction for open set recognition.IEEE transactions on pattern analysis and machine intelli- gence, 45(4):4214–4228, 2022
Hongzhi Huang, Yu Wang, Qinghua Hu, and Ming-Ming Cheng. Class-specific semantic recon- struction for open set recognition.IEEE transactions on pattern analysis and machine intelli- gence, 45(4):4214–4228, 2022
2022
-
[35]
Towards open- set fault diagnosis for reactor coolant pumps under unknown fault conditions
Jonghyeok Kim, Jeongmin Oh, Jueun Lee, Minseok Choi, and Hyunseok Oh. Towards open- set fault diagnosis for reactor coolant pumps under unknown fault conditions. InPHM Society Asia-Pacific Conference, volume 5, 2025
2025
-
[36]
Rousseeuw
Peter J. Rousseeuw. Silhouettes: A graphical aid to the interpretation and validation of cluster analysis.Journal of Computational and Applied Mathematics, 20:53–65, 1987. 35
1987
-
[37]
Devit: Decomposing vision transformers for collaborative inference in edge devices.IEEE Transactions on Mobile Computing, 23(5):5917–5932, 2023
Guanyu Xu, Zhiwei Hao, Yong Luo, Han Hu, Jianping An, and Shiwen Mao. Devit: Decomposing vision transformers for collaborative inference in edge devices.IEEE Transactions on Mobile Computing, 23(5):5917–5932, 2023
2023
-
[38]
Light-weight cnn enabled edge-based framework for machine health diagnosis.IEEE Access, 9:84375–84386, 2021
Indrani Mukherjee and Siddharth Tallur. Light-weight cnn enabled edge-based framework for machine health diagnosis.IEEE Access, 9:84375–84386, 2021
2021
-
[39]
Condition monitoring of bearing damage in electromechanical drive systems by using motor current signals of electric motors: A benchmark data set for data-driven classification
Christian Lessmeier, James Kuria Kimotho, Detmar Zimmer, and Walter Sextro. Condition monitoring of bearing damage in electromechanical drive systems by using motor current signals of electric motors: A benchmark data set for data-driven classification. InPHM society European ...
2016
-
[40]
Algorithms for hyper- parameter optimization.Advances in neural information processing systems, 24, 2011
James Bergstra, Rémi Bardenet, Yoshua Bengio, and Balázs Kégl. Algorithms for hyper- parameter optimization.Advances in neural information processing systems, 24, 2011
2011
-
[41]
Hy- perband: A novel bandit-based approach to hyperparameter optimization.Journal of Machine Learning Research, 18(185):1–52, 2018
Lisha Li, Kevin Jamieson, Giulia DeSalvo, Afshin Rostamizadeh, and Ameet Talwalkar. Hy- perband: A novel bandit-based approach to hyperparameter optimization.Journal of Machine Learning Research, 18(185):1–52, 2018
2018
-
[42]
Bohb: Robust and efficient hyperparameter optimization at scale
Stefan Falkner, Aaron Klein, and Frank Hutter. Bohb: Robust and efficient hyperparameter optimization at scale. InProceedings of the 35th International Conference on Machine Learning, pages 1437–1446, 2018
2018
-
[43]
Optuna: A next-generation hyperparameter optimization framework
Takuya Akiba, Shotaro Sano, Toshihiko Yanase, Takeru Ohta, and Masanori Koyama. Optuna: A next-generation hyperparameter optimization framework. InProceedings of the 25th ACM SIGKDD International Conference on Knowledge Discovery and Data Mining, pages 2623–2631, 2019
2019
-
[44]
Claude E. Shannon. A mathematical theory of communication.Bell System Technical Journal, 27(3):379–423, 1948
1948
-
[45]
A dendrite method for cluster analysis.Communications in Statistics, 3(1):1–27, 1974
Tadeusz Calinski and Jerzy Harabasz. A dendrite method for cluster analysis.Communications in Statistics, 3(1):1–27, 1974
1974
-
[46]
On a measure of divergence between two statistical populations defined by their probability distributions.Bulletin of the Calcutta Mathematical Society, 35:99– 109, 1943
Anil Kumar Bhattacharyya. On a measure of divergence between two statistical populations defined by their probability distributions.Bulletin of the Calcutta Mathematical Society, 35:99– 109, 1943
1943
-
[47]
Joseph C. Dunn. Well-separated clusters and optimal fuzzy partitions.Journal of Cybernetics, 4(1):95–104, 1974
1974
-
[48]
Ronald A. Fisher. The use of multiple measurements in taxonomic problems.Annals of Eugenics, 7(2):179–188, 1936
1936
-
[49]
Davies and Donald W
David L. Davies and Donald W. Bouldin. A cluster separation measure.IEEE Transactions on Pattern Analysis and Machine Intelligence, PAMI-1(2):224–227, 1979. Appendix A Detailed OSFD evaluation metrics This section details the evaluation metrics: micro F1-score, macro F1-score,...
1979
Reviewed August 2, 2026 · model on record in the stance chip above.
Discussion (0). Continue with ORCID to comment.