REVIEW 3 major objections 6 minor 41 references
Features of the distribution of absorbing matter in the local system
T0 review · 3 major / 6 minor · reviewed 2026-08-02 · deepseek-v4-flash
Pith's one-line read The Milky Way's local dust layer harbors at least three nearly parallel structures whose vertical positions oscillate with wavelengths of 2–2.5 kiloparsecs and amplitudes above 30 parsecs.
desk verdict Useful independent-map confirmation of the Kormann et al. vertical-wave detections, but the quoted 2–2.5 kpc periods are not robust because the fitted model is a chirp with degeneracies and no uncertainties. read the letter →
The pith
A machine-rendered reading of the paper's core claim, the machinery that carries it, and where it could break.
The reading
What carries the argument
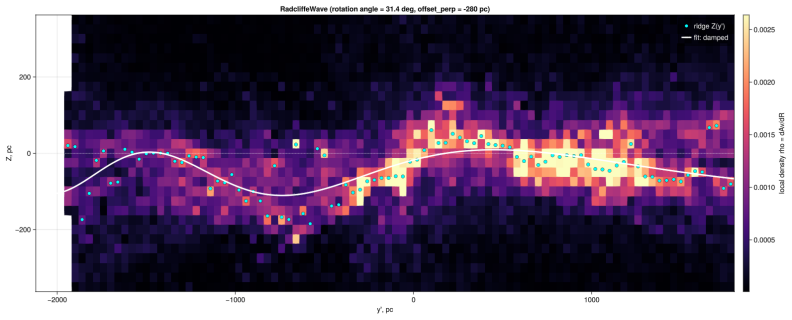
The ridge-tracing and sinusoid-fitting procedure. For each selected band, the vertical dust density profile is built in columns along the structure; the ridge position Zr(y') is found from the density maximum, refined as a density-weighted centroid in a ±60 pc window. The resulting curve is fitted to a damped sinusoid Zfit = a exp(eps_a y') sin(omega exp(eps_omega y') y' + phi) + d, or a simple sine when attenuation parameters are unstable. The wavelength and amplitude come from this fit.
What would settle it
Compute the vertical ridge of the Radcliffe Wave, Malpolon+Natrix, and Vela Ridge using a substantially different dust map or a different ridge definition (e.g., density-weighted median or full profile fitting rather than centroid), and test whether independent sinusoidal fits still yield wavelengths near 2–2.5 kpc and amplitudes above 30 pc; alternatively, measure the vertical velocities of young stars in these regions and check whether they show the periodic signature expected for such waves.
Extended reading notes
Core claim
On the paper's own terms, the central discovery is that the vertical coordinate of the dust ridge in the Radcliffe Wave, Malpolon+Natrix, and Vela Ridge regions varies periodically along each structure, with fitted wavelengths near 2.5 kpc, 2.0 kpc, and 1.8 kpc respectively and amplitudes of 60, 38, and 51 pc. These are long-wavelength, high-amplitude oscillations, in contrast to the short, small ripples found in the Split and Sagittarius Spur Extension regions. The paper presents this as confirmation of previously reported oscillations, obtained through an independent analysis of a newer dust map.
Load-bearing premise
The result assumes that each dust supercloud's vertical ridge can be represented by a single-valued curve Zr(y'), and that the fitted damped sinusoid (or sine) captures its shape; with fewer than about one and a half cycles along each band, the derived 2–2.5 kpc wavelengths depend heavily on this curve representation and on the chosen band edges and smoothing.
Editorial extensions
If this is right
- The three structures being nearly parallel and sharing similar wave parameters suggests a common physical mechanism, possibly a large-scale disturbance in the galactic disk.
- The Orion OB association's membership in the Radcliffe Wave and Scorpius-Centaurus in the Split is consistent with the Gould Belt being an asterism rather than a single evolving system.
- The Malpolon+Natrix and Vela Ridge oscillations, if real, predict measurable vertical velocity patterns in young stars and clusters within those regions.
- Future dust maps at higher resolution or with different distance estimates should reproduce the same ridgelines and periods.
Reading between the lines
- The fitted periods of 2–2.5 kpc are close to the length of the structures themselves, meaning the 'wave' may be a single half-cycle or less; a longer baseline or kinematic data is needed to distinguish a true periodic wave from a one-sided warp or tilt.
- If the oscillations share a common driver, comparing the phases and amplitudes of the three waves could locate a perturbation source or reveal a propagating wavefront.
- The paper's manual choices in defining band edges and discarding columns could be tested by automation: repeating the ridge extraction with varying band widths and smoothing scales would show whether the long periods are robust.
Editorial analysis
A structured set of objections, weighed in public.
Referee Report
Summary. This paper uses the three-dimensional extinction map of Gontcharov et al. (2025) to study the dust distribution within 2 kpc of the Sun. After projecting and Gaussian-smoothing the density field, the authors define rectangular selection bands for five supercloud structures (Radcliffe Wave, Split, Sagittarius Spur Extension, Malpolon+Natrix, Vela Ridge), extract for each column along the band the vertical position Z_r(y') of the ridge, and fit Z_r(y') with Eq. (5), a six-parameter exponentially damped sinusoid with a chirped frequency. Table 1 reports fit amplitudes of 24–60 pc and wavelengths of 0.4–2.6 kpc. The central claim is that the Radcliffe Wave, Malpolon+Natrix, and Vela Ridge exhibit coherent vertical oscillations with wavelengths of about 2–2.5 kpc and amplitudes greater than 30 pc, while Split and Sagittarius Spur Extension do not. The paper further connects the Orion OB association and the Sco-Cen OB association to the Radcliffe Wave and Split, respectively, and argues that this supports the 'asterism' interpretation of the Gould Belt over the traditional single-entity model.
Significance. If established, the result would be an important independent confirmation, on a different dust map, of Kormann et al.'s claim that the Local System contains several nearly parallel, kiloparsec-scale vertical corrugations in dust superclouds. The paper is transparent about its map projection, smoothing kernel, and selection bands, and it includes a control region (Sagittarius Spur Extension). However, the quantitative period and amplitude claims are not yet robust: the fitted model is over-parameterized for the available arc length, the quoted 'wavelength' is not the local oscillation scale when the chirp parameter is retained, and the ridge-extraction procedure contains manual steps that are not varied. These issues directly affect the central claim, so the paper requires major revision before its main quantitative conclusion can be accepted.
major comments (3)
- [Section 3, Eq. (5), Table 1] The quantity reported as 'wavelength' in Table 1 is only a parameter of the model at the origin, not a physical oscillation scale. Eq. (5) is not a sinusoid: the phase is omega exp(epsilon_omega y') y', so the local spatial frequency is omega exp(epsilon_omega y') (1 + epsilon_omega y'). With the fitted epsilon_omega for Radcliffe Wave (-0.262e-3 pc^-1) over y' in [-2100, 1800] pc, the local wavelength varies from about 0.96 kpc at the negative edge to about 7.8 kpc at the positive edge. For Malpolon+Natrix (epsilon_omega = +0.510e-3 pc^-1), the phase derivative vanishes near y' = -1960 pc, so the local period diverges near or inside the fitted band. Thus the statement in the abstract and conclusion that the three regions have wavelengths from 2.5 kpc to 2 kpc is not a property of the fitted curve except at the arbitrary origin y' = 0. The fitted bands contain fewer than about 1.5 cycles
- [Section 3, ridge extraction and selection] The ridge curve Z_r(y') is the input to the fit, but its construction involves several undocumented or arbitrary choices: the band outlines are hand-drawn (Section 4.1 and Figs. 3 and 6), the ridge is a weighted centroid over a +/-60 pc window, columns are discarded as 'uninformative', and the map is smoothed with sigma = 50, 75, 100 pc. Each of these steps can create or suppress structure on the 1-3 kpc scales claimed. No test is shown of how Z_r(y') or the fitted period changes when sigma, the window width, the number of cross-sections averaged, or the column-rejection criterion is varied. Without such sensitivity tests, the specific 2-2.5 kpc periods in Table 1 are not established. The authors should add a perturbation or bootstrap analysis over these choices and report the range of recovered periods and amplitudes.
- [Table 1 and Section 4] Table 1 lists six or four fitted parameters per structure with no uncertainties, no goodness-of-fit statistic, and no indication of which model variant was used for each row (Eq. 5 versus the simple sine). Since the central claim is that amplitudes exceed 30 pc and wavelengths are 2-2.5 kpc, error bars on A and lambda and a residual analysis are required. The Sagittarius Spur Extension fit (lambda = 412 pc) is called a control, but without uncertainties it is impossible to judge whether it is truly different from a long-wavelength fit; likewise, the Split region is dismissed with an amplitude 'less than 20 pc' but no fit or upper limit is provided. Please give parameter covariances, residual plots, and a model comparison (e.g., AIC) for the chirp versus simple-sine versions.
minor comments (6)
- [Section 1 and bibliography] The first citation of the structure-finding paper is 'Cormann et al. (2026)', but later text and the bibliography use 'Kormann et al. (2026)'. Please unify the spelling.
- [Section 1] One sentence uses 'Goncharov et al. (2025)' instead of 'Gontcharov et al. (2025)'. Please check the spelling consistently.
- [Section 4.1, Figure 5] The text refers to 'Fig. 5a' and 'Fig. 5b', but the figure caption does not label panels (a) and (b). Add panel labels.
- [Table 1] Define all symbols (epsilon_a, epsilon_omega) in the caption and state explicitly which rows used Eq. (5) and which used the simple sine form. The em-dash entries for Vela Ridge should be explained (e.g., 'not fitted' or 'unstable').
- [Keywords] The keyword 'superglobe' appears to be a typo for 'supercloud'. Please correct.
- [Figure 1] The figure is adapted from Kormann et al. (2026); if required by the journal, add a formal permission or attribution statement in the caption.
Circularity Check
Reported 2–2.5 kpc 'wavelengths' are parameters of the fitted chirp model (Eq. 5), not independently measured periods; the quantitative claim is partly constructed by the fitting function, though the structures were first identified on an independent map.
-
fitted input called prediction
[Section 3 (Eq. 5), Table 1, Abstract and Section 6]
"Then, the dependence Z_r(y′) was approximated by the function of Kormann et al. (2026) Z_fit = a exp(ε_a y′) sin{ω exp(ε_ω y′) y′ + φ} + d. ... The table shows that three regions—Radcliffe Wave, Malpolon+Natrix, and Vela Ridge—have periodic perturbations in the vertical coordinates with wavelengths ranging from 2.5 kpc (Radcliffe Wave) to 2 kpc (Malpolon+Natrix and Vela Ridge)."
The tabulated 'wavelength' λ is the fitted parameter 2π/ω of Eq. (5). But Eq. (5) is a damped chirp, not a simple sinusoid: its instantaneous angular frequency is ω exp(ε_ω y′)(1 + ε_ω y′). For the Radcliffe Wave fit (ε_ω = −0.262×10⁻³ pc⁻¹, y′ ∈ [−2100, 1800] pc), the local wavelength varies from ≈0.96 kpc to ≈7.8 kpc, so '2.5 kpc' is only the value at the arbitrary origin y′ = 0. The central quantitative conclusion is therefore a restatement of the chosen fitting function's parameter, not a measured oscillation period. Fitting the same damped-chirp ansatz would always yield some 'wavelength' even if the data did not contain a well-defined period.
full rationale
The paper's core detection of vertical corrugations in the Radcliffe Wave, Malpolon+Natrix, and Vela Ridge is not wholly circular: the structures were originally identified by Kormann et al. (2026) on the independent Edenhofer et al. (2024) map, and the present work is an additional check on the Gontcharov et al. (2025) map. The self-citation of the Gontcharov map is ordinary use of a data product and is not load-bearing for the existence of the structures themselves. However, the specific quantitative claim that the oscillations have wavelengths of 2–2.5 kpc is taken directly from Table 1's λ column, which is a parameter of Eq. (5). Because Eq. (5) contains a chirp term, λ = 2π/ω is not the actual wavelength in the data; the local period varies across each fitted band and can even diverge. Thus the headline numbers are partially determined by the fitting function rather than measured independently. This is a partial circularity of the 'fitted input called prediction' type, but it concerns the period values, not the existence of the structures, so the score is moderate rather than extreme.
Assumptions & free parameters
free parameters (6)
- radcliffe_wave_fit =
A=60 pc, λ=2581 pc, φ=0.620 rad, d=-53 pc, ε_a=5.4e-5 pc^-1, ε_ω=-2.62e-4 pc^-1
- malpolon_natrix_fit =
A=38 pc, λ=2029 pc, φ=-2.698 rad, d=83 pc, ε_a=3.65e-4 pc^-1, ε_ω=5.10e-4 pc^-1
- vela_ridge_fit =
A=51 pc, λ=1841 pc, φ=-2.250 rad, d=-40 pc
- sagittarius_spur_extension_fit =
A=24 pc, λ=412 pc, φ=0.053, d=-7 pc
- gaussian_smoothing_sigma =
50, 75, 100 pc (three variants, no single reported selection)
- ridge_fitting_window =
±60 pc
assumptions (4)
- domain assumption The Gontcharov et al. (2025) 3D extinction map has the declared accuracy (σ(A_V)~0.07-0.1, systematics <0.03) and spatial resolution needed to resolve the superclouds.
- standard math Interstellar extinction converted to local dust density by radial finite difference, with negative values set to zero (Eq. 2).
- ad hoc to paper Each supercloud ridge is a single-valued function Z_r(y') whose vertical variation is sinusoidal or damped-sinusoidal (Eq. 5).
- domain assumption The Gould Belt is best described as an asterism rather than a single evolving entity (González et al. 2026).
invented entities (1)
-
Malpolon+Natrix selection zone
Cite this review
Pith. "Pith review of Features of the distribution of absorbing matter in the local system." pith.science (2026). https://pith.science/paper/WOQ427MN
@misc{pith2026260714551,
  author       = {Pith},
  title        = {Pith review of: Features of the distribution of absorbing matter in the local system},
  year         = {2026},
  howpublished = {\url{https://pith.science/paper/WOQ427MN}},
  note         = {Machine review of arXiv:2607.14551}
}
abstract
V. I. Sorokina$^1$\footnote [99]{e-mail: vasilisushka05@gmail.com}, V. V. Bobylev$^2$, G. A. Gontcharov$^{2}$, A. T. Bajkova$^2$A detailed study of the dust distribution in the Local System was conducted. Using the latest map by Gontcharov et al., smoothed distributions of dust matter were obtained in projection onto the galactic plane $XY$ using various smoothing parameters. Within the 2-kpc radius region around the Sun under study, key structural features associated with the Radcliffe Wave, Split, Sagittarius Spur Extension, Malpolon+Natrix, and Vela Ridge superclouds are clearly identified. It was shown that the Radcliffe Wave, Malpolon+Natrix, and Vela Ridge regions exhibit periodic perturbations of vertical coordinates with wavelengths ranging from 2.5 kpc (Radcliffe Wave) to 2 kpc (Malpolon+Natrix and Vela Ridge). No similar long-wavelength, high-amplitude oscillations of vertical coordinates were detected in the Sagittarius Spur Extension and Split regions.
Figures


Figures from the paper (4 more)


Reference graph
Works this paper leans on
-
[1]
Alves, C
J. Alves, C. Zucker, A. A. Goodman, et al., Nature578, 237 (2020)
2020
-
[2]
Anders, A
F. Anders, A. Khalatyan, A. B. A. Queiroz, et al., Astron. Astrophys.658, A91 (2022)
2022
-
[3]
M. Barbillon, A. Recio-Blanco, P. de Laverny, and P. A. Palicio, arXiv: 2511.12156 (2025)
arXiv 2025
-
[4]
V. V. Bobylev, Astron. Lett.32, 816 (2006)
2006
-
[5]
V. V. Bobylev, Astrophysics57, 583 (2014)
2014
-
[6]
Bobylev, A.T
V.V. Bobylev, A.T. Bajkova, Astron. Lett.40, 783 (2014). 11
2014
-
[7]
Bobylev, A.T
V.V. Bobylev, A.T. Bajkova, and Yu.N. Mishurov, Astron. Lett.48, 434 (2022)
2022
-
[8]
Bobylev, N.R
V.V. Bobylev, N.R. Ikhsanov, A.T. Bajkova, Astron. Rep.69, 786 (2025)
2025
Show all 41 references
-
[9]
Bobylev, A.T
V.V. Bobylev, A.T. Bajkova, N.R. Ikhsanov, Astrophys. Bull.81, Issue 3 (2026)
2026
-
[10]
Prusti, J
Gaia Collaboration, T. Prusti, J. J. de Bruijne, A. G. A. Brown, et al., Astron. Astrophys. 595, 1 (2016)
2016
-
[11]
Brown, A
Gaia Collaboration, A.G.A. Brown, A. Vallenari, T. Prusti, et al., Astron. Astrophys.616, 1 (2018)
2018
-
[12]
Vallenari, A.G.A
Gaia Collaboration, A. Vallenari, A.G.A. Brown, T. Prusti, et al., Astron. Astrophys.674, 1 (2023)
2023
-
[13]
G. A. Gontcharov, Astron. Lett.35, 780 (2009)
2009
-
[14]
G. A. Gontcharov, A. V. Mosenkov, MNRAS472, 3805 (2017)
2017
-
[15]
G. A. Gontcharov, A. V. Mosenkov, MNRAS475, 1121 (2018)
2018
-
[16]
G. A. Gontcharov, A. V. Mosenkov, MNRAS483, 299 (2019)
2019
-
[17]
G. A. Gontcharov, A. V. Mosenkov, MNRAS500, 2590 (2021a)
-
[18]
G. A. Gontcharov, A. V. Mosenkov, MNRAS500, 2607 (2021b)
-
[19]
G. A. Gontcharov et al., Astron. Lett.48, 578 (2022)
2022
-
[20]
G. A. Gontcharov, A. A. Marchuk, S. S. Savchenko, et al., Res. Astron. Astrophys.25, No 12, id. 125016 (2025)
2025
-
[21]
B. A. Gould, Proc. Am. Ass. Adv. Sci.115(1874)
-
[22]
G. M. Green, E. Schlafly, C. Zucker, et al., ApJ887, 93 (2019)
2019
-
[23]
Edenhofer, C
G. Edenhofer, C. Zucker, P. Frank, et al., Astron. Astrophys.685, A82 (2024)
2024
-
[24]
Yu. N. Efremov,Star formation sites in galaxies(Moscow: Nauka, 1989
1989
-
[25]
Konietzka, A.A
R. Konietzka, A.A. Goodman, C. Zucker, et al., Nature628, 62 (2024)
2024
-
[26]
L. A. Kormann, J. Alves, M. P. Gonz´ alez, et al., Astron. Astrophys.706, A161 (2026)
2026
-
[27]
Lallement, C
R. Lallement, C. Babusiaux, J. L. Vergely, et al., Astron. Astrophys.625, A135 (2019)
2019
-
[28]
Lallement, J
R. Lallement, J. L. Vergely, C. Babusiaux, and N. L. J. Cox, Astron. Astrophys.661, A147 (2022)
2022
-
[29]
P. O. Lindblad, Astron. Astrophys.363, 154 (2000)
2000
-
[30]
Mineur, MNRAS90, 789 (1930)
H. Mineur, MNRAS90, 789 (1930)
1930
-
[31]
F.,Dynamics of stellar systems(Oxford: Pergamon, ed
Ogorodnikov K. F.,Dynamics of stellar systems(Oxford: Pergamon, ed. Beer, A. 1965)
1965
-
[32]
C. A. Olano, Astron. Astrophys.121, 295 (2001)
2001
-
[33]
Pantaleoni Gonz´ alez, J
M. Pantaleoni Gonz´ alez, J. Alves, C. Swiggum, and I. Niederbrunner, arXiv: 2604.13225 (2026). 12
2026 arXiv
-
[34]
A.Perrot, I
C. A.Perrot, I. A. Grenier, Astron. Astrophys.404, 519 (2003)
2003
-
[35]
M. F. Skrutskie, R. M. Cutri, R. Stiening, et al., Astron. J.131, 1163 (2006)
2006
-
[36]
Torra, D
J. Torra, D. Fern´ andez, and F. Figueras, Astron. Astrophys.359, 82 (2000)
2000
-
[37]
Vall´ ee, Astrophys
J. Vall´ ee, Astrophys. Space Sci.363, id. 243 (2018)
2018
-
[38]
A. V. Veselova, I. I. Nikiforov, Res. Astron. Astrophys.20, Issue 12, 209 (2020)
2020
-
[39]
Y. Xu, J. J. Li, M. J. Reid, K. M. Menten, et al., Astrophys. J.769, Issue 1, id. 15 (2013)
2013
-
[40]
Y. Xu, C. J. Hao, D. J. Liu, et al., Astrophys. J.947, Issue 2, id. 54 (2023)
2023
-
[41]
Zhang, B
L. Zhang, B. Chen, F. Qin, G. Li, H. Yuan, and Y. Ren, arXiv: 2607.06016 (2026). 13
2026 arXiv
Reviewed August 2, 2026 · model on record in the stance chip above.
Discussion (0). Sign in to comment.