REVIEW 3 major objections 4 minor 39 references
Molecule-dependent Abundance Behavior of Oxygen-bearing Complex Organics in High-Mass Star-Forming Regions: A Uniform 50-source Survey
T0 review · 3 major / 4 minor · reviewed 2026-08-01 · deepseek-v4-flash
Pith's one-line read A uniform 49-source survey finds that oxygen-bearing organic abundances in high-mass star-forming regions are molecule-dependent, not driven by a single shared pattern: methyl formate and dimethyl ether track methanol together, while acetal
desk verdict A useful, transparent 50-source survey whose central molecule-dependent claim rests on a proxy-temperature assumption the paper discloses but never stress-tests. read the letter →
The pith
A machine-rendered reading of the paper's core claim, the machinery that carries it, and where it could break.
The reading
What carries the argument
The CH3OH-normalized logarithmic abundance-ratio space (log[N(X)/N(CH3OH)]) is the central analytical device; the pairwise Pearson correlations in this space carry the argument. Column densities were derived from rotation-diagram fits under an optically thin LTE assumption, and the CH3CN rotation temperature in the same 22.4″ beam serves as a proxy excitation temperature whenever fewer than three usable transitions are available. Sgr B2 is excluded from quantitative analyses because a single-component optically thin treatment is not representative.
What would settle it
Recompute CH3CHO/CH3OH ratios for a subset of the 49 sources using direct rotation-diagram fits to acetaldehyde lines from higher-resolution, line-rich observations (e.g., ALMA); if the Pearson correlations involving CH3CHO rise substantially above 0.42 and 0.18, or the CH3OCHO–CH3OCH3 correlation drops, the molecule-dependent pattern would be largely an artifact of the CH3CN proxy assumption.
Extended reading notes
Core claim
In CH3OH-normalized abundance-ratio space, the paper finds that CH3OCHO/CH3OH and CH3OCH3/CH3OH remain tightly correlated across the sample (Pearson γ = 0.81), while correlations involving CH3CHO are much weaker (γ = 0.42 with CH3OCHO/CH3OH; γ = 0.18 with CH3OCH3/CH3OH). This is interpreted as evidence that methyl formate and dimethyl ether share a common chemical pathway linked to methanol (through methoxy-type chemistry), whereas acetaldehyde's abundance is governed by additional, more variable processes. The result is based on a homogeneous analysis of column densities derived assuming optically thin LTE, with CH3CN rotation temperatures adopted as a proxy excitation temperature for all C
Load-bearing premise
The load-bearing premise is that the CH3CN rotation temperature, measured in the same beam, is a faithful proxy for the excitation temperature of the other molecules—especially CH3CHO, whose column density was never derived from its own rotation diagram in any of the 43 detected sources.
Editorial extensions
If this is right
- If the molecule-dependent pattern is correct, chemical models of hot cores should tie methyl formate and dimethyl ether production closely to methanol-derived radicals (e.g., CH3O), while treating acetaldehyde with separate, more variable formation routes.
- The homogeneous beam-averaged abundance ratios provide a direct observational benchmark for warm-up chemical models during the post-desorption decline phase, narrowing the range of physical conditions and timescales that can reproduce the data.
- The absence of monotonic trends with Galactocentric distance or H2 column density implies that local conditions (e.g., temperature structure, radiation field, ice composition) dominate the abundance scatter, rather than global Galactic gradients.
- The comparison with previous studies indicates that methyl formate and dimethyl ether ratios are robust across different samples and telescopes, whereas acetaldehyde ratios are not, suggesting that acetaldehyde measurements are particularly sensitive to excitation assumptions and beam dilution.
- The results support the use of CH3OCHO/CH3OCH3 as a relatively stable chemical diagnostic in high-mass star-forming regions, as previously suggested, but caution against using acetaldehyde ratios as robust tracers without careful excitation corrections.
Reading between the lines
- A natural testable extension would be to measure acetaldehyde's rotation temperature directly in a subset of these sources with more line-rich data; if its own Trot is systematically lower than CH3CN's, the derived CH3CHO/CH3OH ratios would shift and could raise the Pearson correlations involving CH3CHO, weakening the claimed molecule-dependence.
- The proxy-temperature assumption might also affect the scatter of the CH3OCHO–CH3OCH3 correlation, though both molecules have many direct fits in several sources; a sensitivity analysis that re-derives all ratios under a common fixed temperature (e.g., 80 K) would show whether the γ = 0.81 correlation is an artifact of temperature assignment.
- These results could be combined with smaller-scale interferometric observations (e.g., ALMA) to test whether the molecule-dependent pattern persists at core scales where beam dilution and multiple components are less severe.
- If acetaldehyde's independent behavior is confirmed, it would strengthen the case for grain-surface formation of CH3CHO via the CH3 + HCO route being highly environment-sensitive, potentially explaining the large inter-study variation seen in the literature.
Editorial analysis
A structured set of objections, weighed in public.
Referee Report
Summary. The paper presents a uniform IRAM-30 m survey analysis of four oxygen-bearing complex organic molecules (CH3OH, CH3CHO, CH3OCHO, CH3OCH3) toward 50 high-mass star-forming regions associated with 6.7 GHz methanol masers. Column densities are derived with a homogeneous rotation-diagram method under the optically thin LTE assumption, using CH3CN as a proxy excitation temperature when fewer than three usable transitions are available. In CH3OH-normalized abundance-ratio space, the survey finds that CH3OCHO/CH3OH and CH3OCH3/CH3OH are strongly correlated (Pearson γ=0.81), whereas correlations involving CH3CHO are weaker (γ=0.42 and 0.18). No monotonic trends with Galactocentric distance or beam-averaged H2 column density are reported. The CH3OCHO–CH3OCH3 ratio is compared with literature values, and a qualitative NAUTILUS warm-up model is used to contextualize the observed abundance ranges. The paper concludes that source-to-source abundance behavior is molecule-dependent rather than described by a single common abundance pattern.
Significance. If the central correlation result is robust, the paper provides a valuable homogeneous, 49-source constraint on O-bearing COM abundance ratios in high-mass star-forming regions. The analysis is generally careful: the rotation-diagram equations (A.1–A.4) are explicit, the CH3CN proxy is clearly flagged in Table B.2, Sgr B2 is excluded for well-justified reasons, and the data products are made publicly available on Zenodo. The agreement of the CH3OCHO/CH3OCH3 ratio with Coletta et al. (2020) is a useful external benchmark. However, the paper's headline claim—molecule-dependent behavior—rests on the contrast between Pearson correlations in Figure 2, and that contrast is not yet shown to survive the dominant systematic in the data: every CH3CHO column density is proxy-temperature based, and a substantial fraction of CH3OCHO/CH3OCH3 points are proxy-based as well. The manuscript is transparent about the proxy, but it does not quantify how the proxy assumption affects the correlation coefficients. A focused sensitivity analysis is needed before the central claim can be accepted.
major comments (3)
- [§3, Fig. 2; Appendix A; Table B.2] The central 'molecule-dependent' claim rests on the contrast between γ=0.81 (CH3OCHO/CH3OH vs CH3OCH3/CH3OH) and γ=0.42/0.18 for correlations involving CH3CHO. However, every CH3CHO column density in Table B.2 is derived with a fixed CH3CN-proxy temperature (flagged ‡/†; Appendix A), never from a CH3CHO rotation diagram. If the true CH3CHO excitation differs from CH3CN by a source-dependent amount, the CH3CHO/CH3OH scatter is inflated and the two γ values involving CH3CHO are attenuated. Conversely, CH3OCHO and CH3OCH3 are both proxy-based in a substantial subset of sources (e.g., G005.88, G010.62, G011.91, G031.58, G043.16), so correlated temperature errors can inflate γ=0.81. The paper discloses the proxy but does not quantify its effect. Please add a robustness analysis: propagate Trot uncertainties into Ntot via Eq. A.3, rerun Fig. 2 using only sources with independent direct fits fo
- [§3, Fig. 2] The three Pearson coefficients are reported without confidence intervals, p-values, or tests for whether the correlations differ. With 32–43 detections, γ=0.42 is not obviously 'weak' in a statistical sense, and the difference between 0.81 and 0.42 is not tested. Report confidence intervals (e.g., bootstrap or Fisher z-transformation) and, ideally, a test that the pairwise correlations are significantly different. This is necessary to support the 'molecule-dependent' wording beyond a visual comparison of point estimates.
- [Appendix A; Table B.2] The CH3OH normalization itself is not immune to the proxy issue. In several sources CH3OH has no independent rotation-diagram fit (e.g., G012.80, G034.39, G075.76, G133.94, and G168.06 is a non-detection), so its column density is also estimated with the CH3CN proxy. Since all three abundance ratios are divided by N(CH3OH), errors in N(CH3OH) are common-mode across the ratios and can induce or inflate positive correlations. The paper should quantify the impact of CH3OH column-density uncertainties on the pairwise γ values, ideally by marginalizing over the CH3OH temperature/column-density errors in the same robustness analysis as the CH3CHO proxy concern.
minor comments (4)
- [Appendix A, Eq. A.4] The representative linewidth Δv used for 3σ upper limits is not fully defined. Please state whether Δv is FWHM or another measure, and describe how the representative line is selected when CH3CN is not detected or has no usable line.
- [§3 and Abstract] The abstract says '50-source survey,' but after excluding Sgr B2 the quantitative analysis uses 49 sources. The detection counts in §3 (50, 43, 32, 35) include Sgr B2. Please clarify the exact sample size at each stage of the analysis.
- [Fig. 4 caption] The caption describes 'black horizontal ticks and symbols' for medians/representative values, but the figure symbols are not explicitly distinguished in the caption. Please identify the exact markers used for this work's median and for literature values.
- [§3, Fig. 3] The claim of no monotonic trends with Galactocentric distance and N(H2) is based on visual inspection. A quantitative trend test, such as a Spearman rank correlation or a bootstrap regression, would make the statement more robust and less dependent on the chosen plotting scale.
Circularity Check
No circularity: observed line intensities, an external benchmark, and a qualitative model drive the central correlation claim; proxy-temperature caveats are limitations, not reductions.
full rationale
The central claim (molecule-dependent abundance behavior) is inferred from Pearson correlations of CH3OH-normalized ratios computed from column densities. Those column densities are derived from observed integrated intensities via Eqs. A.1–A.3; no parameter is fitted to the target correlations, and no equation defines the claim in terms of its own inputs. The CH3OCHO/CH3OCH3 behavior agrees with the independent Coletta et al. (2020) benchmark, and the NAUTILUS comparison is explicitly qualitative, with Tmax = 200 K 'not fitted to individual sources.' Self-citations (Xu et al. 2025 for line identification; Zhao et al. 2025 for the warm-up setup) are used for inventory and physical context, but the paper states that final rotation temperatures and column densities were 'derived independently from the rotation-diagram analysis described in Appendix A,' and the model is not used to generate the abundance-ratio correlations. The CH3CN-proxy treatment of CH3CHO column densities, flagged with ‡/† in Table B.2 and described in Appendix A, is a genuine systematic limitation that could affect the reported γ values; however, it is a measurement assumption, not a circular reduction. The claimed pattern is not forced by the proxy construction, because the proxy is an external temperature diagnostic rather than a parameter fitted to the correlation output. No load-bearing step reduces to its own inputs.
Assumptions & free parameters
free parameters (3)
- Proxy excitation temperatures (CH3CN Trot adopted as T_ex for species lacking direct fits) =
~30–140 K per source (Table B.2, ‡ entries)
- Representative linewidth Δv for 3σ upper limits =
taken from detected lines in the same spectrum (e.g., CH3CN)
- Warm-up model endpoint Tmax =
200 K
assumptions (5)
- domain assumption Target emissions are optically thin and in LTE with Trot = Tex (Eqs. A.1–A.3)
- domain assumption CH3CN rotation temperature is a valid proxy excitation temperature for O-bearing COMs in the same 22.4″ beam
- standard math JPL/CDMS line parameters (rest frequencies, A_ul, Q(T)) are accurate
- domain assumption The 6.7 GHz methanol-maser + HC3N J=12–11 > 1 K selection yields a representative HMSFR sample
- domain assumption Beam-averaged quantities across sources at different distances are comparable
Cite this review
Pith. "Pith review of Molecule-dependent Abundance Behavior of Oxygen-bearing Complex Organics in High-Mass Star-Forming Regions: A Uniform 50-source Survey." pith.science (2026). https://pith.science/paper/JK6MLMH4
@misc{pith2026260716734,
  author       = {Pith},
  title        = {Pith review of: Molecule-dependent Abundance Behavior of Oxygen-bearing Complex Organics in High-Mass Star-Forming Regions: A Uniform 50-source Survey},
  year         = {2026},
  howpublished = {\url{https://pith.science/paper/JK6MLMH4}},
  note         = {Machine review of arXiv:2607.16734}
}
abstract
We present a uniform IRAM-30\,m survey analysis of four oxygen-bearing complex organic molecules (COMs), methanol (CH$_3$OH), acetaldehyde (CH$_3$CHO), methyl formate (CH$_3$OCHO), and dimethyl ether (CH$_3$OCH$_3$), toward 50 high-mass star-forming regions (HMSFRs) associated with 6.7\,GHz methanol masers. Column densities were derived through a homogeneous rotation-diagram approach, with CH$_3$CN used as a proxy excitation-temperature reference when needed. In CH$_3$OH-normalized abundance-ratio space, CH$_3$OCHO/CH$_3$OH and CH$_3$OCH$_3$/CH$_3$OH show the strongest pairwise correlation, whereas the correlations involving CH$_3$CHO are weaker. No clear monotonic trends are found with Galactocentric distance or beam-averaged H$_2$ column density. Comparison with previous observations places the CH$_3$OCHO--CH$_3$OCH$_3$ behavior within the range of earlier abundance-ratio measurements, while CH$_3$CHO shows larger inter-study variation. A representative warm-up chemical model is used only for qualitative comparison with the observed abundance ranges, which are most closely matched during the decline from the post-desorption abundance peaks in the model. These results provide homogeneous beam-averaged abundance-ratio constraints for common O-bearing COMs in high-mass star-forming regions and show that their source-to-source behavior is molecule-dependent rather than fully described by a single common abundance pattern.
Figures
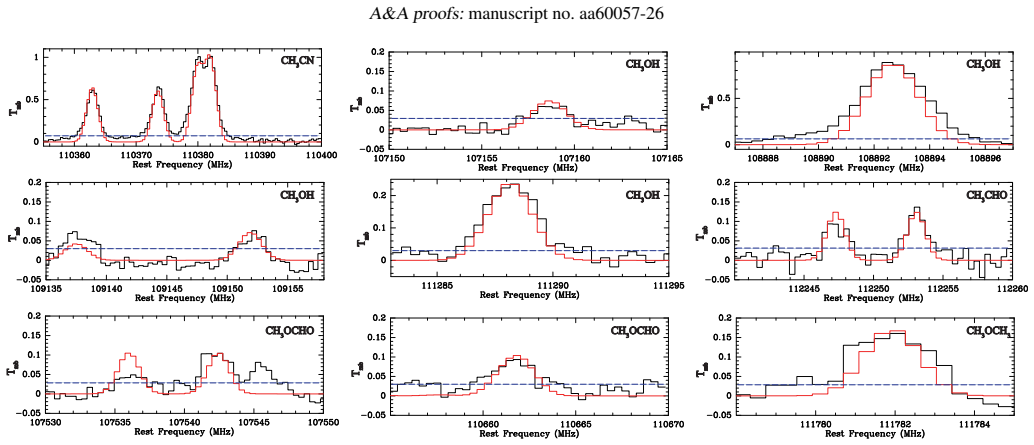


Figures from the paper (2 more)


Reference graph
Works this paper leans on
-
[1]
2005, ApJS, 157, 279
Araya, E., Hofner, P., Kurtz, S., Bronfman, L., & DeDeo, S. 2005, ApJS, 157, 279
2005
-
[2]
Belloche, A., Müller, H. S. P., Menten, K. M., Schilke, P., & Comito, C. 2013, A&A, 559, A47
2013
-
[3]
2016, ApJ, 817, L12
Bertin, M., Romanzin, C., Doronin, M., et al. 2016, ApJ, 817, L12
2016
-
[4]
E., Jørgensen, J
Bisschop, S. E., Jørgensen, J. K., van Dishoeck, E. F., & de Wachter, E. B. M. 2007, A&A, 465, 913
2007
-
[5]
2021, A&A, 648, A49
Biver, N., Bockelée-Morvan, D., Boissier, J., et al. 2021, A&A, 648, A49
2021
-
[6]
L., Ellingsen, S
Breen, S. L., Ellingsen, S. P., Contreras, Y ., et al. 2013, MNRAS, 435, 524
2013
-
[7]
2013, A&A, 550, A46
Brouillet, N., Despois, D., Baudry, A., et al. 2013, A&A, 550, A46
2013
-
[8]
Chen, Y ., Rocha, W. R. M., van Dishoeck, E. F., et al. 2024, A&A, 690, A205
2024
Show all 39 references
-
[9]
M., et al
Coletta, A., Fontani, F., Rivilla, V . M., et al. 2020, A&A, 641, A54
2020
-
[10]
2021, A&A, 655, A9
Enrique-Romero, J., Ceccarelli, C., Rimola, A., et al. 2021, A&A, 655, A9
2021
-
[11]
2016, MNRAS, 459, L6
Enrique-Romero, J., Rimola, A., Ceccarelli, C., & Balucani, N. 2016, MNRAS, 459, L6
2016
-
[12]
A., Langer, W
Frerking, M. A., Langer, W. D., & Wilson, R. W. 1982, ApJ, 262, 590
1982
-
[13]
Garrod, R. T. & Herbst, E. 2006, A&A, 457, 927
2006
-
[14]
T., Widicus Weaver, S
Garrod, R. T., Widicus Weaver, S. L., & Herbst, E. 2008, ApJ, 682, 283
2008
-
[15]
2019, A&A, 631, A142
Gieser, C., Semenov, D., Beuther, H., et al. 2019, A&A, 631, A142
2019
-
[16]
& van Dishoeck, E
Herbst, E. & van Dishoeck, E. F. 2009, ARA&A, 47, 427 Hernández-Hernández, V ., Zapata, L., Kurtz, S., & Garay, G. 2014, ApJ, 786, 38
2009
-
[17]
A., Ceccarelli, C., Kahane, C., & Caux, E
Jaber, A. A., Ceccarelli, C., Kahane, C., & Caux, E. 2014, ApJ, 791, 29 Jørgensen, J. K., Belloche, A., & Garrod, R. T. 2020, ARA&A, 58, 727 Jørgensen, J. K., Müller, H. S. P., Calcutt, H., et al. 2018, A&A, 620, A170
2014
-
[18]
2024, MNRAS, 533, 1583
Li, C., Qin, S.-L., Liu, T., et al. 2024, MNRAS, 533, 1583
2024
-
[19]
2022, MNRAS, 512, 4934
Li, Y ., Wang, J., Li, J., Liu, S., & Luo, Q. 2022, MNRAS, 512, 4934
2022
-
[20]
2019, ApJ, 885, 82
Luo, G., Feng, S., Li, D., et al. 2019, ApJ, 885, 82
2019
-
[21]
Z., Zhang, X., et al
Luo, R., Wang, J. Z., Zhang, X., et al. 2024, A&A, 691, A359
2024
-
[22]
K., Calcutt, H., et al
Manigand, S., Jørgensen, J. K., Calcutt, H., et al. 2020, A&A, 635, A48
2020
-
[23]
2011, A&A, 526, A47
Maret, S., Hily-Blant, P., Pety, J., Bardeau, S., & Reynier, E. 2011, A&A, 526, A47
2011
-
[24]
Menten, K. M. 1991, ApJ, 380, L75
1991
-
[25]
P., Norris, R
Minier, V ., Ellingsen, S. P., Norris, R. P., & Booth, R. S. 2003, A&A, 403, 1095 Müller, H. S. P., Schlöder, F., Stutzki, J., & Winnewisser, G. 2005, Journal of Molecular Structure, 742, 215 Müller, H. S. P., Thorwirth, S., Roth, D. A., & Winnewisser, G. 2001, A&A, 370, L49
2003
-
[26]
D., Charnley, S
Peeters, Z., Rodgers, S. D., Charnley, S. B., et al. 2006, A&A, 445, 197
2006
-
[27]
2022, MNRAS, 512, 4419
Peng, Y ., Liu, T., Qin, S.-L., et al. 2022, MNRAS, 512, 4419
2022
-
[28]
M., Poynter, R
Pickett, H. M., Poynter, R. L., Cohen, E. A., et al. 1998, J. Quant. Spectr. Rad. Transf., 60, 883
1998
-
[29]
J., Menten, K
Reid, M. J., Menten, K. M., Brunthaler, A., et al. 2014, ApJ, 783, 130
2014
-
[30]
J., Pesce, D
Reid, M. J., Pesce, D. W., & Riess, A. G. 2019, ApJ, 886, L27
2019
-
[31]
2016, MNRAS, 459, 3756
Ruaud, M., Wakelam, V ., & Hersant, F. 2016, MNRAS, 459, 3756
2016
-
[32]
2018, ApJ, 863, 51
Suzuki, T., Majumdar, L., Ohishi, M., et al. 2018, ApJ, 863, 51
2018
-
[33]
2014, ApJ, 795, L2
Vastel, C., Ceccarelli, C., Lefloch, B., & Bachiller, R. 2014, ApJ, 795, L2
2014
-
[34]
2024, A&A, 684, A189
Vastel, C., Sakai, T., Ceccarelli, C., et al. 2024, A&A, 684, A189
2024
-
[35]
2024, A&A, 689, A63
Wakelam, V ., Gratier, P., Loison, J.-C., et al. 2024, A&A, 689, A63
2024
-
[36]
A., Li, D., et al
Xie, J., Fuller, G. A., Li, D., et al. 2021, Science China Physics, Mechanics, and Astronomy, 64, 279511
2021
-
[37]
2025, PASJ, 77, 307
Xu, X., Wang, J., Gou, Q., et al. 2025, PASJ, 77, 307
2025
-
[38]
2021, ApJ, 910, 20
Yang, Y .-L., Sakai, N., Zhang, Y ., et al. 2021, ApJ, 910, 20
2021
-
[39]
Zhao, G., He, M., Quan, D., et al. 2025, ApJS, 277, 14 Article number, page 6 of 9 Xu et al.: Molecule-dependent Abundance Behavior of Oxygen-bearing Complex Organics in High-Mass Star-Forming Regions Appendix A: Rotation temperature and column density derivation This appendix...
2025
Reviewed August 1, 2026 · model on record in the stance chip above.
Discussion (0). Sign in to comment.