REVIEW 2 major objections 5 minor 7 references
Fast and periodic propagating disturbances along coronal loops detected with EUI on board Solar Orbiter
T0 review · 2 major / 5 minor · reviewed 2026-08-15 · deepseek-v4-flash
Pith's one-line read Solar Orbiter's high-resolution EUV images reveal a class of fast, nearly undamped intensity fronts moving at 500-2200 km/s along the upper parts of non-flaring coronal loops.
desk verdict A credible new observation of fast, weakly damped intensity fronts in HRIEUV data, but the paper has not yet bounded the line-of-sight geometry alternative that could make them apparent rather than real loop-guided disturbances. read the letter →
The pith
A machine-rendered reading of the paper's core claim, the machinery that carries it, and where it could break.
The reading
What carries the argument
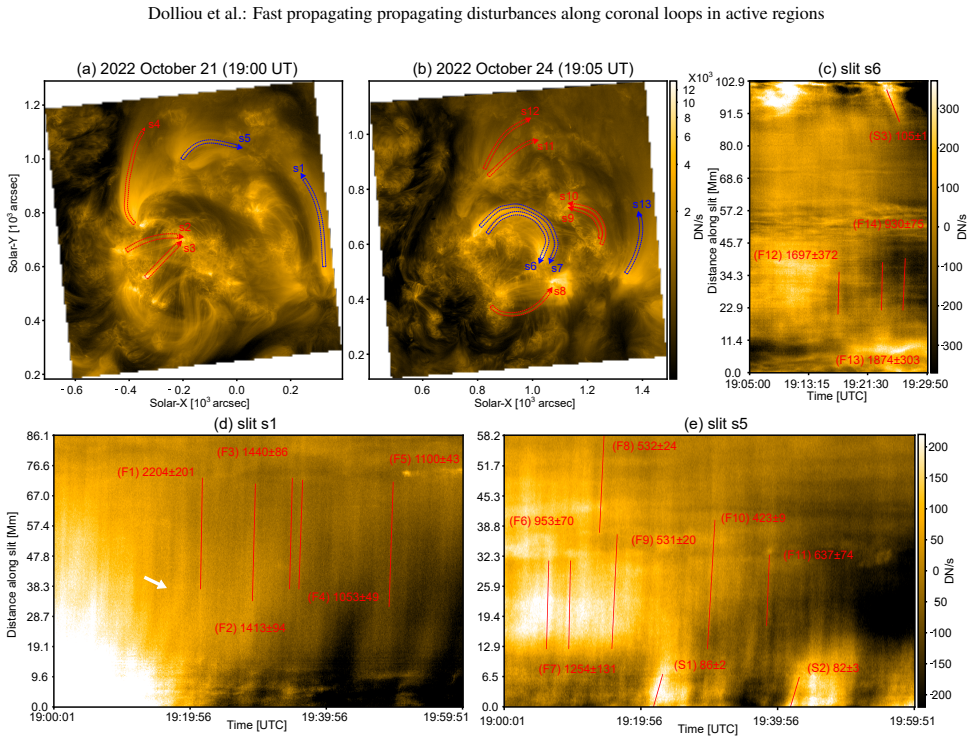
The central object is the propagating disturbance (PD): a moving intensity enhancement tracked in time-distance maps computed along narrow slits laid over loop strands. The argument is carried by three tools: Gaussian fits to peak positions give plane-of-sky velocities, background-subtracted intensity profiles along the propagation path give damping, and Fourier power with a power-law background model and 95% confidence level gives periodicity. The physical mechanism proposed to explain fast fronts is the ponderomotive force of an Alfvén wave pulse, which drives a density perturbation $\rho_2/\rho_0 = \frac{1}{2}\,\frac{\delta v^2}{v_A^2}\,\frac{1}{1-v_s^2/v_A^2}\,G^2\!\left(\frac{z-v_A t}{\sigma_z}\right)$ co-propagating at the Alfvén speed; with intensity scaling as density squared, the observed 4-8% intensity fluctuations imply mother-wave velocity amplitudes of 440-620 km/s.
What would settle it
A coordinated two-spacecraft observation of the same loop bundle from widely separated viewpoints: if the fast fronts are line-of-sight or geometric artifacts, they will show markedly different apparent speeds, directions, or visibility in the two projections; if they are real propagating structures, both projections will be consistent with a single 3D propagation vector aligned with the loop.
Extended reading notes
Core claim
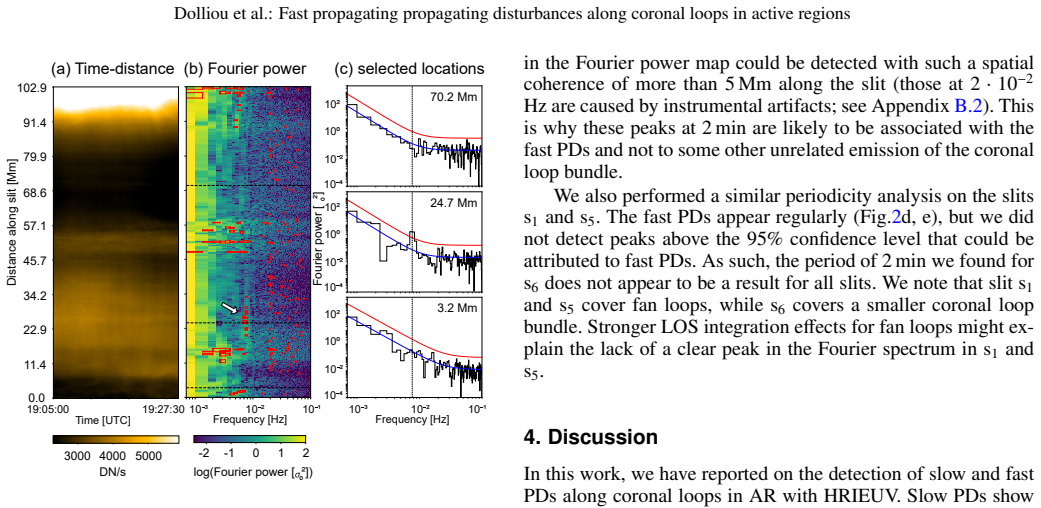
On 13 slits placed along loop strands in two EUI/HRIEUV sequences with 125-140 km pixels and 5 s cadence, the authors identify intensity peaks that move upward from one footpoint toward the loop top. Sixteen fast disturbances (F1-F16) have plane-of-sky velocities between 500 and 2200 km/s, with the fastest, F1, at 2204 km/s (uncertainty 201 km/s), resolved as a 15 s shift across 36 Mm; four slow disturbances (S1-S4) at 82-105 km/s appear only near footpoints and damp clearly, consistent with slow magneto-acoustic modes or upflows. The fast disturbances, seen only in the upper loop parts, have background-subtracted intensity profiles that stay flat with distance, except for F8, and their 4-8% intensity fluctuations relative to the strand are reproduced by a density front co-propagating with an Alfvén wave of 440-620 km/s transverse amplitude, as derived analytically and confirmed in a 1.5D ideal MHD simulation. A Fourier analysis of slit s6 shows a 2-minute peak above the 95% confidence level across a 15 Mm span where fast disturbances are best seen, and a similar fast front is detected independently in SDO/AIA 171 data, supporting the reality of the feature.
Load-bearing premise
The load-bearing assumption is that the moving intensity peaks in the time-distance maps are genuine density or emission structures propagating along the same magnetic loop, rather than apparent motions produced by the loop bundle's changing line-of-sight geometry, slit misalignment, or transverse motions.
Editorial extensions
If this is right
- Because the fronts move at Alfvénic speeds with little damping, they can serve as diagnostics of localized energy release at coronal-loop footpoints and of the plasma conditions in loop segments where no transverse oscillation is visible.
- The independent detection in AIA 171 means the decade-long AIA archive can be searched statistically, turning a single high-cadence campaign into a population study of fast propagating disturbances.
- The coexistence of slow and fast PDs along the same loops is consistent with slow-fast or fast-Alfvén mode conversion at the chromospheric equipartition layer, with the two populations serving as mother wave and converted wave, a link the paper proposes as testable.
- The estimated kinetic energy flux, ranging from tens of thousands to tens of millions of erg per square centimeter per second, barely matches active-region coronal losses at its upper end but overlaps the range needed to sustain the solar wind, motivating a search for analogous fronts on open field lines.
- The 2-minute periodicity, if intrinsic rather than geometric, ties the fronts to chromospheric drivers such as p-mode-driven shocks or granulation-related flux emergence, giving a causal chain from the lower atmosphere to the observed coronal fronts.
Reading between the lines
- A stereoscopic test the paper leaves implicit: observe the same loop bundle from two widely separated viewpoints at the same time. If the fast fronts are geometric or line-of-sight artifacts, their apparent speeds and directions will differ between viewpoints; if they are real, the two projections should triangulate to a single propagation vector along the loop.
- The single-footpoint, single-direction propagation implies that each fast front should have a co-temporal lower-atmosphere counterpart at only one footpoint of the loop, for example a small brightening or a Doppler shift; the paper places the origin low in the atmosphere but does not identify such a counterpart.
- If the 2-minute period is intrinsic to the driver, long-duration EUV sequences should show the fronts preferentially at footpoints with enhanced oscillation power or emerging magnetic flux; a superposed-epoch analysis around such footpoints would test the shock-driving and periodic-reconnection scenarios.
- Applying the same slit analysis to open-field regions above coronal holes would test whether these fronts are the lower-coronal counterparts of the small-scale solar-wind dynamics seen in the middle corona, a connection the paper raises as an interesting perspective rather than a claim.
Signed reviews
Editorial analysis
A structured set of objections, weighed in public.
Referee Report
Summary. This manuscript reports the discovery and characterization of fast propagating disturbances (PDs) along coronal loops in active regions, observed with Solar Orbiter/EUI HRIEUV at 5 s cadence and ~125 km pixels on 2022 October 21 and 24. The authors place slits along 13 loops, measure plane-of-sky velocities of 20 PDs (16 fast, 4 slow), and find fast PDs with velocities of 500–2200 km/s in the upper parts of loops, intensity increases of 4–8%, little or no damping, and an association with a 2-minute periodicity above the 95% confidence level in one slit (s6). They also report a corresponding detection in AIA 171. The discussion compares fast PDs with flows, thermal effects, fast MHD modes, and Alfvén waves with a ponderomotive-force-driven density perturbation, supported by an analytical derivation (Appendix D) and a 1.5D MHD simulation.
Significance. If these fast PDs are genuine loop-guided perturbations, the paper opens a new observational channel for studying energy transport and release in nonflaring active-region loops. The work is careful in several respects: the velocity measurements are temporally resolved (e.g., F1 is a 15 s shift over 36 Mm), the instrumental artifact checks in Appendices A and B are extensive, the detection is reproduced in AIA 171, and Appendix D provides a parameter-free analytical relation (Eq. D.6) between the Alfvén-wave amplitude and the induced density perturbation, confirmed by a numerical simulation. The 2-minute periodicity, if confirmed, would be a falsifiable prediction. However, the significance is currently moderated because the central interpretation is not yet distinguished from a geometric line-of-sight effect, which Section 4.3 itself acknowledges as a viable alternative.
major comments (2)
- [4.3 / Appendix A] Section 4.3 states that small changes in the coronal loop geometry can modify the LOS integration depth through the emitting plasma and thereby produce intensity features with apparent high phase speeds, and that slit misalignment combined with transverse motions can generate artificial propagating intensity disturbances. However, the paper does not quantify or bound this geometric channel for the specific fast PDs reported. The checks in Appendix A (slit-width scans and perpendicular cuts, Figs. A.1 and A.2) constrain in-plane transverse oscillations and slit filling, but they do not constrain out-of-plane displacements, changes in the number or overlap of emitting strands along the LOS, or the effect of a curved loop bundle's projection. For a loop that is locally close to the LOS, the apparent speed of the intensity-weighted centroid can be arbitrarily larger than the true propagation speed, and the observed 4–8% amplitude and 2-minute periodicity are compatible with periodic LOS modulation. To support the central claim that these are actual loop-guided disturbances, the authors should add a quantitative bound on the geometric contribution—for example, a stereoscopic reconstruction using the differing Solar Orbiter and SDO viewpoints on October 24, or a forward model of a time-dependent curved loop bundle showing that such apparent speeds and spatial coherence cannot be produced without a real propagating perturbation.
- [Appendix D.1] In the analytical derivation, Eq. (D.6) gives ρ2/ρ0 = (1/2)(δv/vA)^2 for vs << vA. With δI/I0 = 2 δρ/ρ0 and the observed δI/I0 of 4–8%, one obtains δv/vA = sqrt(δI/I0) = 0.20–0.28. The paper then states that for an observed propagation speed between 500 and 2200 km/s this yields mother-wave velocity amplitudes of 440–620 km/s. This is inconsistent: the correct range is δv = (0.20–0.28) × vA, i.e., 100–140 km/s for vA = 500 km/s and 440–620 km/s for vA = 2200 km/s, giving an overall range of 100–620 km/s. The quoted range of 440–620 km/s uses only the upper bound of the Alfvén speed and therefore overstates the required amplitude for the slower fast PDs. While the conclusion that large transverse amplitudes are required remains qualitatively valid, the numerical range should be corrected and the associated discussion in Section 4.2 (which relies on this range) updated accordingly.
minor comments (5)
- [Title and running header] The title says 'Fast and periodic propagating disturbances', but the 2-minute periodicity is detected above the 95% confidence level in only one slit (s6); the abstract already qualifies this, so the title could be made more precise, for example 'Fast and, in one loop bundle, periodic propagating disturbances'. The running header 'Fast propagating propagating disturbances' contains a duplicated word.
- [Appendix E] The last sentence of Appendix E contains a typo: 'sloz PD S1' should read 'slow PD S1'.
- [Section 3.3 / Appendix A] The 2-minute periodicity analysis could be strengthened by also computing the Fourier power of the background slit s6_bkg (shown in Fig. A.2a) and of a slit without fast PDs (e.g., s3 or s8) to confirm that the 2-minute peak is specific to the fast-PD region. The paper notes the absence of such peaks in s1 and s5, but the background slit provides a directly matched control for s6.
- [Section 3.2] The 4–8% intensity fluctuation is derived for slit s6 using an estimated 50% foreground/background contribution, while for other slits only the 2–4% (before LOS correction) values are given. The abstract and conclusions could make clearer that the 4–8% value is specific to s6 and stems from a rough LOS correction.
- [Section 4.2] The comparison with the ponderomotive Alfvén-wave model assumes I ~ n^2 and ignores the temperature dependence of the 174 Å emissivity. This is a reasonable first-order approximation, but it should be stated explicitly as a limitation, since the derived velocity amplitudes (Eq. D.6) depend on this assumption.
Circularity Check
No significant circularity: the fast-PD measurements are observational, and the Alfvén-wave consistency check infers wave amplitudes from measured intensities rather than predicting them from the model.
full rationale
The central results (PoS velocities, damping behavior, and the 2-minute periodicity) are direct measurements from HRIEUV/AIA time-distance maps. The velocity estimation uses Gaussian fits to locate intensity peaks and a linear fit to obtain a slope; this is standard data reduction and does not feed the model back into the measurements. The only derived-theory step is Appendix D, where Eqs. D.1-D.6 provide a parameter-free relation between the Alfvén-wave amplitude and the induced density fluctuation. The observed 4-8% intensity fluctuation is inserted into this relation to infer mother-wave velocity amplitudes of 440-620 km/s; this is an inference from the data through an independent wave-equation result, not a prediction of the observed velocity or damping from the same fitted parameters. The methodological self-citations (Dolliou et al. 2024, 2026) concern co-alignment and the Gaussian-fit measurement recipe, and the recipe is restated in the text, so no load-bearing claim rests on an unverified self-citation. Section 4.3's admission that LOS geometry can create apparent high phase speeds is a robustness limitation, not a circularity: the paper does not use that mechanism to define the quantity it then claims to explain. No step in the derivation chain reduces by construction to its own inputs.
Assumptions & free parameters
free parameters (2)
- Power-law background Fourier model parameters (A, s, C) =
Not quoted in the text; fitted per light curve in Appendix C
- Line-of-sight foreground/background contribution of about 50% for slit s6 =
≈50%
assumptions (3)
- domain assumption The HRIEUV 174 Å intensity is dominated by optically thin emission from 1 MK plasma and can be treated as a tracer of density squared (I ∝ n^2).
- domain assumption The Gaussian-peak tracking method in Appendix A of Dolliou et al. (2026) correctly measures the plane-of-sky velocity of the intensity features.
- domain assumption The Fourier background model with a power law plus constant (Appendix C) adequately represents the red-noise background of the HRIEUV light curves.
Cite this review
Pith. "Pith review of Fast and periodic propagating disturbances along coronal loops detected with EUI on board Solar Orbiter." pith.science (2026). https://pith.science/paper/ZZWBCPTA
@misc{pith2026260717821,
  author       = {Pith},
  title        = {Pith review of: Fast and periodic propagating disturbances along coronal loops detected with EUI on board Solar Orbiter},
  year         = {2026},
  howpublished = {\url{https://pith.science/paper/ZZWBCPTA}},
  note         = {Machine review of arXiv:2607.17821}
}
read the original abstract
Recent high-resolution observations from the Solar Orbiter mission can help detect the indirect signatures of heating at the smallest scales. In this work we measure the properties and investigate the physical origin of propagating disturbances (PDs) in the intensity at the smallest resolvable scales with Solar Orbiter/EUI along coronal loops. We used two sequences of EUI/HRIEUV at high spatial (down to 125 km per pixel) and temporal resolutions (5 s of cadence). We placed slits along 13 active region (AR) coronal loops. We measured the plane-of-sky (PoS) velocities and the intensity perturbation damping along the slits of PDs. We also measured the periodicity of PDs in one slit by using a Fourier analysis. We report the detection of PDs that have high PoS velocities ranging between 500 and 2000 km/s (which we call "fast" PDs). They are only visible in the upper part of the coronal loops. The intensity increase associated with these fast PDs is on the order of 4\% to 8\% of the HRIEUV intensity, and we measured little to no damping of their intensity with distance. We also measured a peak in the Fourier power spectra at 2 min above the 95\% confidence limit that is associated with fast PDs. The fast PDs are detected in the same coronal loops as PDs with a lower PoS velocity (70 to 90 kms/s), which we refer to as "slow" PDs. Unlike the fast PDs, these slow PDs are only visible in the lower part of the coronal loop, and they show clear intensity damping. Slow PDs show properties consistent with slow magneto-acoustic modes or upflows. On the other hand, fast PDs cannot be explained by slow magneto-acoustic modes. Instead, they show properties consistent with fast flows induced by magnetic reconnection, current sheet generated by propagating transverse oscillations, and fast magnetohydrodynamics modes or Alfv\'en waves.
Figures


Figures from the paper (2 more)

Reference graph
Works this paper leans on
-
[1]
2017, ApJ, 836, 219 Antolin, P
Antolin, P., De Moortel, I., Van Doorsselaere, T., & Yokoyama, T. 2017, ApJ, 836, 219 Antolin, P. & Van Doorsselaere, T. 2013, A&A, 555, A74 Antonucci, E., Dennis, B. R., Gabriel, A. H., & Simnett, G. M. 1985, Sol. Phys., 96, 129 Aschwanden, M. J. 2005, Physics of the Solar Corona. An Introduction with Problems and Solutions (2nd edition) Auchère, F., And...
arXiv 2017
-
[2]
This indicates that fast PDs are not the result of a limited slit width
The same fast PDs are detected for every slit widths. This indicates that fast PDs are not the result of a limited slit width. For the second test, we placed three slits perpendicular to the axis of s1 (Fig.A.1a) and s6 (Fig. A.2a). The time distance maps of the perpendicular cuts are shown in Fig. A.1, A.2h to j. No transverse oscillation that could move...
work page 2020
-
[5]
could not be detected with the method described in the last para- graph. This was to be expected, as transverse oscillations within the slit width are likely to diffuse the intensity associated with fast PDs over multiple sub slits. The fast PD would then be barely detectable above the background on an individual sub slit. Article number, page 10 of 17 Do...
work page 2022
-
[6]
(3) fast PDs are also detected with AIA 171 (Fig.3), which has a negligible recoding error of 0.5 DN s−1 in L1.5 FITS files. B.2. Detection of the2 minpeak in the Fourier power In section 3.3, we measured significant peaks at 2 min on the Fourier powers associated with fast PDs in slit s6. In this section, we review potential instrumental artifacts that c...
work page 2014
-
[7]
The mother Alfvén wave is shown in the right panel, which shows that the initial pertur- bation inv y is propagating to the right with the Alfvén speed. The left panel shows that the same location of the propagating mother Alfvén wave pulse also has an associated density pertur- bation, which is also co-propagating with the Alfvén speed. This numerical mo...
-
[14]
The red line indicates the location of the sub-slit where F14 is detected
(a) HRIEUV Image showing the slit s 6 split into sub-slits of 1 pixel width (blue full lines). The red line indicates the location of the sub-slit where F14 is detected. Sub-figures (b) to (e) are similar to those shown in Fig.4 (TM stands for temporal mean). The time distance maps are computed along the sub-slit indicated as a red line in (a). The averag...
work page 2017
-
[2020]
and a "fixed noise pattern" recently discovered in the data release 6.0. In our case however, the observation was set in a "tracking" mode. As such, the pointing of the satellite compensated for the Carrington rotation of the Sun. Reprojecting the images into Car- rington coordinates should then result in minimal artifacts due to fixed patterns on the det...
work page 2020
Reviewed August 15, 2026 · model on record in the stance chip above.
Discussion (0). Continue with ORCID to comment.