REVIEW 4 major objections 4 minor 57 references
Dissecting the multiple-component outflow in NGC 5548 with absorption-line Variability
T0 review · 4 major / 4 minor · reviewed 2026-08-01 · deepseek-v4-flash
Pith's one-line read This paper claims that absorption-line variability detection curves can dissect blended C IV troughs in NGC 5548 into individual recombination timescales, placing four outflow components within a few parsecs and two at 30–40 pc from the bla
desk verdict A competent application of the detection-rate method to NGC 5548 with a genuinely useful double-step decomposition, but the headline distances rest on an unvalidated amplitude-vs-delay assumption and a questionable data cut. read the letter →
The pith
A machine-rendered reading of the paper's core claim, the machinery that carries it, and where it could break.
The reading
What carries the argument
The central object is the detection-rate curve F(ΔT): pairs of spectra separated by ΔT are scored for >3σ variability in a given absorption trough, binned by ΔT, and the fraction of variable pairs is fit with a Gaussian cumulative distribution function whose mean is log₁₀(t_r). The identity that carries the argument is t_r = [–f α_CIV n_e (n_CV/n_CIV – α_CIII/α_CIV)]⁻¹, which links the recombination timescale to electron density, combined with the ionization-parameter relation U_H = Q_H/(4πR² n_H c) to convert density to radius once photoionization modeling fixes the ion ratios and the ionizing photon rate. For blended troughs, the single CDF is replaced by a sum of Gaussian CDFs; each visib
What would settle it
Simulate the 76-epoch sampling and observed continuum light curve with an instantaneous response (t_r = 0), apply the same |ΔL/L| ≥ 20% pair selection and 3σ variability threshold, and ask whether the resulting F(ΔT) rises as steeply as the observed curves; if it does, the reported recombination timescales are an artifact of the selection. Separately, re-observe NGC 5548 at ΔT > 100 days: the model predicts monotonic rise to a plateau, whereas the paper excludes such points because the curves drop.
Extended reading notes
Core claim
On its own terms, the paper establishes that the probability of detecting C IV absorption-line variability rises with the observational time interval ΔT, and that the rise can be fit by a Gaussian CDF whose mean is the log of the recombination timescale t_r. For the two troughs with blended velocity components (E and F), the detection-rate curve shows two distinct steps, and the paper models these with a two-Gaussian CDF, attributing the short steps to components 5 and 6 (t_r ≈ 4–5 days) and the long steps to components 2 and 3 (t_r ≈ 36–37 days). Combining these timescales with photoionization modeling and the adopted intrinsic SED yields: components 1 and 4 have t_r < 2.51 days with upper
Load-bearing premise
The load-bearing premise is that a rising F(ΔT) measures the absorber's recombination delay, not merely the larger continuum changes that longer-separated pairs accumulate—a distinction the paper does not control for.
Editorial extensions
If this is right
- If the radii are correct, components 2 and 3 place a large part of the C IV outflow beyond 30 pc, while components 5 and 6 lie within ~1–3 pc, so the outflow's kinetic power is distributed over a wide radial range rather than concentrated at one radius.
- The double-step detection-rate profile gives a practical route to separating blended kinematic components in other AGN where C IV doublet overlap prevents clean trough fitting.
- The measured short timescales (≈4 days) for components 5 and 6 rule out transverse cloud motion as the driver of their variability, supporting ionization-response as the mechanism.
- For components 1 and 4 the method can only give upper limits (t_r < 2.51 days), meaning this dataset's cadence is not sufficient to pin down the innermost gas; denser sampling would be needed.
- The agreement with the reliable literature distances for components 1 and 4, if real, suggests that variability-based radii can be trusted where traditional excited-state density diagnostics are unavailable.
Reading between the lines
- Editorial inference: The reliability of the method hinges on separating recombination delay from cumulative amplitude: longer intervals pair larger continuum changes, and with the paper's |ΔL/L| ≥ 20% preselection there is no control dataset showing that an instant-response gas would not produce a similar rising F(ΔT). A simulation with t_r = 0 would settle this.
- Editorial inference: The paper explicitly notes that nearly all detection-rate curves drop for ΔT > 100 days 'for unknown reasons' and excludes those points; that unexplained behaviour means the Gaussian-CDF model does not yet describe the full dataset, and new observations in that interval should be treated as a direct test rather than a nuisance.
- Editorial inference: If the method holds up, the multi-step decomposition could be applied to other reverberation-mapped AGN to build velocity–radius profiles, potentially mapping where different wind components are launched.
- Editorial inference: The factor-of-ten difference between the radii derived using the intrinsic SED versus the obscured SED highlights how much the final distances depend on the assumed ionizing continuum; pinning down the true SED is as important as the variability measurement.
Editorial analysis
A structured set of objections, weighed in public.
Referee Report
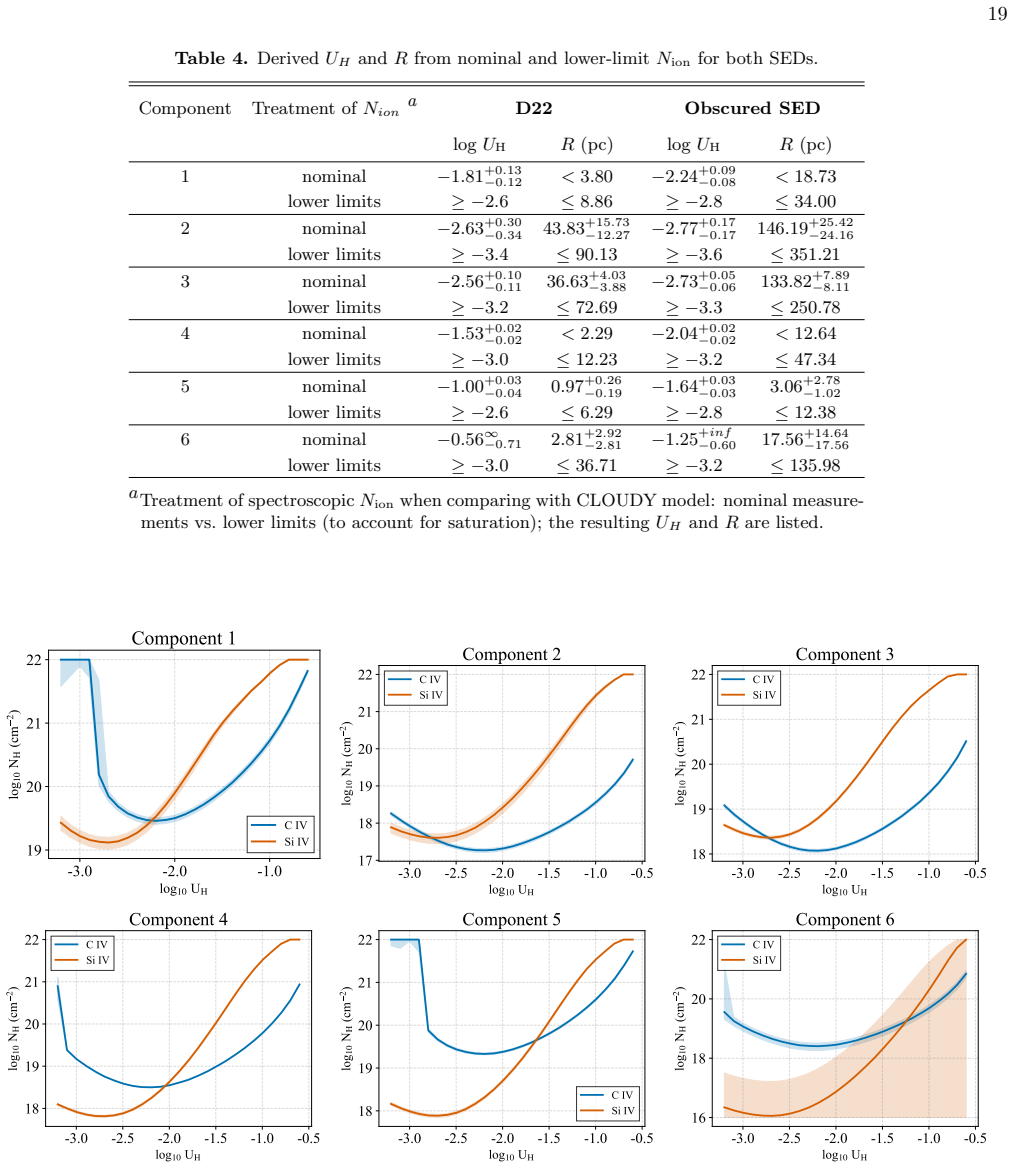
Summary. The paper measures recombination timescales (t_r) for six UV outflow components in NGC 5548 by fitting detection-rate curves of C IV absorption-line variability, using 76 HST/COS spectra from the 2014 AGN STORM campaign and 2013 archival data. It converts t_r to radial distances via Eqs. (1)–(2), reporting sub-parsec to tens-of-parsec scales: components 1 and 4 as upper limits (<3.80 pc and <2.29 pc), components 5 and 6 at 0.97 pc and 2.81 pc, and components 2 and 3 at 43.83 pc and 36.63 pc under the D22 SED. The main novelty is the use of 'double-step' detection-rate profiles in troughs E and F to separate blended components. The paper argues that the results are consistent with earlier, more reliable measurements for components 1 and 4.
Significance. If correct, this would be an important demonstration that the detection-rate curve method can separate blended velocity components in a single, well-studied AGN and provide physically interesting outflow distances from high-cadence UV spectroscopy. The paper leverages exceptional data (AGN STORM) and makes a serious attempt to compare with existing distance constraints and alternative SEDs. However, the central measurement rests on an untested statistical assumption—that the rising detection rate with ΔT reflects recombination delay rather than the amplitude of continuum changes—and on an unexplained exclusion of long-interval data. These issues must be resolved before the headline distances can be accepted.
major comments (4)
- [§3.2–§3.3, Eq. (3)] The detection model in Eq. (3) treats variability as a step function of ΔT and t_r only, but the pair sample in §3.3 is preselected with |ΔL/L|≥20%. For a stochastically varying continuum, the expected magnitude of |ΔL/L| grows with ΔT, so longer intervals will produce larger line fluctuations even if t_r=0. The pre-selection makes a rising F(ΔT) almost inevitable on amplitude grounds alone. No amplitude-matched control or t_r=0 simulation is presented. This directly affects the fitted t_r values in Table 2 for components 2, 3, 5, and 6, and therefore the headline distances. Please provide a null test: apply the same detection algorithm to simulated instantaneous-response (t_r=0) light curves with the same ΔT and amplitude distributions, or bin pairs on |ΔL/L| and show that F(ΔT) is flat within narrow amplitude bins.
- [§4.2 and Eq. (5)] The paper states: 'We exclude data points with time intervals longer than 100 days, as we find that nearly all detection rate curves drop therein for unknown reasons.' This is an explicit admission that the adopted Gaussian-CDF model (Eq. 5)—which is monotonically increasing—does not describe the full data; a decline cannot be produced by any parameter value. Excluding the failing region post hoc is a serious concern. If the drop is caused by the same amplitude/selection effect described in the previous comment, then the t_r values from Figure 3 (4.41±0.67 d and 4.83±1.28 d) and the attribution of the long steps in troughs E/F are not robust. The authors should either model the drop, demonstrate that the fitted t_r is unchanged when the >100 d points are included under an alternative selection, or provide an independent physical reason for discarding those pairs.
- [§3, Eq. (1)] Equation (1) contains f, the fractional change in the ionizing continuum, and the text adopts f=0.1 as a 'typical value' without measuring it for this dataset. Since Eq. (1) gives n_e ∝ 1/(f t_r), and Eq. (2) then gives R ∝ f^{1/2} for fixed t_r and Q_H, the distances in Table 2 inherit this assumption. The pair-selection threshold in §3.3 is |ΔL/L|≥20%, so f=0.1 appears arbitrary and potentially inconsistent with the actual continuum variations. Please quantify the sensitivity of the reported distances to f (e.g., over f=0.05–0.3), or measure f from the observed 1500 Å continuum light curve for the relevant pairs.
- [§4.3 and Figure 4] The two-Gaussian CDF decomposition of troughs E and F is load-bearing for the distances of components 2 and 3 (36–44 pc), but the paper does not show that the double-step model is statistically preferred over a single Gaussian CDF (no Δχ² or equivalent is reported). The attribution of the short step to components 5/6 and the long step to components 2/3 is plausible, but the amplitudes of the two steps are not checked against independent column-density measurements of the contributing components. Please report the fit comparison and show that the recovered long t_r values are not sensitive to the assumed attribution or to the minor contributions in trough F.
minor comments (4)
- [§1, §5.4, Eq. (7)] Typographical issues: 'photionization' in §1, 'F urthermore' in §5.4, and Eq. (7) contains redundant vertical bars in the absolute-value expression.
- [Appendix A] The Monte Carlo error propagation for R is mentioned in §4.2 but never described. Please specify how the uncertainties in U_H, n_CV/n_CIV, and t_r were sampled and whether correlations among them were included.
- [Figures 10 and 11] The figure labels use 'T =' rather than 'ΔT', and the captions do not identify which trough numbers are shown. Please make the notation consistent with the main text.
- [General] The paper does not state whether the detection algorithm and fitting code are publicly available. Given the statistical nature of the method, a code release or detailed reproducibility description would strengthen the manuscript.
Circularity Check
No internal circularity; distances are post-hoc outputs of fitted recombination timescales, but the core method is imported from the authors' own prior work.
full rationale
The central derivation chain is not circular: the recombination timescales t_r are obtained by fitting a Gaussian CDF to the observed detection-rate curves (Eq. 5), and the outflow distances are then computed from Eqs. (1) and (2) using CLOUDY-derived ionization parameters and ionic ratios. The fitted t_r values are not tuned to match literature distances; the comparison with Arav et al. (2015) and Crenshaw et al. (2003) is made after the fact in Section 5.3. The paper does rely heavily on self-citations for the detection-rate method itself (He et al. 2019, 2022; Zhao et al. 2021), but this is methodological self-reliance rather than internal circularity: the cited method is externally falsifiable and was developed on independent quasar samples, and the current paper's fitted values do not feed back into those citations. The exclusion of data points with ΔT > 100 days 'for unknown reasons' (§4.2) is a robustness/validity concern about the model's completeness, not a circular reduction of the prediction to the input. No equation is defined in terms of the distances it claims to predict, and the literature agreement is presented as an independent check rather than as a constraint used in the fit.
Assumptions & free parameters
free parameters (6)
- f (fractional ionizing continuum change in Eq. 1) =
0.1 (adopted)
- Gas temperature T =
2e4 K (assumed)
- Metallicity Z =
2 Z_sun (assumed)
- Ionizing SED / Q_H =
D22: Q_H=1.51e54 s^-1; obscured SED: Q_H=1.48e55 s^-1
- Gaussian CDF parameters (A, mu, sigma) per trough =
e.g., t_r=4.41±0.67 d for component 5; 36.06±2.23 d for component 2
- Component 5 split velocity =
-261 km/s
assumptions (6)
- domain assumption Detection probability is a step function of ΔT vs t_r, with t_r Gaussian distributed (Eqs. 3-5).
- domain assumption Absorption-line variability is dominated by ionizing continuum changes, not transverse motion or covering-factor changes.
- domain assumption CLOUDY photoionization equilibrium with the assumed SED and Z=2 Z_sun reproduces the C IV/Si IV column ratio and U_H.
- domain assumption n_H ≈ 0.83 n_e for fully ionized H+He gas.
- domain assumption The pre-anomalous-period subset (before JD 2456766.1) obeys continuum-driven variability.
- domain assumption C IV and Si IV ionic column densities are treated as lower limits in the saturation test.
Cite this review
Pith. "Pith review of Dissecting the multiple-component outflow in NGC 5548 with absorption-line Variability." pith.science (2026). https://pith.science/paper/V2EO7BMK
@misc{pith2026260721029,
  author       = {Pith},
  title        = {Pith review of: Dissecting the multiple-component outflow in NGC 5548 with absorption-line Variability},
  year         = {2026},
  howpublished = {\url{https://pith.science/paper/V2EO7BMK}},
  note         = {Machine review of arXiv:2607.21029}
}
read the original abstract
AGN-driven outflows are routinely invoked as a key agent of supermassive black holes to regulate the evolution of galaxies. The radial distance from the central engine is a crucial parameter for evaluating the impact of these outflows on the host galaxy. In this work, we estimate the radial distances of ultraviolet (UV) outflow components in NGC 5548 using the most up-to-date absorption-line variability method, combined with multi-epoch HST/COS spectroscopy from the 2014 AGN STORM campaign and archival data observed in 2013. The recombination timescale (tr) of the absorbers are measured by analyzing the detection rate curves of absorption-line variability. In particular, the detection rate curves of the absorption troughs showing blended multiple velocity components are featured by distinct ``multi-step' profiles, allowing for measuring tr for individual components. Among the 6 identified outflow components, four are found to be a few pc from the center and two are 30-40 pc away. Our results agree well with the more reliable results in the literature on components 1 and 4, and show overall consistency with previous works, demonstrating the power of our new methodology especially when it is aided by densely sampled HST spectra.
Figures


Figures from the paper (8 more)




Reference graph
Works this paper leans on
-
[1]
Aller, M. C., & Richstone, D. O. 2007, ApJ, 665, 120, doi: 10.1086/519298
doi:10.1086/519298 2007
-
[2]
T., de Kool, M., Junkkarinen, V
Arav, N., Korista, K. T., de Kool, M., Junkkarinen, V. T., & Begelman, M. C. 1999, ApJ, 516, 27, doi: 10.1086/307073
-
[3]
2018, ApJ, 857, 60, doi: 10.3847/1538-4357/aab494
Arav, N., Liu, G., Xu, X., et al. 2018, ApJ, 857, 60, doi: 10.3847/1538-4357/aab494
-
[4]
Arav, N., Gabel, J. R., Korista, K. T., et al. 2007, ApJ, 658, 829, doi: 10.1086/511666
-
[5]
2012, A&A, 544, A33, doi: 10.1051/0004-6361/201118501
Arav, N., Edmonds, D., Borguet, B., et al. 2012, A&A, 544, A33, doi: 10.1051/0004-6361/201118501
-
[6]
Arav, N., Chamberlain, C., Kriss, G. A., et al. 2015, A&A, 577, A37, doi: 10.1051/0004-6361/201425302
-
[7]
Bentz, M. C., Denney, K. D., Cackett, E. M., et al. 2007, ApJ, 662, 205, doi: 10.1086/516724
doi:10.1086/516724 2007
-
[8]
Kriss, G. A. 2012, ApJ, 751, 107, doi: 10.1088/0004-637X/751/2/107
Show all 57 references
-
[9]
G., Benson, A
Bower, R. G., Benson, A. J., Malbon, R., et al. 2006, MNRAS, 370, 645, doi: 10.1111/j.1365-2966.2006.10519.x
2006
-
[11]
S., Green, R
Brotherton, M. S., Green, R. F., Kriss, G. A., et al. 2002, ApJ, 565, 800, doi: 10.1086/324694
2002 doi
-
[12]
M., Hamann, F., & Barlow, T
Capellupo, D. M., Hamann, F., & Barlow, T. A. 2014, MNRAS, 444, 1893, doi: 10.1093/mnras/stu1502
2014 doi
-
[13]
M., Hamann, F., Shields, J
Capellupo, D. M., Hamann, F., Shields, J. C., Halpern, J. P., & Barlow, T. A. 2013, MNRAS, 429, 1872, doi: 10.1093/mnras/sts427
2013 doi
-
[14]
2016, A&A, 592, A27, doi: 10.1051/0004-6361/201628464
Cappi, M., De Marco, B., Ponti, G., et al. 2016, A&A, 592, A27, doi: 10.1051/0004-6361/201628464
2016 doi
-
[15]
2023, RMxAA, 59, 327, doi: 10.22201/ia.01851101p.2023.59.02.12
Chatzikos, M., Bianchi, S., Camilloni, F., et al. 2023, RMxAA, 59, 327, doi: 10.22201/ia.01851101p.2023.59.02.12
2023 doi
-
[16]
Moster, B. P. 2014, MNRAS, 442, 440, doi: 10.1093/mnras/stu874
2014 doi
-
[17]
M., Kraemer, S
Crenshaw, D. M., Kraemer, S. B., Schmitt, H. R., et al. 2009, ApJ, 698, 281, doi: 10.1088/0004-637X/698/1/281
2009 doi
-
[18]
M., Kraemer, S
Crenshaw, D. M., Kraemer, S. B., Gabel, J. R., et al. 2003, ApJ, 594, 116, doi: 10.1086/376792 Dalla Vecchia, C., & Schaye, J. 2012, MNRAS, 426, 140, doi: 10.1111/j.1365-2966.2012.21704.x De Rosa, G., Peterson, B. M., Ely, J., et al. 2015, ApJ, 806, 128, doi: 10.1088/0004-637X...
2003
-
[19]
Mason, H. E. 2015, A&A, 582, A56, doi: 10.1051/0004-6361/201526827 Dovˇ ciak, M., Papadakis, I. E., Kammoun, E. S., & Zhang, W. 2022, A&A, 661, A135, doi: 10.1051/0004-6361/202142358
2015 doi
-
[20]
P., Parvaresh, R., Kraemer, S
Dunn, J. P., Parvaresh, R., Kraemer, S. B., & Crenshaw, D. M. 2018, ApJ, 854, 166, doi: 10.3847/1538-4357/aaa95d
2018 doi
-
[21]
S., Kriss, G
Ebrero, J., Kaastra, J. S., Kriss, G. A., et al. 2016, A&A, 587, A129, doi: 10.1051/0004-6361/201527808
2016 doi
-
[22]
L., Mathur, S., Pogge, R
Fields, D. L., Mathur, S., Pogge, R. W., et al. 2005, ApJ, 634, 928, doi: 10.1086/497121
2005 doi
-
[23]
2014, ApJ, 780, 120, doi: 10.1088/0004-637X/780/2/120
Fukumura, K., Tombesi, F., Kazanas, D., et al. 2014, ApJ, 780, 120, doi: 10.1088/0004-637X/780/2/120
2014 doi
-
[24]
R., Korista, K
Goad, M. R., Korista, K. T., De Rosa, G., et al. 2016, ApJ, 824, 11, doi: 10.3847/0004-637X/824/1/11
2016 doi
-
[25]
R., Knigge, C., Korista, K
Goad, M. R., Knigge, C., Korista, K. T., et al. 2019, MNRAS, 486, 5362, doi: 10.1093/mnras/stz1186
2019 doi
-
[26]
B., Anderson, S
Hall, P. B., Anderson, S. F., Strauss, M. A., et al. 2002, ApJS, 141, 267, doi: 10.1086/340546
2002 doi
-
[27]
2019, MNRAS, 483, 1808, doi: 10.1093/mnras/sty2900
Hamann, F., Herbst, H., Paris, I., & Capellupo, D. 2019, MNRAS, 483, 1808, doi: 10.1093/mnras/sty2900
2019 doi
-
[28]
2017, ApJS, 229, 22, doi: 10.3847/1538-4365/aa647a
He, Z., Wang, T., Zhou, H., et al. 2017, ApJS, 229, 22, doi: 10.3847/1538-4365/aa647a
2017 doi
-
[29]
2019, Nature Astronomy, 3, 265, doi: 10.1038/s41550-018-0669-8
He, Z., Wang, T., Liu, G., et al. 2019, Nature Astronomy, 3, 265, doi: 10.1038/s41550-018-0669-8
2019 doi
-
[30]
2022, Science Advances, 8, eabk3291, doi: 10.1126/sciadv.abk3291
He, Z., Liu, G., Wang, T., et al. 2022, Science Advances, 8, eabk3291, doi: 10.1126/sciadv.abk3291
2022 doi
-
[31]
F., Hernquist, L., Cox, T
Hopkins, P. F., Hernquist, L., Cox, T. J., et al. 2006, ApJS, 163, 1, doi: 10.1086/499298
2006 doi
-
[32]
M., et al
Horne, K., De Rosa, G., Peterson, B. M., et al. 2021, ApJ, 907, 76, doi: 10.3847/1538-4357/abce60
2021 doi
- [33]
-
[34]
S., Kriss, G
Kaastra, J. S., Kriss, G. A., Cappi, M., et al. 2014, Science, 345, 64, doi: 10.1126/science.1253787
2014 doi
-
[35]
2013, A&A, 551, L6, doi: 10.1051/0004-6361/201220923 24
Kollatschny, W., & Zetzl, M. 2013, A&A, 551, L6, doi: 10.1051/0004-6361/201220923 24
2013 doi
-
[36]
B., Crenshaw, D
Kraemer, S. B., Crenshaw, D. M., Gabel, J. R., et al. 2006, ApJS, 167, 161, doi: 10.1086/508629
2006 doi
-
[37]
A., De Rosa, G., Ely, J., et al
Kriss, G. A., De Rosa, G., Ely, J., et al. 2019, ApJ, 881, 153, doi: 10.3847/1538-4357/ab3049
2019 doi
-
[38]
Ferland, G. J. 2022, MNRAS, 516, 4397, doi: 10.1093/mnras/stac2443
2022 doi
-
[39]
M., Dietrich, M., & Barber, S
Leighly, K. M., Dietrich, M., & Barber, S. 2011, ApJ, 728, 94, doi: 10.1088/0004-637X/728/2/94
2011 doi
-
[40]
T., & Dietrich, M
Richards, G. T., & Dietrich, M. 2018, ApJ, 866, 7, doi: 10.3847/1538-4357/aadee6
2018 doi
-
[41]
B., Leighly, K
Lucy, A. B., Leighly, K. M., Terndrup, D. M., Dietrich, M., & Gallagher, S. C. 2014, ApJ, 783, 58, doi: 10.1088/0004-637X/783/1/58
2014 doi
-
[42]
1969, Nature, 223, 690, doi: 10.1038/223690a0
Lynden-Bell, D. 1969, Nature, 223, 690, doi: 10.1038/223690a0
1969 doi
-
[43]
S., Mehdipour, M., et al
Mao, J., Kaastra, J. S., Mehdipour, M., et al. 2017, A&A, 607, A100, doi: 10.1051/0004-6361/201731378
2017 doi
-
[44]
1995, ApJ, 452, 230, doi: 10.1086/176294
Mathur, S., Elvis, M., & Wilkes, B. 1995, ApJ, 452, 230, doi: 10.1086/176294
1995 doi
-
[45]
G., Schaye, J., Ponman, T
McCarthy, I. G., Schaye, J., Ponman, T. J., et al. 2010, MNRAS, 406, 822, doi: 10.1111/j.1365-2966.2010.16750.x
2010
-
[46]
A., Kaastra, J
Mehdipour, M., Kriss, G. A., Kaastra, J. S., et al. 2024, ApJ, 962, 155, doi: 10.3847/1538-4357/ad1bcb
2024 doi
-
[47]
S., Kriss, G
Mehdipour, M., Kaastra, J. S., Kriss, G. A., et al. 2015, A&A, 575, A22, doi: 10.1051/0004-6361/201425373
2015 doi
-
[48]
M., Barth, A
Pei, L., Fausnaugh, M. M., Barth, A. J., et al. 2017, ApJ, 837, 131, doi: 10.3847/1538-4357/aa5eb1
2017 doi
-
[49]
Rees, M. J. 1984, ARA&A, 22, 471, doi: 10.1146/annurev.aa.22.090184.002351
1984
-
[50]
D., & Sembach, K
Savage, B. D., & Sembach, K. R. 1991, ApJ, 379, 245, doi: 10.1086/170498 Sch¨ onell, Jr., A. J., Storchi-Bergmann, T., Riffel, R. A., &
1991 doi
-
[51]
2017, MNRAS, 464, 1771, doi: 10.1093/mnras/stw2263
Riffel, R. 2017, MNRAS, 464, 1771, doi: 10.1093/mnras/stw2263
2017 doi
-
[52]
G., Doroshenko, V
Sergeev, S. G., Doroshenko, V. T., Dzyuba, S. A., et al. 2007, ApJ, 668, 708, doi: 10.1086/520697
2007 doi
-
[53]
S., Hopkins, P
Somerville, R. S., Hopkins, P. F., Cox, T. J., Robertson, B. E., & Hernquist, L. 2008, MNRAS, 391, 481, doi: 10.1111/j.1365-2966.2008.13805.x
2008
-
[54]
2005, MNRAS, 361, 776, doi: 10.1111/j.1365-2966.2005.09238.x
Springel, V., Di Matteo, T., & Hernquist, L. 2005, MNRAS, 361, 776, doi: 10.1111/j.1365-2966.2005.09238.x
2005
-
[55]
2005, ARA&A, 43, 769, doi: 10.1146/annurev.astro.43.072103.150610
Veilleux, S., Cecil, G., & Bland-Hawthorn, J. 2005, ARA&A, 43, 769, doi: 10.1146/annurev.astro.43.072103.150610
2005 arXiv
-
[56]
2015, ApJ, 814, 150, doi: 10.1088/0004-637X/814/2/150
Wang, T., Yang, C., Wang, H., & Ferland, G. 2015, ApJ, 814, 150, doi: 10.1088/0004-637X/814/2/150
2015 doi
-
[57]
R., Pancoast, A., Treu, T., et al
Williams, P. R., Pancoast, A., Treu, T., et al. 2020, ApJ, 902, 74, doi: 10.3847/1538-4357/abbad7
2020 doi
-
[58]
2021, ApJL, 906, L8, doi: 10.3847/2041-8213/abd318
Zhao, Q., He, Z., Liu, G., et al. 2021, ApJL, 906, L8, doi: 10.3847/2041-8213/abd318
2021 doi
Reviewed August 1, 2026 · model on record in the stance chip above.
Discussion (0). Sign in to comment.