REVIEW 4 major objections 4 minor 96 references
Comparative 3D Asymmetric Expansion and Angular Widths Evolution of Fast and Slow Coronal Mass Ejections
T0 review · 4 major / 4 minor · reviewed 2026-08-01 · deepseek-v4-flash
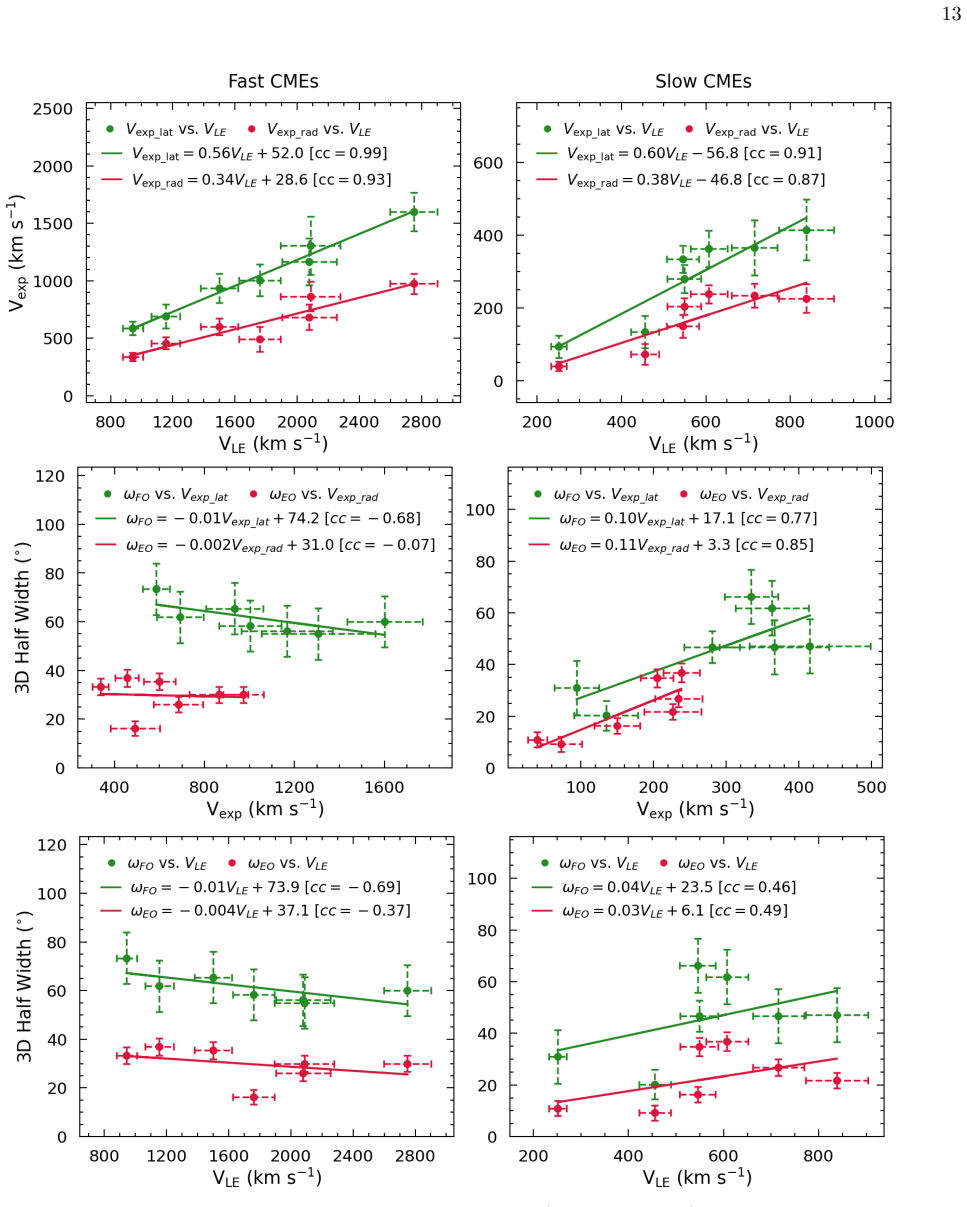
Pith's one-line read Coronal mass ejections expand sideways (laterally) faster than they expand outward (radially), by about 1.7x, and fast and slow events show opposite width–expansion correlations—so they cannot be treated as one population.
desk verdict A careful GCS study of fast vs slow CME expansion, but the headline fast/slow correlation is fragile and the lateral-size formula does not reproduce the paper's own numbers. read the letter →
The pith
A machine-rendered reading of the paper's core claim, the machinery that carries it, and where it could break.
The reading
What carries the argument
The load-bearing tool is the Graduated Cylindrical Shell (GCS) model, which fits each CME as a hollow 'croissant' made of two conical legs and a torus-shaped front, specified by six parameters including the leg half-angle α and aspect ratio κ. From α and κ the paper computes two angular widths—face-on (≈2(α+δ), along the torus axis) and edge-on (≈2δ, poloidal)—and two size measures: the radial flux-rope radius R_rad = κ/(1+κ) h_f and the in-plane lateral half-extent R_lat. The key geometric identity is that the croissant's circular cross-sections make the radial dimension equal to the lateral dimension perpendicular to the propagation plane, so the only genuinely independent lateral expansio
What would settle it
Reconstruct the same 14 CMEs with an independent 3D method that does not impose the GCS equal-radial/perpendicular-lateral constraint (e.g., forward-modeling with free elliptical cross-sections or stereoscopic triangulation of the flanks), and check whether lateral-in-plane expansion still exceeds radial expansion by ~1.7 and whether the fast-CME negative width–expansion correlation survives; alternatively, track fast CMEs below 1.5 solar radii to capture the peak expansion phase and test whether the negative correlation is an artifact of missing the low corona.
Extended reading notes
Core claim
On the paper's own terms, the central discovery is that asymmetric expansion is a persistent property of CMEs in the coronagraphic height range (~2–20 solar radii): for all 14 events the lateral expansion speed measured in the plane of propagation is higher than the radial expansion speed along the propagation direction, with a mean ratio V_lat/V_rad ≈ 1.7 at the final tracked height. The second principal finding is a fast/slow dichotomy at 10 solar radii: slow CMEs show strong positive correlations between expansion speeds and the corresponding angular widths (lateral with face-on, radial with edge-on), whereas fast CMEs show a negative correlation between lateral expansion speed and face-o
Load-bearing premise
The conclusion assumes that the GCS hollow-croissant geometry—with its circular cross-sections tying the perpendicular lateral width to the radial width—is the true shape of real CMEs; if actual CMEs depart from that shape, the measured asymmetry and the opposite fast/slow correlations could be artifacts of the fitting model.
Editorial extensions
If this is right
- If CMEs expand asymmetrically, empirical relations like V_rad = 0.88 V_exp and fixed f(ω) cone factors misidentify which dimension they measure; the paper shows the cone-model expansion speed is essentially the lateral speed, so radial speeds inferred from cone fits are likely overestimated.
- Fast and slow CMEs should be analyzed separately; combining them can produce misleading positive width–speed correlations (as the paper notes earlier studies found) that hide opposing behaviors.
- CME parameters at 10 solar radii are not a universal snapshot: slow CMEs are near the end of their expansion phase there, while many fast CMEs are still expanding, so arrival-time and impact-width predictions need height-dependent, direction-dependent expansion.
- Time-dependent, deprojected 3D parameters (GCS or equivalent) should replace constant angular-width cone approximations in CME kinematic and heliospheric models.
- Observing fast CMEs from lower coronal heights (~1.5 solar radii and below) is necessary to capture their peak expansion phase, which is missed in the current sample and likely drives the negative correlation.
Reading between the lines
- The reported asymmetry may be partly baked into the model: GCS forces the perpendicular lateral dimension to equal the radial dimension, so the 'asymmetry' examined is between two directions that the model does not constrain independently. A natural test is to fit the same events with a model that relaxes circular cross-sections and see whether V_lat/V_rad ≈ 1.7 survives.
- A testable prediction follows from the authors' 'still expanding' interpretation: fast CMEs' face-on widths should continue to grow beyond 10 solar radii and their lateral expansion speeds decline, so a heliospheric-imager sample extending to 20–50 solar radii should show the fast-CME negative correlation weaken or reverse.
- The fast/slow classification at ~2–5 solar radii divides a continuum; with only seven events per bin and hand-fitted GCS parameters, the opposite correlation signs could be driven by the two or three most extreme fast events rather than a true dichotomy, so a larger sample with reported significance levels is needed.
- If the asymmetry is real, MHD simulations of CMEs launched with elliptical rather than circular cross-sections should reproduce the observed ratio and the fast/slow differences, providing an independent check.
Editorial analysis
A structured set of objections, weighed in public.
Referee Report
Summary. The manuscript analyzes 14 CMEs (7 fast, 7 slow) using GCS reconstructions from STEREO/SOHO and derives time-dependent radial and lateral expansion speeds, face-on and edge-on angular widths, and correlations at ~10 R_sun. Its main claims are that lateral (in-plane) expansion systematically exceeds radial expansion by an average factor of ~1.7 in both populations; that the full ice-cream cone model's expansion speed tracks lateral rather than radial expansion; and that fast and slow CMEs show opposite correlations between lateral expansion speed and face-on angular width, implying fundamentally different evolutionary pathways. The paper is well structured, makes explicit use of multi-viewpoint GCS fitting, and includes a considered discussion of limitations.
Significance. If the findings are robust, they strengthen earlier evidence for asymmetric CME expansion and provide useful quantitative input for space-weather modeling, particularly in cautioning against fixed cone conversion factors and single-population treatments of fast and slow CMEs. The paper carefully compares its ratios with earlier empirical relations and is transparent about many limitations, including manual GCS fitting subjectivity and small sample size. However, the headline fast/slow distinction rests on seven manually fitted events per population with no significance testing, and the lateral-extent formula at the center of the asymmetry calculation is not reproduced by the equations given in the Appendix. These issues must be resolved before the conclusions can be considered reliable.
major comments (4)
- [Appendix A, Table 3 (g)-(h), §2.3] Appendix A and Table 3 define the lateral half-dimension as R_lat = max_β BP_x (Eqs. g-h). In Eq. (g), h is the conical-leg height OD, and Eq. (b) gives h_f = (b+ρ)/(1−κ). For the 2012 Mar 07 event (Table 1: h_f=10 R_sun, α=30°, κ=0.5), this relation gives h ≈ 2.89 R_sun; solving Eq. (A1) for the maximizing β gives BP_x,max ≈ 1.64 R_sun, i.e., 2R_lat ≈ 3.3 R_sun. This is far below the 10–14 R_sun range quoted for fast CMEs at ~10 R_sun in §2.3. The quoted range is approximately reproduced if h in Eq. (g) is replaced by h_f, but that reading conflicts with the Appendix's statement that h is the conical-leg height. Since R_lat is the input to V_lat = dR_lat/dt (Table 3, Eq. m), the asymmetry ratio and the correlations in Fig. 6 depend directly on this choice. The authors must reconcile Eq. (g) with §2.3, state the exact formula used for the reported V_lat, and recompute the affected number
- [§3, Fig. 6] The main new result — fast CMEs show a negative correlation between lateral expansion speed and face-on angular width, while slow CMEs show a positive one — is based on seven points per population. No significance test, confidence interval, bootstrap, or leave-one-out result is reported, and the thresholds used to classify correlations as strong/moderate/weak are arbitrary. With n=7, a single influential event (e.g., 2012 Mar 07, also the most extreme in leading-edge speed) can determine the sign. The paper should report p-values or equivalent, a non-parametric alternative such as Spearman's ρ, and a leave-one-out or jackknife sensitivity check. The adopted GCS parameter uncertainties (5% height, ±0.05 κ, ±5–10° α) should also be propagated into the correlation analysis. Without this, the claim that fast and slow CMEs evolve fundamentally differently is not statistically supported.
- [§2.3, Appendix A, §5] The asymmetry ratio V_lat/V_rad is not a direct observable; it is a derived property of the assumed GCS hollow-croissant geometry. Appendix A explicitly notes that one lateral dimension equals the radial dimension by construction, and the reported 'lateral' direction is the in-plane width of this particular shell. If real CMEs deviate from the croissant shape, the average ratio of ~1.7 and the correlation signs in Fig. 6 could change. The paper should state this conditionality in the conclusions and, ideally, test sensitivity to the shape assumption, for example by comparing with an independent cone-shell or elliptical parameterization, or by quoting the model-induced scatter.
- [§2.4, Eqs. (1)-(2)] The full cone model expansion speed is computed using ω = α+δ from the same GCS fit and V_LE from the same GCS height-time series. The agreement of V_exp_fullcone with V_lat is therefore in part a consistency check between two derived quantities of one model, not an independent validation. The statements in §4.2 and §5 that the full cone model 'primarily reflects lateral expansion' should be qualified as a consequence of the GCS geometry and the adopted mapping, unless an independent cone-model fit is performed.
minor comments (4)
- [§3] Please specify how the representative values at 10 R_sun are obtained: interpolation between measurements, evaluation of the moving-box fit, or the nearest observed height? The phrase 'around 10 R_sun' is ambiguous, especially since the last tracked heights range from 10.0 to 23.2 R_sun.
- [Table 2] The column headers '3D half face-on width [α+δ]' and '3D half edge-on width [δ]' are clear in context but should explicitly state that the values are half widths in degrees. Also add units to the speed columns for readability.
- [Fig. 6] The caption says 'The dashed line represents the error bars,' but the figure does not show how these error bars were computed. Please define the uncertainty source and the propagation method in the caption.
- [§4.4] The phrase 'fundamentally different' appears in the conclusions and abstract. Given the small sample and the issues above, a more measured wording such as 'consistent with different evolutionary behaviors, pending a larger sample' would better match the evidence presented.
Circularity Check
Qualitative lateral>radial asymmetry is inherited from the GCS croissant parameterization; quantitative ratio and fast/slow correlations retain independent fitted content.
-
self definitional
[§2.2–2.3, Appendix A, Table 3 (Eqs. d, e, g–i)]
"The face-on angular width is measured along the toroidal direction (along the axis of the torus), whereas the edge-on angular width is along the poloidal direction... half face-on angular width (α+δ)... half edge-on angular width (δ)... the face-on angular width along the toroidal direction serves as a proxy for the lateral dimension in the plane of CME propagation... R_lat max of BP_x... R_rad (κ/(1+κ))h_f"
The GCS geometry defines the in-plane lateral half-size via the face-on angle α+δ, while the radial half-size is set by δ alone (κ=sinδ; R_rad=κh_f/(1+κ)). Because α>0 is a built-in croissant parameter, the face-on/lateral extent is larger than the radial/poloidal extent for every fitted event; with the paper's near-constant α and saturating κ, V_lat/V_rad ≈ R_lat/R_rad >1. Thus the central 'asymmetric expansion' conclusion is a property of the assumed hollow-croissant parameterization rather than an independently measured asymmetry. The 1.7 ratio magnitude and the fast/slow correlations are data-dependent, so the circularity is partial.
-
other
[§2.4, §4.2]
"We instead use the de-projected, time-varying half face-on angular width of the hollow croissant-shaped CME as ω to estimate the de-projected expansion speed from the full cone model... We use the face-on angular width because it represents the full angular extent between the two outer flanks of the croissant-shaped shell, which is the closest geometric analog to the opening angle of a 3D cone."
The full-cone expansion speed is computed from the same GCS fit (V_LE from h_f and ω=half face-on width). Since ω is explicitly selected because it represents the outer-flank (lateral) extent, the later finding that the full-cone speed 'closely matches the lateral expansion speed' is a consequence of the input choice, not an independent validation that cone-model expansion equals lateral expansion. It is an internal consistency check, not a separate benchmark.
full rationale
The main derivation pipeline (GCS fits -> R_rad,R_lat -> V_rad,V_lat -> correlations) is not circular in the usual sense: the GCS parameters are fitted to multi-viewpoint coronagraph images, and the expansion speeds are numerical derivatives of fitted sizes, not fitted to the target correlations. The paper is transparent that GCS assumes a hollow croissant and that one lateral dimension equals the radial dimension by construction. The load-bearing weakness is that the qualitative 'lateral expansion exceeds radial expansion' result is already encoded in the model's face-on (α+δ) vs poloidal (δ) definitions, so it is better described as model-inherited than as an empirical confirmation. The full-cone model comparison (Sec. 2.4) is an internal consistency check: the cone speed is recomputed from the same GCS leading-edge height and the same face-on width chosen because it is the lateral flank extent, so its agreement with lateral expansion is partly by input construction. Self-citations (e.g., Agarwal & Mishra 2024; Mishra et al. 2026) are used only for methods or interpretive context and are not load-bearing. The fast/slow negative correlation rests on n=7 hand-fitted events, a statistical fragility the paper itself acknowledges ('limited sample... may be affected by sample bias'), which lowers confidence but is not circularity.
Assumptions & free parameters
free parameters (4)
- GCS half-angle α(t) =
~11°–50° depending on event (Table 1/2)
- GCS aspect ratio κ(t) = sin δ(t) =
~0.17–0.62
- leading-edge height h_f(t) =
tracked ~1.6–23 R_sun
- fast/slow speed threshold =
600 km/s
assumptions (5)
- domain assumption GCS hollow-croissant geometry with self-similar expansion (circular cross-sections) approximates real CME structure; R_perp = R_rad by construction.
- domain assumption Face-on angular width 2(α+δ) maps to the lateral extent in the propagation plane.
- ad hoc to paper Correlation strength is judged from cc magnitude alone on n=7 samples (0.6–1 strong, 0.4–0.6 moderate, <0.4 weak).
- ad hoc to paper Literature uncertainty values (5% height, ±0.05 κ, ±5–10° α) apply to these manual fits.
- domain assumption At ~10 R_sun, α, κ, expansion speeds and angular widths are sufficiently evolved that a single-height comparison is representative.
Cite this review
Pith. "Pith review of Comparative 3D Asymmetric Expansion and Angular Widths Evolution of Fast and Slow Coronal Mass Ejections." pith.science (2026). https://pith.science/paper/4BHLBYRO
@misc{pith2026260721236,
  author       = {Pith},
  title        = {Pith review of: Comparative 3D Asymmetric Expansion and Angular Widths Evolution of Fast and Slow Coronal Mass Ejections},
  year         = {2026},
  howpublished = {\url{https://pith.science/paper/4BHLBYRO}},
  note         = {Machine review of arXiv:2607.21236}
}
read the original abstract
The radial and lateral dimensions of coronal mass ejections (CMEs) influence their duration and probability of encounter at Earth. These properties are linked to the expansion speed of CMEs in different radial and lateral directions; however, most earlier studies modeled CME evolution using a projected full ice-cream cone geometry, which does not distinguish between radial and lateral expansion. Our study investigates the asymmetric expansion (relative radial and lateral components) and kinematics of seven fast and seven slow CMEs within coronagraphic heights, using the Graduated Cylindrical Shell model. Our study confirms that CMEs expand asymmetrically, with lateral expansion exceeding radial expansion in both CME populations. This asymmetry limits the accuracy of the full ice-cream cone model. For both fast and slow CMEs, higher leading edge speeds are associated with higher expansion speeds. At a height of 10 Rs, slow CMEs with larger expansion speeds (lateral and radial) have larger angular widths (face-on and edge-on), whereas fast CMEs exhibit a negative correlation between lateral expansion speed and face-on angular width. We find that the expansion and propagation speeds of slow CMEs exhibit a two-phase evolution, whereas those of fast CMEs display more diverse trends. Overall, this study suggests that fast and slow CMEs evolve differently and should not be treated as a single population in statistical estimates of their physical parameters. Our study highlights the importance of estimating CME angular widths and expansion speeds along different directions, and beyond standard coronagraphic heights, to capture their complete physical evolution.
Figures


Figures from the paper (4 more)



Reference graph
Works this paper leans on
-
[1]
2024, MNRAS, 534, 2458, doi: 10.1093/mnras/stae2260 —
Agarwal, A., & Mishra, W. 2024, MNRAS, 534, 2458, doi: 10.1093/mnras/stae2260 —. 2025, ApJ, 982, 183, doi: 10.3847/1538-4357/adbaeb 20 Parameters Expression Distance of the CME center (OC 1 =h c)b+X 0(β=π/2) = b+ρ 1−κ 2 (a) Height of the CME apex (OH)h f = b+ρ 1−κ =OC 1(1 +κ) (b) Cross-section radius of the curved frontR(β=π/2) = κ(b+ρ) 1−κ 2 (c) Face-on ...
-
[2]
Agarwal, A., Mishra, W., Owens, M. J., & Amerstorfer, T. 2026, Space Weather, 24, e2025SW004911, doi: https://doi.org/10.1029/2025SW004911
-
[3]
2025, SSRv, 221, 12, doi: 10.1007/s11214-025-01138-w
Al-Haddad, N., & Lugaz, N. 2025, SSRv, 221, 12, doi: 10.1007/s11214-025-01138-w
-
[4]
2018, Space Weather, 16, 784, doi: 10.1029/2017SW001786
Amerstorfer, T., M¨ ostl, C., Hess, P., et al. 2018, Space Weather, 16, 784, doi: 10.1029/2017SW001786
-
[5]
A., Vourlidas, A., Stenborg, G., & St
Balmaceda, L. A., Vourlidas, A., Stenborg, G., & St. Cyr, O. C. 2020, SoPh, 295, 107, doi: 10.1007/s11207-020-01672-6
-
[6]
2022, Frontiers in Physics, 10, 1005621, doi: 10.3389/fphy.2022.1005621
Barnard, L., & Owens, M. 2022, Frontiers in Physics, 10, 1005621, doi: 10.3389/fphy.2022.1005621
arXiv 2022
-
[7]
M., Berkebile-Stoiser, S., Veronig, A
Bein, B. M., Berkebile-Stoiser, S., Veronig, A. M., et al. 2011, ApJ, 738, 191, doi: 10.1088/0004-637X/738/2/191
-
[8]
1998, Annales Geophysicae, 16, 1, doi: 10.1007/s00585-997-0001-x
Bothmer, V., & Schwenn, R. 1998, Annales Geophysicae, 16, 1, doi: 10.1007/s00585-997-0001-x
Show all 96 references
-
[9]
E., Howard, R
Brueckner, G. E., Howard, R. A., Koomen, M. J., et al. 1995, SoPh, 162, 357, doi: 10.1007/BF00733434
1995 doi
-
[10]
Burlaga, L., Sittler, E., Mariani, F., & Schwenn, R. 1981, J. Geophys. Res., 86, 6673, doi: 10.1029/JA086iA08p06673
1981 doi
-
[11]
2016, SoPh, 291, 1799, doi: 10.1007/s11207-016-0941-y
Cabello, I., Cremades, H., Balmaceda, L., & Dohmen, I. 2016, SoPh, 291, 1799, doi: 10.1007/s11207-016-0941-y
2016 doi
-
[12]
Cargill, P. J. 2004, SoPh, 221, 135, doi: 10.1023/B:SOLA.0000033366.10725.a2
2004
-
[13]
Chen, J., & Garren, D. A. 1993, Geophys. Res. Lett., 20, 2319, doi: 10.1029/93GL02426
1993 doi
-
[14]
A., Krall, J., et al
Chen, J., Santoro, R. A., Krall, J., et al. 2000, ApJ, 533, 481, doi: 10.1086/308646
2000 doi
-
[15]
A., & Merenda, L
Cremades, H., Iglesias, F. A., & Merenda, L. A. 2020, A&A, 635, A100, doi: 10.1051/0004-6361/201936664
2020 doi
-
[16]
U., & Intriligator, D
Crooker, N. U., & Intriligator, D. S. 1996, J. Geophys. Res., 101, 24343, doi: 10.1029/96JA02129 Dal Lago, A., Schwenn, R., & Gonzalez, W. D. 2003, Advances in Space Research, 32, 2637, doi: 10.1016/j.asr.2003.03.012 Dal Lago, A., Vieira, L. E. A., Echer, E., et al. 2004, SoPh...
1996
-
[17]
H., D´ emoulin, P., & Luoni, M
Dasso, S., Mandrini, C. H., D´ emoulin, P., & Luoni, M. L. 2006, A&A, 455, 349, doi: 10.1051/0004-6361:20064806
2006 doi
-
[18]
A., Perry, C
Davies, J. A., Perry, C. H., Trines, R. M. G. M., et al. 2013, ApJ, 777, 167, doi: 10.1088/0004-637X/777/2/167 21
2013 doi
-
[19]
A., Harrison, R
Davies, J. A., Harrison, R. A., Rouillard, A. P., et al. 2009, Geophys. Res. Lett., 36, L02102, doi: 10.1029/2008GL036182 Di Lorenzo, L., Balmaceda, L., Cremades, H., &
2009 doi
-
[20]
2024, SoPh, 299, 43, doi: 10.1007/s11207-024-02290-2
Nieves-Chinchilla, T. 2024, SoPh, 299, 43, doi: 10.1007/s11207-024-02290-2
2024 doi
-
[21]
Dupertuis, M., Zhang, J., Nikou, E., & Dhakal, S. K. 2025, ApJ, 993, 135, doi: 10.3847/1538-4357/ae09a6
2025 doi
-
[22]
T., Lawrence, G
Gallagher, P. T., Lawrence, G. R., & Dennis, B. R. 2003, ApJL, 588, L53, doi: 10.1086/375504
2003 doi
-
[23]
2014, Geophys
Gopalswamy, N., Akiyama, S., Yashiro, S., et al. 2014, Geophys. Res. Lett., 41, 2673, doi: 10.1002/2014GL059858
2014 doi
-
[24]
2009, Central European Astrophysical Bulletin, 33, 115
Gopalswamy, N., Dal Lago, A., Yashiro, S., & Akiyama, S. 2009, Central European Astrophysical Bulletin, 33, 115
2009
- [25]
-
[26]
2010, Sun and Geosphere, 5, 7
Gopalswamy, N., Yashiro, S., Michalek, G., et al. 2010, Sun and Geosphere, 5, 7
2010
-
[27]
T., Bame, S
Gosling, J. T., Bame, S. J., McComas, D. J., & Phillips, J. L. 1990, Geophys. Res. Lett., 17, 901, doi: 10.1029/GL017i007p00901
1990 doi
-
[28]
2010, A&A, 509, A39, doi: 10.1051/0004-6361/200912375
Marsch, E. 2010, A&A, 509, A39, doi: 10.1051/0004-6361/200912375
2010 doi
-
[29]
2014, ApJ, 792, 49, doi: 10.1088/0004-637X/792/1/49
Hess, P., & Zhang, J. 2014, ApJ, 792, 49, doi: 10.1088/0004-637X/792/1/49
2014 doi
-
[30]
A., Moses, J
Howard, R. A., Moses, J. D., Vourlidas, A., et al. 2008, SSRv, 136, 67, doi: 10.1007/s11214-008-9341-4
2008 doi
-
[31]
A., & DeForest, C
Howard, T. A., & DeForest, C. E. 2012, ApJ, 746, 64, doi: 10.1088/0004-637X/746/1/64
2012 doi
-
[32]
L., Kucera, T
Kaiser, M. L., Kucera, T. A., Davila, J. M., et al. 2008, SSRv, 136, 5, doi: 10.1007/s11214-007-9277-0
2008 doi
-
[33]
2024, Space Weather, 22, e2023SW003796, doi: 10.1029/2023SW003796
Kay, C., & Palmerio, E. 2024, Space Weather, 22, e2023SW003796, doi: 10.1029/2023SW003796
2024 doi
-
[34]
2025, A&A, 698, A79, doi: 10.1051/0004-6361/202452866
Khuntia, S., Mishra, W., & Agarwal, A. 2025, A&A, 698, A79, doi: 10.1051/0004-6361/202452866
2025 doi
-
[35]
2024, MNRAS, 535, 2585, doi: 10.1093/mnras/stae2523
Khuntia, S., Mishra, W., Wang, Y., et al. 2024, MNRAS, 535, 2585, doi: 10.1093/mnras/stae2523
2024 doi
-
[36]
Kilpua, E., Koskinen, H. E. J., & Pulkkinen, T. I. 2017, Living Reviews in Solar Physics, 14, 5, doi: 10.1007/s41116-017-0009-6
2017 doi
-
[37]
E., Kilpua, E
Kumari, A., Morosan, D. E., Kilpua, E. K. J., & Daei, F. 2023, A&A, 675, A102, doi: 10.1051/0004-6361/202244015
2023 doi
-
[38]
A., Luhmann, J
Liu, Y., Davies, J. A., Luhmann, J. G., et al. 2010, ApJL, 710, L82, doi: 10.1088/2041-8205/710/1/L82
2010 doi
-
[39]
G., Huttunen, K
Liu, Y., Luhmann, J. G., Huttunen, K. E. J., et al. 2008, ApJL, 677, L133, doi: 10.1086/587839
2008 doi
-
[40]
J., Winslow, R
Lugaz, N., Farrugia, C. J., Winslow, R. M., et al. 2018, ApJL, 864, L7, doi: 10.3847/2041-8213/aad9f4
2018 doi
-
[41]
2023, A&A, 672, A100, doi: 10.1051/0004-6361/202243912 M¨ akel¨ a, P., Gopalswamy, N., & Yashiro, S
Lyu, S., Wang, Y., Li, X., & Zhang, Q. 2023, A&A, 672, A100, doi: 10.1051/0004-6361/202243912 M¨ akel¨ a, P., Gopalswamy, N., & Yashiro, S. 2016, Space Weather, 14, 368, doi: 10.1002/2015SW001335
2023 doi
-
[42]
2024, ApJS, 270, 10, doi: 10.3847/1538-4365/ad08c7
Mayank, P., Vaidya, B., Mishra, W., & Chakrabarty, D. 2024, ApJS, 270, 10, doi: 10.3847/1538-4365/ad08c7
2024 doi
-
[43]
2009, SoPh, 260, 401, doi: 10.1007/s11207-009-9464-0
Michalek, G., Gopalswamy, N., & Yashiro, S. 2009, SoPh, 260, 401, doi: 10.1007/s11207-009-9464-0
2009 doi
-
[44]
J., Howard, R
Michels, D. J., Howard, R. A., Koomen, M. J., et al. 1997, in ESA Special Publication, Vol. 404, Fifth SOHO Workshop: The Corona and Solar Wind Near Minimum Activity, ed. A. Wilson, 567
1997
- [45]
-
[46]
2021, Frontiers in Astronomy and Space Sciences, 8, 142, doi: 10.3389/fspas.2021.713999
Mishra, W., Doshi, U., & Srivastava, N. 2021, Frontiers in Astronomy and Space Sciences, 8, 142, doi: 10.3389/fspas.2021.713999
2021
-
[47]
S., Khuntia, S., & Chakrabarty, D
Mishra, W., Sahani, P. S., Khuntia, S., & Chakrabarty, D. 2024, MNRAS, 530, 3171, doi: 10.1093/mnras/stae1045
2024 doi
-
[48]
2013, ApJ, 772, 70, doi: 10.1088/0004-637X/772/1/70 —
Mishra, W., & Srivastava, N. 2013, ApJ, 772, 70, doi: 10.1088/0004-637X/772/1/70 —. 2014, ApJ, 794, 64, doi: 10.1088/0004-637X/794/1/64 —. 2015, Journal of Space Weather and Space Climate, 5, A20, doi: 10.1051/swsc/2015021
2013
-
[49]
Mishra, W., Srivastava, N., & Davies, J. A. 2014, ApJ, 784, 135, doi: 10.1088/0004-637X/784/2/135
2014 doi
-
[50]
2015, Journal of Geophysical Research (Space Physics), 120, 10,221, doi: 10.1002/2015JA021415
Mishra, W., Srivastava, N., & Singh, T. 2015, Journal of Geophysical Research (Space Physics), 120, 10,221, doi: 10.1002/2015JA021415
2015 doi
-
[51]
2023, Journal of Astrophysics and Astronomy, 44, 20, doi: 10.1007/s12036-023-09910-6
Mishra, W., & Teriaca, L. 2023, Journal of Astrophysics and Astronomy, 44, 20, doi: 10.1007/s12036-023-09910-6
2023 doi
-
[52]
2017, ApJS, 232, 5, doi: 10.3847/1538-4365/aa8139
Mishra, W., Wang, Y., Srivastava, N., & Shen, C. 2017, ApJS, 232, 5, doi: 10.3847/1538-4365/aa8139
2017 doi
-
[53]
Kilpua, E. K. J. 2022, A&A, 668, A15, doi: 10.1051/0004-6361/202244432 M¨ ostl, C., Amla, K., Hall, J. R., et al. 2014, ApJ, 787, 119, doi: 10.1088/0004-637X/787/2/119
2022 doi
-
[54]
K., & Dupertuis, M
Nikou, E., Zhang, J., Dhakal, S. K., & Dupertuis, M. 2025, ApJ, 987, 157, doi: 10.3847/1538-4357/adcef0
2025 doi
-
[55]
2003, Advances in Space Research, 32, 497, doi: 10.1016/S0273-1177(03)00332-6
Odstrcil, D. 2003, Advances in Space Research, 32, 497, doi: 10.1016/S0273-1177(03)00332-6
2003 doi
-
[56]
J., Barnard, L
Owens, M. J., Barnard, L. A., Verbeke, C., et al. 2025, Space Weather, 23, e2025SW004397, doi: https://doi.org/10.1029/2025SW004397 22
2025 doi
-
[57]
2021, Frontiers in Astronomy and Space Sciences, 8, 73, doi: 10.3389/fspas.2021.634358
Pant, V., Majumdar, S., Patel, R., et al. 2021, Frontiers in Astronomy and Space Sciences, 8, 73, doi: 10.3389/fspas.2021.634358
2021
-
[58]
2010a, A&A, 522, A100, doi: 10.1051/0004-6361/200913599
Patsourakos, S., Vourlidas, A., & Kliem, B. 2010a, A&A, 522, A100, doi: 10.1051/0004-6361/200913599
-
[59]
2010b, ApJL, 724, L188, doi: 10.1088/2041-8205/724/2/L188
Patsourakos, S., Vourlidas, A., & Stenborg, G. 2010b, ApJL, 724, L188, doi: 10.1088/2041-8205/724/2/L188
-
[60]
K., Vourlidas, A., et al
Patsourakos, S., Georgoulis, M. K., Vourlidas, A., et al. 2016, ApJ, 817, 14, doi: 10.3847/0004-637X/817/1/14
2016 doi
-
[61]
2019, A&A, 623, A139, doi: 10.1051/0004-6361/201833829
Savani, N. 2019, A&A, 623, A139, doi: 10.1051/0004-6361/201833829
2019 doi
-
[62]
2018, Journal of Space Weather and Space Climate, 8, A35, doi: 10.1051/swsc/2018020
Pomoell, J., & Poedts, S. 2018, Journal of Space Weather and Space Climate, 8, A35, doi: 10.1051/swsc/2018020
2018
-
[63]
2007, Living Reviews in Solar Physics, 4, 1, doi: 10.12942/lrsp-2007-1
Pulkkinen, T. 2007, Living Reviews in Solar Physics, 4, 1, doi: 10.12942/lrsp-2007-1
2007 doi
-
[64]
2015, ApJ, 809, 158, doi: 10.1088/0004-637X/809/2/158
Sachdeva, N., Subramanian, P., Colaninno, R., & Vourlidas, A. 2015, ApJ, 809, 158, doi: 10.1088/0004-637X/809/2/158
2015 doi
-
[65]
P., Owens, M
Savani, N. P., Owens, M. J., Rouillard, A. P., et al. 2011, ApJ, 731, 109, doi: 10.1088/0004-637X/731/2/109
2011 doi
-
[66]
P., Rouillard, A
Savani, N. P., Rouillard, A. P., Davies, J. A., et al. 2009, Annales Geophysicae, 27, 4349, doi: 10.5194/angeo-27-4349-2009
2009 doi
-
[67]
J., Kauristie, K., Aylward, A
Schrijver, C. J., Kauristie, K., Aylward, A. D., et al. 2015, Advances in Space Research, 55, 2745, doi: 10.1016/j.asr.2015.03.023
2015 doi
-
[68]
2006, Living Reviews in Solar Physics, 3, 2, doi: 10.12942/lrsp-2006-2
Schwenn, R. 2006, Living Reviews in Solar Physics, 3, 2, doi: 10.12942/lrsp-2006-2
2006 doi
-
[69]
Schwenn, R., dal Lago, A., Huttunen, E., & Gonzalez, W. D. 2005, Annales Geophysicae, 23, 1033, doi: 10.5194/angeo-23-1033-2005
2005 doi
-
[70]
2019, A&A, 626, A122, doi: 10.1051/0004-6361/201935053
Poedts, S. 2019, A&A, 626, A122, doi: 10.1051/0004-6361/201935053
2019 doi
-
[71]
2020, ApJS, 247, 21, doi: 10.3847/1538-4365/ab6216
Scolini, C., Chan´ e, E., Temmer, M., et al. 2020, ApJS, 247, 21, doi: 10.3847/1538-4365/ab6216
2020 doi
-
[72]
R., Walters, J
Sheeley, N. R., Walters, J. H., Wang, Y. M., & Howard, R. A. 1999, J. Geophys. Res., 104, 24739, doi: 10.1029/1999JA900308
1999 doi
-
[73]
2013, Journal of Geophysical Research (Space Physics), 118, 6858, doi: 10.1002/2013JA018872
Shen, C., Wang, Y., Pan, Z., et al. 2013, Journal of Geophysical Research (Space Physics), 118, 6858, doi: 10.1002/2013JA018872
2013 doi
-
[74]
L., Selvakumaran, R., & Thampi, R
Soni, S. L., Selvakumaran, R., & Thampi, R. S. 2023, Frontiers in Astronomy and Space Sciences, 9, 441, doi: 10.3389/fspas.2022.1049906
2023
-
[75]
2007, A&A, 467, 685, doi: 10.1051/0004-6361:20066770
Subramanian, P., & Vourlidas, A. 2007, A&A, 467, 685, doi: 10.1051/0004-6361:20066770
2007 doi
-
[76]
2011, ApJ, 743, 101, doi: 10.1088/0004-637X/743/2/101
Temmer, M., Rollett, T., M¨ ostl, C., et al. 2011, ApJ, 743, 101, doi: 10.1088/0004-637X/743/2/101
2011 doi
-
[77]
M., Kontar, E
Temmer, M., Veronig, A. M., Kontar, E. P., Krucker, S., & Vrˇ snak, B. 2010, ApJ, 712, 1410, doi: 10.1088/0004-637X/712/2/1410
2010 doi
-
[78]
2021, Journal of Geophysical Research (Space Physics), 126, e28380, doi: 10.1029/2020JA028380
Temmer, M., Holzknecht, L., Dumbovi´ c, M., et al. 2021, Journal of Geophysical Research (Space Physics), 126, e28380, doi: 10.1029/2020JA028380
2021 doi
- [79]
-
[80]
2011, ApJS, 194, 33, doi: 10.1088/0067-0049/194/2/33
Thernisien, A. 2011, ApJS, 194, 33, doi: 10.1088/0067-0049/194/2/33
2011 doi
-
[81]
Thernisien, A., Vourlidas, A., & Howard, R. A. 2009, SoPh, 256, 111, doi: 10.1007/s11207-009-9346-5
2009 doi
-
[82]
Thernisien, A. F. R., Howard, R. A., & Vourlidas, A. 2006, ApJ, 652, 763, doi: 10.1086/508254
2006 doi
-
[83]
L., Kay, C., et al
Verbeke, C., Mays, M. L., Kay, C., et al. 2023, Advances in Space Research, 72, 5243, doi: 10.1016/j.asr.2022.08.056
2023 doi
-
[84]
M., Podladchikova, T., Dissauer, K., et al
Veronig, A. M., Podladchikova, T., Dissauer, K., et al. 2018, ApJ, 868, 107, doi: 10.3847/1538-4357/aaeac5
2018 doi
-
[85]
A., Stenborg, G., & Dal Lago, A
Vourlidas, A., Balmaceda, L. A., Stenborg, G., & Dal Lago, A. 2017, ApJ, 838, 141, doi: 10.3847/1538-4357/aa67f0 Vrˇ snak, B., Mariˇ ci´ c, D., Stanger, A. L., et al. 2007, SoPh, 241, 85, doi: 10.1007/s11207-006-0290-3 Vrˇ snak, B., Ruˇ zdjak, D., Sudar, D., & Gopalswamy, N. 2...
2017 doi
-
[86]
2005, A&A, 435, 1123, doi: 10.1051/0004-6361:20042169
Warmuth, A., & Mann, G. 2005, A&A, 435, 1123, doi: 10.1051/0004-6361:20042169
2005 doi
-
[87]
F., & Howard, T
Webb, D. F., & Howard, T. A. 2012, Living Reviews in Solar Physics, 9, 3, doi: 10.12942/lrsp-2012-3
2012 doi
-
[88]
J., Seaton, D
West, M. J., Seaton, D. B., Wexler, D. B., et al. 2023, SoPh, 298, 78, doi: 10.1007/s11207-023-02170-1
2023 doi
-
[89]
2004, Journal of Geophysical Research (Space Physics), 109, A03109, doi: 10.1029/2003JA010226
Xie, H., Ofman, L., & Lawrence, G. 2004, Journal of Geophysical Research (Space Physics), 109, A03109, doi: 10.1029/2003JA010226
2004 doi
-
[90]
2004, Journal of Geophysical Research (Space Physics), 109, A07105, doi: 10.1029/2003JA010282
Yashiro, S., Gopalswamy, N., Michalek, G., et al. 2004, Journal of Geophysical Research (Space Physics), 109, A07105, doi: 10.1029/2003JA010282
2004 doi
-
[91]
Zhang, J., & Dere, K. P. 2006, ApJ, 649, 1100, doi: 10.1086/506903
2006 doi
-
[92]
2021, Progress in Earth and Planetary Science, 8, 56, doi: 10.1186/s40645-021-00426-7
Zhang, J., Temmer, M., Gopalswamy, N., et al. 2021, Progress in Earth and Planetary Science, 8, 56, doi: 10.1186/s40645-021-00426-7
2021 doi
-
[93]
P., Plunkett, S
Zhao, X. P., Plunkett, S. P., & Liu, W. 2002, Journal of Geophysical Research (Space Physics), 107, 1223, doi: 10.1029/2001JA009143
2002 doi
-
[94]
2023, ApJ, 952, 7, doi: 10.3847/1538-4357/acd847 23
Zhuang, B., Lugaz, N., Al-Haddad, N., et al. 2023, ApJ, 952, 7, doi: 10.3847/1538-4357/acd847 23
2023 doi
-
[95]
P., Bloomfield, D
Zucca, P., Carley, E. P., Bloomfield, D. S., & Gallagher, P. T. 2014, A&A, 564, A47, doi: 10.1051/0004-6361/201322650
2014 doi
-
[96]
H., & Richardson, I
Zurbuchen, T. H., & Richardson, I. G. 2006, SSRv, 123, 31, doi: 10.1007/s11214-006-9010-4
2006 doi
Reviewed August 1, 2026 · model on record in the stance chip above.
Discussion (0). Continue with ORCID to comment.