REVIEW 3 major objections 4 minor 47 references
Interferometric molecular line observations toward the 21 {\mu}m protoplanetary nebula IRAS 06530-0213
T0 review · 3 major / 4 minor · reviewed 2026-08-01 · deepseek-v4-flash
Pith's one-line read The authors claim that in IRAS 06530-0213, HC3N and C4H are chemically concentrated in an inner equatorial torus, not merely excited there, and that this zone is favorable for carbon-chain chemistry.
desk verdict New NOEMA carbon-chain maps are solid and useful; the claim that an HC3N abundance gradient is 'required' overreaches the 1D spherical model. read the letter →
The pith
A machine-rendered reading of the paper's core claim, the machinery that carries it, and where it could break.
The reading
What carries the argument
The central tool is a one-dimensional RATRAN Monte Carlo radiative transfer model, run for CO, 13CO, and HC3N with a common power-law density profile, homologous expansion, and a temperature power law. CO fixes the physical structure; then 13CO is reproduced with a constant abundance while HC3N requires an ad hoc radial abundance profile confined between 0.30 and 0.65 arcsec with a peak at 0.64 arcsec. The model's role is to test whether the observed central concentration can be explained by excitation or optical depth; its failure for constant HC3N abundance is the evidence for a true abundance gradient.
What would settle it
Map HC3N in at least three rotational transitions at matched high resolution to derive a resolved excitation-temperature map. If T_ex varies strongly with radius and a 3D non-LTE model with the actual barrel geometry and inclination reproduces the observed central concentration while keeping HC3N abundance constant, the abundance-gradient claim would collapse. Alternatively, resolving C4H in two or more transitions and finding that its radial profile also requires a constant abundance would weaken the chemical-differentiation interpretation.
Extended reading notes
Core claim
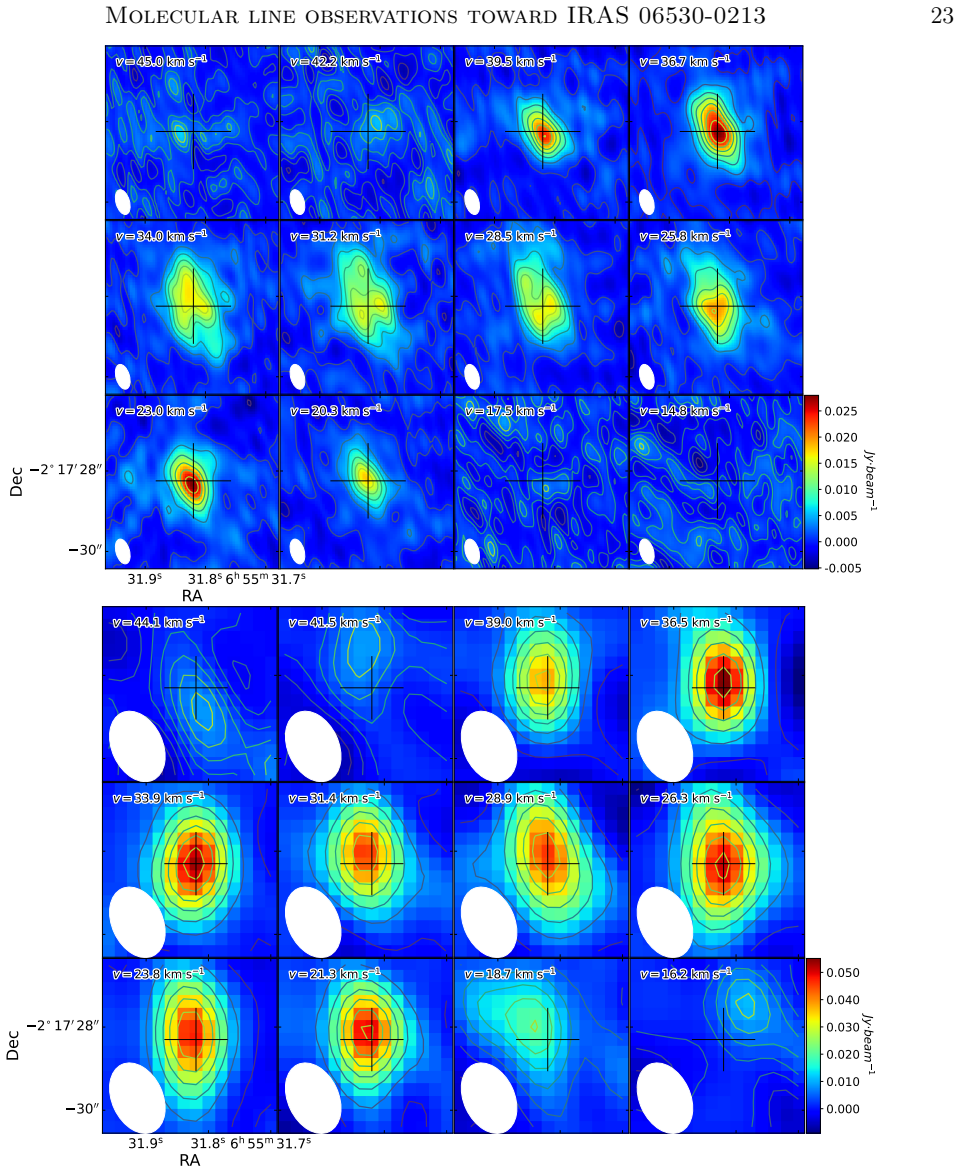
On the nebula's own terms: HC3N and C4H trace an inner, low-latitude torus with a deprojected expansion velocity of about 10.6 km/s, while CO and 13CO outline the full barrel. The constant-abundance model fails to reproduce the HC3N radial profile, and the variable-abundance model with a peak at r = 0.64 arcsec succeeds. Hence the observed morphology requires HC3N to have a more inwardly concentrated abundance distribution compared with CO and 13CO, implying that the inner equatorial regions provide favorable conditions for carbon-chain chemistry. The paper also finds that IRAS 06530-0213 shows stronger 15.8 and 21-micron features and a broader red wing on the 15.8-micron band than the compa
Load-bearing premise
The argument leans on a one-dimensional spherical RATRAN model with a single power-law density profile and a CO-constrained shell standing in for the equatorial sector of a barrel-shaped, likely non-spherical nebula; the paper itself states this model cannot uniquely reconstruct the intrinsic non-spherical structure, so if the true 3D geometry, inclination, or optical-depth gradients differ, the inferred HC3N abundance concentration could be an artifact of the assumed physics
Editorial extensions
If this is right
- The inner equatorial density enhancement in IRAS 06530-0213 is a chemically active zone where carbon-chain molecules form or survive, not just a region where they are easier to excite.
- Because all five spatially resolved 21-micron sources show equatorial density enhancements, these structures may be a common prerequisite for the 21-micron feature, pending a larger sample.
- The enhanced 15.8 and 21-micron features in IRAS 06530-0213 relative to IRAS 23304+6147 indicate that hotter, denser inner environments strengthen the bands associated with large carbonaceous material.
- The non-Lorentzian red wing of the 15.8-micron band in IRAS 06530-0213 suggests anharmonic hot-band emission from vibrationally excited PAHs, implying a higher-temperature environment that could also boost carbon-chain chemistry.
Reading between the lines
- If the HC3N gradient is real chemical differentiation, higher-order cyanopolyynes such as HC5N and HC7N should be even more centrally concentrated; that is a testable prediction for future NOEMA or ALMA observations.
- The inferred peak radius of 0.64 arcsec is tied to the assumed spherical geometry; a 3D model that includes the barrel walls and inclination could shift or sharpen this peak, so the quantitative value should be treated with caution.
- The comparison between the two sources suggests a test: if the 21-micron carrier is produced in the inner EDE, then among 21-micron sources the feature strength should correlate with EDE density or compactness, not just with central star temperature.
Signed reviews
Editorial analysis
A structured set of objections, weighed in public.
Referee Report
Summary. This paper presents new NOEMA interferometric observations of the 21 micron protoplanetary nebula IRAS 06530-0213, reporting the first spatially resolved detections of HC3N (J=24-23 and 26-25), C4H (J=47/2-45/2 and 45/2-43/2), and SiC2. The authors compare these maps with previously published CO and 13CO data and find that HC3N and C4H are concentrated in a compact inner, low-latitude torus-like structure, whereas CO and 13CO trace a larger barrel-like nebula. Using LTE column-density estimates, they derive fractional abundances and compare them with other carbon-rich evolved stars. To interpret the different spatial distributions, they perform 1D radiative transfer modeling with RATRAN. A constant-abundance model reproduces CO and 13CO but overproduces HC3N at large radii; a variable HC3N abundance peaked near 0.64 arcsec reproduces the observed radial profile. The paper concludes that HC3N must possess a more inwardly concentrated abundance distribution than CO/13CO, indicating that the inner equatorial density enhancement is chemically favorable for carbon-chain formation. The paper also compares Spitzer/IRS spectra of IRAS 06530-0213 and IRAS 23304+6147 and discusses possible links between the inner EDE and the 15.8 and 21 micron features.
Significance. The observational core of this paper is valuable. It adds a spatially resolved molecular inventory for a rare 21 micron PPN, and the compact HC3N/C4H morphology relative to CO/13CO is a robust, interesting observational result that will be useful for future studies of chemical differentiation in post-AGB envelopes. The abundance and column-density measurements, while model-dependent, expand the small sample of 21 micron sources with interferometric molecular maps. The central interpretive claim, however, rests on a simplified 1D spherical RATRAN model with several hand-set parameters and a fitted abundance profile. As the authors themselves note, this model is not designed to reconstruct the non-spherical structure. The claim that the observed morphology 'requires' an inwardly concentrated abundance distribution therefore goes beyond what the modeling actually demonstrates, and the paper would need to break the geometry-abundance degeneracy before the strong version of the conclusion can be accepted.
major comments (3)
- [§4.1, Fig. 10, Abstract, §5] The central claim that reproducing the observed HC3N morphology 'requires' an inwardly concentrated abundance distribution is not established by the 1D spherical RATRAN model. In the true source, the outer equatorial sectors contain a thin barrel wall and tenuous lobes/halo, whereas in the spherical model lines of sight at those projected radii pass through full spherical shells, which will overproduce emission for any molecule with constant abundance. The failure of the constant-abundance HC3N model could therefore reflect the assumed spherical filling of the outer regions rather than a true chemical depletion at large radii. Moreover, the variable abundance profile is fitted to the very radial profile that defines the discrepancy, so the conclusion partly reduces to model input. The authors explicitly concede in §4.1 that the 1D model is not designed to yield a unique reconstruction. I
- [§4.1, Fig. 10] The physical structure adopted for all species is constrained only by fitting the CO radial profile with a constant CO abundance and hand-set parameters (n_H2,out = 2.0e5 cm^-3, T_out = 60 K, CO shell 0.45-0.87 arcsec). CO is optically thick, so its normalized radial profile is not a direct tracer of the volume density distribution, and many combinations of density normalization, temperature, and shell boundaries could match the same profile. The paper does not report an exploration of the acceptable parameter range, and it does not use 13CO (which is optically thin and is reproduced with constant abundance) to independently constrain the inner density structure in the region where HC3N peaks. Without such sensitivity tests, the statement that 'excitation effects or optical depth alone cannot explain the central concentration' is not fully supported: a spherical model with a steeper inne
- [§3.4, Table 2] The derived fractional abundances rely on several stacked assumptions: LTE and optically thin emission, an excitation temperature T_ex = 24 K from only two HC3N lines observed at different array configurations, N(H2) estimated from 13CO with X(CO) = 8e-4 and 12C/13C = 30, and the same T_ex applied to C4H and SiC2. The resulting HC3N abundance in this source is roughly two orders of magnitude higher than that reported for other 21 micron sources (IRAS 23304+6147 and IRAS 22272+5435). This difference may partly reflect different observational beams, assumed excitation temperatures, and analysis methods rather than a genuine chemical difference. The comparison in §4.2 ('21 micron sources tend to show a higher HC3N/SiC2 ratio') should therefore be treated with caution, or reanalyzed with consistent assumptions across sources. This does not affect the morphological result, but it does affect
minor comments (4)
- [§4.1] The variable-abundance HC3N model is described as 'confined between R_in = 0.30 arcsec and R_out = 0.65 arcsec with a peak at r = 0.64 arcsec'; since the peak is essentially at the outer boundary, please clarify the adopted functional form (e.g., a power-law with a central hole, or a Gaussian ring) and whether the peak position is a fitted parameter or a fixed boundary.
- [Fig. 10] The lower panels show abundance profiles X(r) but the axis labels and the precise curves are not described in the text. Please add a short description of the CO, 13CO, and HC3N abundance profiles (constant versus variable) and specify whether the plotted X(r) for CO and 13CO are constants or also radial functions.
- [§3.1-3.2] The orientation language is sometimes ambiguous: e.g., HC3N 'extends along the southeast-northwest axis' while the barrel direction is described elsewhere as PA=35 deg. Please state explicitly how the HC3N/C4H torus orientation relates to the CO barrel axes defined in Sun et al. (2025b).
- [§4.2] The comparison of the 15.8 and 21 micron features between IRAS 06530-0213 and IRAS 23304+6147 is qualitative and does not account for slit position angle, possible extended emission, or continuum fitting details beyond the statement in the text. The discussion is appropriately cautious, but a brief caveat about these systematic effects should be added.
Circularity Check
The HC3N 'inwardly concentrated abundance' claim is a restatement of the fitted RATRAN abundance profile rather than an independent prediction.
-
fitted input called prediction
[Section 4.1 (RATRAN modelling) and abstract / Section 5]
"Adopting a variable abundance for HC3N confined between R_in = 0.30′′ and R_out = 0.65′′ with a peak at r=0.64′′, the model can reasonably reproduce the observations. This suggests that chemical differentiation may govern the spatial segregation of molecular species. ... Reproducing the observed morphology requires HC3N to possess a more inwardly concentrated abundance distribution compared with CO and 13CO."
The variable-abundance profile with a peak at 0.64'' is the free parameter tuned until the RATRAN model matches the observed HC3N radial profile. The concluding claim that HC3N 'requires' a more inwardly concentrated abundance distribution is a verbal restatement of that fitted input: the model output embodies exactly the abundance shape the conclusion asserts. The only independent content is the failure of the constant-abundance model, but that failure is conditional on the assumed 1D spherical power-law geometry and the CO-constrained shell, so it does not independently determine the fitted profile. Thus the central claim reduces by construction to the fitted parameter rather than being an independent prediction.
full rationale
The paper is largely self-contained: the observations are new NOEMA data, the RATRAN code is a standard public tool, and the CO data from the authors' prior paper are legitimate observational inputs rather than a circular citation of an unverified theorem. However, the central chemical conclusion is not a prediction from an independently fixed model. The HC3N abundance distribution is the free parameter adjusted to reproduce the observed compact radial profile, and the abstract/conclusion then state that reproducing the morphology 'requires' this inwardly concentrated abundance. That is a fitted input renamed as a derived requirement. The constant-abundance HC3N model does fail, which gives some non-tautological content, but the 'requires' inference is entirely conditional on the assumed 1D spherical geometry that the authors themselves concede is not a unique reconstruction. This does not make the paper fraudulent or the observations unimportant, but the headline claim is partly circular: the fitted abundance shape is presented as the finding it was used to produce.
Assumptions & free parameters
free parameters (9)
- n_H2,out (outer H2 density normalization) =
2.0e5 cm^-3
- T_out (outer gas temperature) =
60 K
- CO emitting shell boundaries =
0.45-0.87 arcsec
- X(CO) constant abundance =
8.0e-4
- X(13CO) fixed abundance =
2.6e-5
- X(HC3N) fixed abundance =
3e-6
- HC3N variable abundance profile =
R_in=0.30 arcsec, R_out=0.65 arcsec, peak at 0.64 arcsec
- T_ex fixed at 24 K =
24 K
- 12C/13C isotope ratio R =
30
assumptions (5)
- domain assumption LTE and optically thin emission hold for the column-density derivations of HC3N, 13CO, C4H, and SiC2.
- ad hoc to paper A 1D spherical power-law density/temperature/velocity structure represents the equatorial sector of the barrel-like nebula.
- ad hoc to paper The physical structure can be constrained by fitting only the CO radial profile with a constant CO abundance.
- domain assumption Representative values R=30 and X(CO)=8e-4 apply to IRAS 06530-0213 for the H2 column-density conversion.
- domain assumption RATRAN's collisional excitation data for CO and HC3N are adequate for the modeled lines.
Cite this review
Pith. "Pith review of Interferometric molecular line observations toward the 21 {\mu}m protoplanetary nebula IRAS 06530-0213." pith.science (2026). https://pith.science/paper/4TVM4DA3
@misc{pith2026260725304,
  author       = {Pith},
  title        = {Pith review of: Interferometric molecular line observations toward the 21 \mum protoplanetary nebula IRAS 06530-0213},
  year         = {2026},
  howpublished = {\url{https://pith.science/paper/4TVM4DA3}},
  note         = {Machine review of arXiv:2607.25304}
}
abstract
The identification of the $21\,\mu\mathrm{m}$ feature in some protoplanetary nebulae remains a longstanding puzzle, whose interpretation requires characterization of the molecular gas environments of associated sources. Here, we present high-resolution interferometric observations from the Northern Extended Millimeter Array toward the $21\,\mu\mathrm{m}$ protoplanetary nebula IRAS 06530-0213. Multiple molecular transitions of $\mathrm{HC_3N}$, $\mathrm{C_4H}$, and $\mathrm{SiC_2}$ are detected and spatially resolved. We analyze these spectral lines alongside previously reported CO and $^{13}\mathrm{CO}$ emission toward this source. Differing from the extended barrel-like molecular structure traced by CO and $^{13}\mathrm{CO}$, $\mathrm{HC_3N}$ and $\mathrm{C_4H}$ are predominantly concentrated in the inner low-latitude equatorial zones. Reproducing the observed morphology requires $\mathrm{HC_3N}$ to possess a more inwardly concentrated abundance distribution compared with CO and $^{13}\mathrm{CO}$, implying that the inner equatorial regions provide favorable conditions for carbon-chain chemistry.
Figures


Figures from the paper (8 more)


Reference graph
Works this paper leans on
-
[1]
2022, in European Physical Journal Web of Conferences, Vol
Ag´ undez, M. 2022, in European Physical Journal Web of Conferences, Vol. 265, European Physical Journal Web of Conferences (EDP), 00029, doi: 10.1051/epjconf/202226500029 Ag´ undez, M., Cernicharo, J., Quintana-Lacaci, G., et al. 2017, A&A, 601, A4, doi: 10.1051/0004-6361/201630274
arXiv 2022
-
[2]
2025, A&A, 699, A216, doi: 10.1051/0004-6361/202554726
Li, X.-H. 2025, A&A, 699, A216, doi: 10.1051/0004-6361/202554726
-
[3]
1995, A&A, 299, 755
Bloecker, T. 1995, A&A, 299, 755
1995
-
[4]
Boersma, C., Bauschlicher, C. W., Allamandola, L. J., et al. 2010, A&A, 511, A32, doi: 10.1051/0004-6361/200912714
-
[5]
2023, A&A, 677, L18, doi: 10.1051/0004-6361/202347686
Bujarrabal, V., Alcolea, J., Castro-Carrizo, A., et al. 2023, A&A, 677, L18, doi: 10.1051/0004-6361/202347686
-
[6]
2001, A&A, 377, 868, doi: 10.1051/0004-6361:20011090
Bujarrabal, V., Castro-Carrizo, A., Alcolea, J., & S´ anchez Contreras, C. 2001, A&A, 377, 868, doi: 10.1051/0004-6361:20011090
-
[7]
2004, ApJL, 608, L41, doi: 10.1086/422170
Cernicharo, J. 2004, ApJL, 608, L41, doi: 10.1086/422170
-
[8]
Cernicharo, J., Heras, A. M., Tielens, A. G. G. M., et al. 2001, ApJL, 546, L123, doi: 10.1086/318871
Show all 47 references
-
[9]
Clark, N., Peeters, E., Cox, N. L. J., et al. 2025, MNRAS, 540, 1984, doi: 10.1093/mnras/staf826
2025 doi
-
[10]
Cox, N. L. J., Pilleri, P., Bern´ e, O., Cernicharo, J., & Joblin, C. 2016, MNRAS, 456, L89, doi: 10.1093/mnrasl/slv184
2016 doi
-
[11]
2019, Nature Astronomy, 3, 408, doi: 10.1038/s41550-019-0703-5
Decin, L., Homan, W., Danilovich, T., et al. 2019, Nature Astronomy, 3, 408, doi: 10.1038/s41550-019-0703-5
2019 doi
-
[12]
Decin, L., Montarg` es, M., Richards, A. M. S., et al. 2020, Science, 369, 1497, doi: 10.1126/science.abb1229
2020 doi
-
[13]
A., & Gesicki, K
Zijlstra, A. A., & Gesicki, K. 2014, MNRAS, 441, 364, doi: 10.1093/mnras/stu454
2014 doi
- [14]
- [15]
-
[16]
Y., te Lintel Hekkert, P., Slijkhuis, F., et al
Hu, J. Y., te Lintel Hekkert, P., Slijkhuis, F., et al. 1994, A&AS, 103, 301
1994
-
[17]
J., Bachiller, R., Cox, P., & Forveille, T
Huggins, P. J., Bachiller, R., Cox, P., & Forveille, T. 1996, A&A, 315, 284
1996
-
[18]
G., Szczerba, R., & Panchuk, V
Klochkova, V. G., Szczerba, R., & Panchuk, V. E. 2000, Astronomy Letters, 26, 88, doi: 10.1134/1.20372
2000 doi
-
[19]
2001, ApJL, 554, L87, doi: 10.1086/320913
Kwok, S., Volk, K., & Bernath, P. 2001, ApJL, 554, L87, doi: 10.1086/320913
2001 doi
-
[20]
M., & Hrivnak, B
Kwok, S., Volk, K. M., & Hrivnak, B. J. 1989, ApJL, 345, L51, doi: 10.1086/185550
1989 doi
-
[21]
2018, Galaxies, 6, 99, doi: 10.3390/galaxies6030099
Lagadec, E. 2018, Galaxies, 6, 99, doi: 10.3390/galaxies6030099
2018 doi
-
[22]
Mishra, A., Li, A., & Jiang, B. W. 2015, ApJ, 802, 39, doi: 10.1088/0004-637X/802/1/39 —. 2016, ApJ, 825, 68, doi: 10.3847/0004-637X/825/1/68 16Sun et al
2015 doi
-
[23]
2009, ApJ, 692, 402, doi: 10.1088/0004-637X/692/1/402
Nakashima, J.-i., Koning, N., Kwok, S., & Zhang, Y. 2009, ApJ, 692, 402, doi: 10.1088/0004-637X/692/1/402
2009 doi
-
[24]
H., et al
Nakashima, J.-i., Koning, N., Volgenau, N. H., et al. 2012, ApJ, 759, 61, doi: 10.1088/0004-637X/759/1/61
2012 doi
-
[25]
R., Cernicharo, J., Goicoechea, J
Pardo, J. R., Cernicharo, J., Goicoechea, J. R., Gu´ elin, M., & Asensio Ramos, A. 2007, ApJ, 661, 250, doi: 10.1086/513734
2007 doi
-
[26]
A., Cho, S.-H., Lee, C
Park, J. A., Cho, S.-H., Lee, C. W., & Yang, J. 2008, AJ, 136, 2350, doi: 10.1088/0004-6256/136/6/2350
2008 doi
-
[27]
2002, A&A, 388, 639, doi: 10.1051/0004-6361:20020416
Pech, C., Joblin, C., & Boissel, P. 2002, A&A, 388, 639, doi: 10.1051/0004-6361:20020416
2002 doi
-
[28]
Peeters, E., Tielens, A. G. G. M., Allamandola, L. J., & Wolfire, M. G. 2012, ApJ, 747, 44, doi: 10.1088/0004-637X/747/1/44
2012 doi
-
[29]
2022, ApJS, 259, 56, doi: 10.3847/1538-4365/ac5180
Qiu, J.-J., Zhang, Y., Zhang, J.-S., & Nakashima, J.-i. 2022, ApJS, 259, 56, doi: 10.3847/1538-4365/ac5180
2022 doi
-
[30]
2024, AJ, 167, 91, doi: 10.3847/1538-3881/ad198f
Qiu, J.-J., Zhang, Y., Nakashima, J.-i., et al. 2024, AJ, 167, 91, doi: 10.3847/1538-3881/ad198f
2024 doi
-
[31]
2014, A&A, 566, A145, doi: 10.1051/0004-6361/201423721
Ramstedt, S., & Olofsson, H. 2014, A&A, 566, A145, doi: 10.1051/0004-6361/201423721
2014 doi
-
[32]
1999, ApJL, 524, L125, doi: 10.1086/312307
Sahai, R. 1999, ApJL, 524, L125, doi: 10.1086/312307
1999 doi
-
[33]
Sahai, R., & Trauger, J. T. 1998, AJ, 116, 1357, doi: 10.1086/300504 S´ anchez Contreras, C., & Sahai, R. 2012, ApJS, 203, 16, doi: 10.1088/0067-0049/203/1/16
1998 doi
-
[34]
J., Stock, D
Shannon, M. J., Stock, D. J., & Peeters, E. 2015, ApJ, 811, 153, doi: 10.1088/0004-637X/811/2/153
2015 doi
-
[35]
2025a, A&A, 696, A102, doi: 10.1051/0004-6361/202452355
Sun, H.-M., Zhang, Y., Ouyang, X.-J., et al. 2025a, A&A, 696, A102, doi: 10.1051/0004-6361/202452355
-
[36]
2025b, AJ, 170, 231, doi: 10.3847/1538-3881/adff85
Sun, H.-M., Zhang, Y., & Qin, S.-L. 2025b, AJ, 170, 231, doi: 10.3847/1538-3881/adff85
-
[37]
Tielens, A. G. G. M. 2008, ARA&A, 46, 289, doi: 10.1146/annurev.astro.46.060407.145211
2008
-
[38]
2024, A&A, 684, A4, doi: 10.1051/0004-6361/202346264 Van de Sande, M., & Millar, T
Unnikrishnan, R., De Beck, E., Nyman, L.- ˚A., et al. 2024, A&A, 684, A4, doi: 10.1051/0004-6361/202346264 Van de Sande, M., & Millar, T. J. 2022, MNRAS, 510, 1204, doi: 10.1093/mnras/stab3282
2024 doi
-
[39]
Vassiliadis, E., & Wood, P. R. 1993, ApJ, 413, 641, doi: 10.1086/173033
1993 doi
-
[40]
C., & Kraemer, K
Volk, K., Sloan, G. C., & Kraemer, K. E. 2020, Ap&SS, 365, 88, doi: 10.1007/s10509-020-03798-2
2020 doi
-
[41]
M., Millar, T
Woods, P. M., Millar, T. J., Herbst, E., & Zijlstra, A. A. 2003, A&A, 402, 189, doi: 10.1051/0004-6361:20030215
2003 doi
-
[42]
2002, ApJL, 574, L167, doi: 10.1086/342503
Herbst, E. 2002, ApJL, 574, L167, doi: 10.1086/342503
2002 doi
-
[43]
2020, ApJ, 898, 151, doi: 10.3847/1538-4357/ab9b80
Zhang, Y. 2020, ApJ, 898, 151, doi: 10.3847/1538-4357/ab9b80
2020 doi
-
[44]
2011, ApJ, 730, 126, doi: 10.1088/0004-637X/730/2/126
Zhang, Y., & Kwok, S. 2011, ApJ, 730, 126, doi: 10.1088/0004-637X/730/2/126
2011 doi
-
[45]
Zhang, Y., Kwok, S., & Hrivnak, B. J. 2010, ApJ, 725, 990, doi: 10.1088/0004-637X/725/1/990 Molecular line observations toward IRAS 06530-021317
2010 doi
-
[46]
2013, ApJ, 773, 71, doi: 10.1088/0004-637X/773/1/71
Zhang, Y., Kwok, S., Nakashima, J.-i., Chau, W., & Dinh-V-Trung. 2013, ApJ, 773, 71, doi: 10.1088/0004-637X/773/1/71
2013 doi
-
[47]
Ziurys, L. M. 2006, Proceedings of the National Academy of Science, 103, 12274, doi: 10.1073/pnas.0602277103 18Sun et al. T able 1.Molecular Line Detections in IRAS 06530−0213 Molecule ID Transition FrequencyI a peak R I dvrms Config. (MHz) (K) (K km s −1) (K) SiC2 JKa,Kc = 94...
2006 doi
Reviewed August 1, 2026 · model on record in the stance chip above.
Discussion (0). Continue with ORCID to comment.