REVIEW 3 major objections 6 minor 46 references
Improving Discrepancy Measures for Global Sensitivity Analysis
T0 review · 3 major / 6 minor · reviewed 2026-07-31 · grok-4.5
Pith's one-line read A cheap scatterplot discrepancy, fixed by ranking the output and filling isolated empty cells, screens total-order importance as well as costly Sobol indices—and alone ranks a non-smooth hydrology model perfectly.
desk verdict Solid equal-cost bake-off and a real HYMOD win; the copula theory is narrower than the abstract’s “consistent screening statistic” line suggests, but the body mostly owns that. read the letter →
The pith
A machine-rendered reading of the paper's core claim, the machinery that carries it, and where it could break.
The reading
What carries the argument
The adjusted ersatz discrepancy: after mapping Y to ranks so the (xi, Y) cloud is an empirical copula, tile [0,1]² into an s×s grid (s ≈ √Ns), then fill empty cells whose Moore neighbourhood is at least half occupied; the measure is one minus the fraction of occupied cells. Copula theory supplies the zero condition, monotone-direction ranking property, full-support ceiling, and the role of imputation in detecting interaction-induced clustering.
What would settle it
Find a smooth, concordance-ordered test function and a sample size where the adjusted ersatz’s Savage-score ranking of inputs systematically disagrees with analytic or high-N Jansen total-order indices, or a non-smooth real model where PCE still outranks it after the same sample budget.
Extended reading notes
Core claim
Rank-transforming the output before gridding and imputing isolated empty cells via a 50% Moore-neighbourhood rule turns the ersatz discrepancy into a consistent bivariate screening statistic for Sobol’ total-order importance: it has a zero condition under independence, an explicit full-support ceiling that limits magnitude estimation, a documented failure mode for pure interaction dependence, and is the only equal-cost estimator that achieves perfect Savage-score rank agreement on the non-smooth HYMOD hydrological output where polynomial chaos is misspecified.
Load-bearing premise
The claim that higher total-order importance yields a higher expected adjusted ersatz holds only when the inputs’ dependence structures belong to a concordance-ordered copula family, which the paper itself says is not universal.
Editorial extensions
If this is right
- When model form is unknown or non-smooth, the adjusted ersatz is the preferred equal-cost screener over PCE/Shapley for separating influential from non-influential inputs.
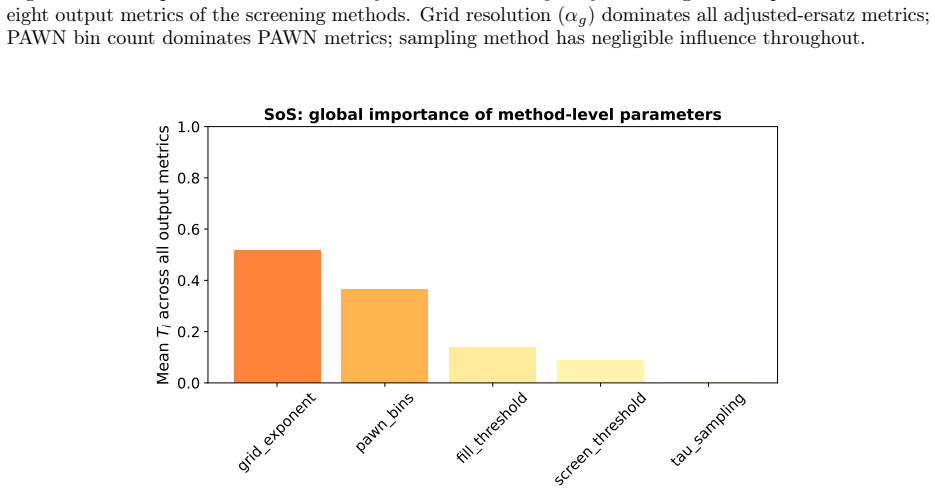
- Practitioners should tune grid resolution (around s = ⌈√Ns⌉) first; the 50% fill threshold and quasi- versus pseudo-random sampling matter far less.
- The measure should be reported as a rank/screening tool, not as a numerical stand-in for Ti, because of the full-support ceiling.
- Pure interaction effects invisible to any bivariate (xi, Y) copula remain a structural blind spot, motivating trivariate grid extensions.
- On smooth continuous problems that match a polynomial basis, PCE and Shapley still give tighter magnitude estimates at the same sample cost.
Reading between the lines
- The same rank-plus-impute pipeline could be dropped into existing visual GSA dashboards as a live “importance heat” on scatterplots without extra model runs.
- Because grid resolution dominates, adaptive or anisotropic grids (finer where the copula mass concentrates) are a natural next control variable the paper leaves open.
- The documented additive-modular counterexample suggests any purely pairwise dependence measure in GSA will share this failure mode; the paper’s trivariate hint generalizes beyond discrepancy methods.
Editorial analysis
A structured set of objections, weighed in public.
Referee Report
Summary. The paper proposes an adjusted ersatz discrepancy for global sensitivity screening: rank-transform the output before gridding the (xi,Y) plane, then impute isolated empty cells by a 50% Moore-neighbourhood rule. Relative to the original S-ersatz of Puy et al. (2024), the authors claim substantially better agreement with Sobol’ total-order indices Ti. Via a copula argument (proofs in supplement) they assert a zero condition under independence, a full-support ceiling that precludes consistent magnitude estimation, a monotone-direction property inside concordance-ordered copula families, and a bivariate failure mode for purely interaction-mediated dependence (additive-modular). They benchmark the adjusted measure at equal sample cost against PCE Ti, PCE-derived Shapley effects, and a PAWN(max-KS) index on seven test functions plus HYMOD, and run a joint Sobol’ sensitivity analysis of five algorithmic knobs. Headline empirical result: only the adjusted ersatz attains perfect Savage-score rank agreement on non-smooth HYMOD where PCE is misspecified; grid resolution, not the fill threshold or sampling method, dominates performance variability.
Significance. If the adjusted measure is a reliable, cheap, distribution-free screener with transparent scatterplot interpretation, the contribution is practically useful for early-stage model development and for non-smooth or mixed-input models where polynomial surrogates fail. Strengths that should be credited: (i) equal-cost bake-off against three independent data-given comparators; (ii) analytical or large-N Jansen reference Ti, so the comparison is not circular; (iii) 512 Becker metafunction configurations plus nested convergence curves; (iv) a joint (not OAT) sensitivity-of-SA design that cleanly identifies grid resolution as the dominant knob; (v) explicit documentation of a structural bivariate failure mode rather than silent omission. The copula framing and the HYMOD result are the two pieces most likely to be cited. The significance is primarily methodological and empirical; the theoretical package as currently written does not yet deliver a general Ti-ranking theorem.
major comments (3)
- [Abstract; §2.3] Abstract and §2.3 overstate what is proved. The abstract’s phrase “consistent screening statistic with a zero condition, an explicit full-support ceiling…” packages three results that, taken together, do not underwrite general Ti-rank agreement. §2.3 shows: (i) Ti=0 ⇒ S_adjusted → 0; (ii) for any full-support copula, E[S]→0 as Ns→∞ regardless of Ti; (iii) monotone direction only inside concordance-ordered families, explicitly “not universal,” plus the additive-modular counterexample where Ti=1 but the bivariate copula is Π. (i)+(ii) imply that under typical non-singular dependence both null and non-null inputs share the same asymptotic limit; discrimination is therefore a finite-sample rate phenomenon. No convergence rate, local power, or separation result under H1 appears in the main text. Please either supply a finite-sample / rate result that justifies ranking at the Ns used in the ba
- [§2.3; §2.2] The claim that Moore-neighbourhood imputation “extends sensitivity from Si towards Ti” for pure interaction effects (§2.3, fourth result; also Algorithm 1 and the discussion of residual holes in Fig. 5) is load-bearing for calling the measure a total-order screener, yet it is asserted via the unseen Proof and is already void in the documented modular counterexample (bivariate copula = Π). The main text should state precisely under which interaction structures the 50% rule yields a strictly positive ersatz when Si=0 but Ti>0, give at least one fully worked analytic or numerical pure-interaction example in the main text (not only the modular failure), and clarify that the extension is heuristic outside those structures. Without that, the total-order interpretation rests almost entirely on the empirical tables.
- [§3.2–§3.4; §3.6; Tables 2–7, 11; Figure 6] Tables 2–7 and 11 report ρ, MAE, α, β at Ns=2^9 for a single scrambled Sobol’ design per function. For the central comparative claims (e.g. adjusted ersatz ρ=1.000 on HYMOD; PCE β=0.333 on Ishigami; Multiverse PCE collapse), please report variability over independent scramblings or bootstrap resampling of the design, or justify why a single trajectory is sufficient. The convergence panel (Fig. 6) shows paths but not uncertainty bands; Ishigami’s oscillation between ρ=0.143 and 1.000 is attributed to a k=3 discrete-correlation artefact, which makes single-run ρ especially fragile there. A short multi-seed summary (median/IQR of ρ) would make the bake-off reproducible and proportionate to the strength of the wording in §3.6 and the abstract.
minor comments (6)
- [Throughout] Notation switches between S_ersatz, S_adjusted_ersatz, Sad justed_ersatz, and “adjusted ersatz” across abstract, Algorithm 1, and tables. Pick one symbol and use it consistently.
- [Figure 6; §3.6] Figure 6 is dense (14 panels); the HYMOD row is the headline result and is easy to miss. Consider calling out HYMOD in the caption more prominently or moving a single HYMOD ρ/MAE panel into the main discussion figure set.
- [§2.4; §3.3; §3.6] PAWN(max-KS) is correctly disclaimed as non-canonical (equal-width bins, max not median). Add one sentence on how sensitive Multiverse/HYMOD conclusions are if median-KS or quantile bins were used, or state that this was not checked.
- [Table 1; Figure 6] Table 1 “Play model” appears in Fig. 6 but is not defined in the table’s Saltelli & Lachi row; align names (Multiverse vs Play model).
- [Data availability statement] Data availability is “Blinded for Review Purposes.” For the revision, ensure code for Algorithm 1, the five estimators, and the SoS design is actually deposited; the joint SoS claim is only as strong as that reproducibility.
- [Abstract] Minor prose: “well-foundedbutcomputationallydemanding” and similar missing spaces in the abstract block suggest a line-break artefact; clean for production.
Circularity Check
No significant circularity: adjusted ersatz is independently defined; copula properties and external Ti/comparators do not force the claimed rankings by construction.
full rationale
The adjusted ersatz is defined operationally (rank-transform Y, s×s gridding, Moore-neighbourhood imputation, then 1−Np/NT) without reference to Ti. Section 2.3 then derives limited properties of that object via copulas—zero condition under independence, full-support asymptotic ceiling, monotone direction only inside concordance-ordered families, and an explicit bivariate failure mode—not an identity S≡Ti. Reference total-order indices are analytical or Jansen at N=2^14–2^15, external to the screening sample. PCE, Shapley, and PAWN(max-KS) are independent equal-cost estimators. Benchmarks (Tables 2–11, Becker ensemble, HYMOD) are empirical comparisons, not fitted targets renamed as predictions. Citation of Puy et al. (2024) is ordinary methodological lineage for the unadjusted measure being improved; it is not a uniqueness theorem or load-bearing premise that forces the new claims. The 50% fill rule is argued from limiting cases and then varied in a joint SoS design rather than tuned to match Ti on the reported tables. Nothing in the derivation chain reduces the headline screening/rank results to inputs by construction.
Assumptions & free parameters
free parameters (3)
- imputation_threshold =
0.5
- grid_resolution_exponent_alpha_g =
0.5 (default s=⌈√Ns⌉)
- screening_thresholds_for_alpha_beta =
0.01, 0.05, 0.10
assumptions (6)
- standard math Sklar's theorem and uniform consistency of the empirical copula (Deheuvels; Fermanian et al.) so rank-transformed (xi,Y) samples converge to Ci
- domain assumption Model inputs are mutually independent when interpreting Ti and the zero condition xi ⊥ Y ⇒ Ti=0
- standard math Independence copula uniquely maximizes expected grid coverage (via Jensen on strictly concave cell-occupation probability)
- domain assumption Monotone-direction property holds when copulas are concordance-ordered (Gaussian/Clayton/Gumbel/Frank families)
- ad hoc to paper Moore-neighbourhood 50% rule extends sensitivity from first-order toward total-order by propagating interaction-induced local clustering
- domain assumption PCE on a Legendre basis with adaptive order reduction is a fair equal-cost total-order comparator on the same design
invented entities (2)
-
Adjusted ersatz discrepancy S_adjusted_ersatz
independent evidence
-
PAWN(max-KS) comparator variant
Cite this review
Pith. "Pith review of Improving Discrepancy Measures for Global Sensitivity Analysis." pith.science (2026). https://pith.science/paper/DOLHGXJK
@misc{pith2026260728252,
  author       = {Pith},
  title        = {Pith review of: Improving Discrepancy Measures for Global Sensitivity Analysis},
  year         = {2026},
  howpublished = {\url{https://pith.science/paper/DOLHGXJK}},
  note         = {Machine review of arXiv:2607.28252}
}
abstract
Sensitivity analysis methods based on Sobol' total-order indices ($T_i$) are well-founded but computationally demanding. A recently proposed ersatz discrepancy measure offers a cheaper alternative by quantifying deviations from uniformity in input--output scatterplots, yet lacks theoretical grounding and has not been benchmarked against other data-given estimators. We introduce an adjusted ersatz discrepancy that rank-transforms the output before gridding and imputes isolated empty cells via a Moore-neighbourhood rule, substantially improving agreement with $T_i$. We prove, via a copula-theoretic argument, that the adjustment is a consistent screening statistic with a zero condition, an explicit full-support ceiling bounding its use as a magnitude estimator, and a documented failure mode for purely interaction-mediated dependencies. We benchmark the adjusted ersatz against three zero-extra-cost comparators -- polynomial chaos expansion (PCE), PCE-derived Shapley effects, and a PAWN-type maximum Kolmogorov--Smirnov index -- across seven benchmark functions and a real-world hydrological model. The adjusted ersatz is the only estimator achieving perfect rank agreement on a non-smooth hydrological output where PCE is misspecified. A joint sensitivity analysis of five algorithmic parameters shows grid resolution, not the imputation threshold or sampling method, drives performance variability.
Figures


Figures from the paper (6 more)


Reference graph
Works this paper leans on
-
[1]
Reliability Engineering & System Safety , volume=
Importance measures in global sensitivity analysis of nonlinear models , author=. Reliability Engineering & System Safety , volume=. 1996 , publisher=
1996
-
[2]
Reliability Engineering & System Safety , volume=
The identification of model effective dimensions using global sensitivity analysis , author=. Reliability Engineering & System Safety , volume=. 2011 , publisher=
2011
-
[3]
Reliability Engineering & System Safety , volume=
Random forests for global sensitivity analysis: A selective review , author=. Reliability Engineering & System Safety , volume=. 2021 , publisher=
2021
-
[4]
Journal of hydrology , volume=
River flow forecasting through conceptual models part I—A discussion of principles , author=. Journal of hydrology , volume=. 1970 , publisher=
1970
-
[5]
Water Resources Research , volume=
VISCOUS: A variance-based sensitivity analysis using copulas for efficient identification of dominant hydrological processes , author=. Water Resources Research , volume=. 2021 , publisher=
2021
-
[6]
Environmental Modelling & Software , volume=
The future of sensitivity analysis: an essential discipline for systems modeling and policy support , author=. Environmental Modelling & Software , volume=. 2021 , publisher=
2021
-
[7]
Geophysical Research Letters , volume=
A fresh look at variography: Measuring dependence and possible sensitivities across geophysical systems from any given data , author=. Geophysical Research Letters , volume=. 2020 , publisher=
2020
-
[8]
Water resources research , volume=
A Shuffled Complex Evolution Metropolis algorithm for optimization and uncertainty assessment of hydrologic model parameters , author=. Water resources research , volume=. 2003 , publisher=
2003
Show all 46 references
-
[9]
Hydrology and Earth System Sciences , volume=
A framework for development and application of hydrological models , author=. Hydrology and Earth System Sciences , volume=. 2001 , publisher=
2001
-
[10]
Water Resources Research , volume=
Toward improved calibration of hydrologic models: Combining the strengths of manual and automatic methods , author=. Water Resources Research , volume=. 2000 , publisher=
2000
-
[11]
Environmental modelling & software , volume=
Progressive Latin Hypercube Sampling: An efficient approach for robust sampling-based analysis of environmental models , author=. Environmental modelling & software , volume=. 2017 , publisher=
2017
-
[12]
and Andres, T
Saltelli, Andrea and Ratto, M. and Andres, T. H. and Campolongo, F. and Cariboni, J. and Gatelli, D. and Saisana, M. and Tarantola, S. , year=. Global sensitivity analysis: the primer , ISBN=
-
[13]
arXiv preprint arXiv:1505.02350 , year=
Exploring multi-dimensional spaces: A comparison of Latin hypercube and quasi Monte Carlo sampling techniques , author=. arXiv preprint arXiv:1505.02350 , year=
-
[14]
1994 , publisher=
A primer for the Monte Carlo method , author=. 1994 , publisher=
1994
-
[15]
Statistical Methods & Applications , volume=
Robustification of structural equation modelling via global sensitivity analysis , author=. Statistical Methods & Applications , volume=. 2025 , publisher=
2025
-
[16]
International Review of Applied Economics , pages=
Mathematical models: a state of exception , author=. International Review of Applied Economics , pages=. 2024 , publisher=
2024
-
[17]
Numbers between science and policy , publisher=
The politics of modelling. Numbers between science and policy , publisher=. 2023 , editor=
2023
-
[18]
Humanities and Social Sciences Communications , author=
What Can Mathematical Modelling Contribute to a Sociology of Quantification? , volume=. Humanities and Social Sciences Communications , author=. 2023 , language=. doi:10.2139/ssrn.4212453 , number=
2023 doi
-
[19]
Ratings and rankings: voodoo or science? , volume=
Paruolo, Paolo and Saisana, Michaela and Saltelli, Andrea , year=. Ratings and rankings: voodoo or science? , volume=. Journal of the Royal Statistical Society: Series A (Statistics in Society) , publisher=. doi:10.1111/j.1467-985X.2012.01059.x , number=
2012 arXiv
-
[20]
Technometrics , volume=
Discrepancy measures for global sensitivity analysis , author=. Technometrics , volume=. 2024 , publisher=
2024
-
[21]
ACM Transactions on Mathematical Software (TOMS) , volume=
Algorithm 659: Implementing Sobol's quasirandom sequence generator , author=. ACM Transactions on Mathematical Software (TOMS) , volume=. 1988 , publisher=
1988
-
[22]
ACM Transactions on Modeling and Computer Simulation (TOMACS) , volume=
Implementation and tests of low-discrepancy sequences , author=. ACM Transactions on Modeling and Computer Simulation (TOMACS) , volume=. 1992 , publisher=
1992
-
[23]
[1990] Proceedings
An importance quantification technique in uncertainty analysis for computer models , author=. [1990] Proceedings. First international symposium on uncertainty modeling and analysis , pages=. 1990 , organization=
1990
-
[24]
Journal of the Royal Statistical Society Series B: Statistical Methodology , volume=
Probabilistic sensitivity analysis of complex models: a Bayesian approach , author=. Journal of the Royal Statistical Society Series B: Statistical Methodology , volume=. 2004 , publisher=
2004
-
[25]
Mathematics and computers in simulation , volume=
On quasi-monte carlo integrations , author=. Mathematics and computers in simulation , volume=. 1998 , publisher=
1998
-
[26]
Monte Carlo and Quasi-Monte Carlo Methods in Scientific Computing: Proceedings of a conference at the University of Nevada, Las Vegas, Nevada, USA, June 23--25, 1994 , pages=
Randomly permuted (t, m, s)-nets and (t, s)-sequences , author=. Monte Carlo and Quasi-Monte Carlo Methods in Scientific Computing: Proceedings of a conference at the University of Nevada, Las Vegas, Nevada, USA, June 23--25, 1994 , pages=. 1995 , organization=
1994
-
[27]
Journal of Risk , volume=
The Importance of Being Scrambled: Supercharged Quasi-Monte Carl , author=. Journal of Risk , volume=
-
[28]
Statistics for
Modelling of the modelling process for sustainable development , author=. Statistics for. 2025 , language =
2025
-
[29]
2024 , language=
Human Development Index , journal=. 2024 , language=
2024
-
[30]
Uniformly distributed sequences with an additional uniform property , volume =. U.S.S.R. Comput. Maths. Math. Phys. , author =. 1976 , pages =
1976
-
[31]
, volume =
A comprehensive comparison of total-order estimators for global sensitivity analysis. , volume =. International Journal for Uncertainty Quantification , author =. 2022 , note =. doi:10.1615/Int.J.UncertaintyQuantification.2021038133 , abstract =
2022 doi
-
[32]
Reliability Engineering & System Safety , author =
Metafunctions for benchmarking in sensitivity analysis , volume =. Reliability Engineering & System Safety , author =. 2020 , keywords =. doi:10.1016/j.ress.2020.107189 , abstract =
2020
-
[33]
Environmental Modelling & Software , author =
A sensitivity analysis of the. Environmental Modelling & Software , author =
-
[34]
Saltelli, Andrea and Lachi, Alessio and Puy, Arnald and Breznau, Nate , editor =. Global. Statistics for. 2025 , keywords =. doi:10.1007/978-3-031-96033-8_49 , abstract =
2025 doi
-
[35]
Computer Physics Communications , author =
Variance based sensitivity analysis of model output. Computer Physics Communications , author =. 2010 , pages =. doi:10.1016/j.cpc.2009.09.018 , number =
2010 doi
-
[36]
Reliability Engineering & System Safety , author =
Global sensitivity analysis using polynomial chaos expansions , volume =. Reliability Engineering & System Safety , author =. 2008 , keywords =. doi:10.1016/j.ress.2007.04.002 , abstract =
2008 doi
-
[37]
Mathematical
Gardner, Martin , year =. Mathematical. Scientific American , publisher =
-
[38]
Jansen, Michiel J. W. , title =. Computer Physics Communications , year =
-
[39]
Environmental Modelling & Software , year =
Pianosi, Francesca and Wagener, Thorsten , title =. Environmental Modelling & Software , year =
-
[40]
Annals of Mathematical Statistics , year =
Hoeffding, Wassily , title =. Annals of Mathematical Statistics , year =
-
[41]
Publications de l'Institut de Statistique de l'Universit
Sklar, Abe , title =. Publications de l'Institut de Statistique de l'Universit. 1959 , volume =
1959
-
[42]
Deheuvels, Paul , title =. Acad. 1979 , volume =
1979
-
[43]
Weak convergence of empirical copula processes , journal =
Fermanian, Jean-David and Radulovi. Weak convergence of empirical copula processes , journal =. 2004 , volume =
2004
-
[44]
Global sensitivity analysis with dependence measures , journal =
Da Veiga, S. Global sensitivity analysis with dependence measures , journal =. 2015 , volume =
2015
-
[45]
, title =
Owen, Art B. , title =. SIAM/ASA Journal on Uncertainty Quantification , year =
-
[46]
and Staum, Jeremy , title =
Song, Eunhye and Nelson, Barry L. and Staum, Jeremy , title =. SIAM/ASA Journal on Uncertainty Quantification , year =
Reviewed July 31, 2026 · model on record in the stance chip above.
Discussion (0). Continue with ORCID to comment.