REVIEW 3 major objections 4 minor 91 references
Variations in the 3.3 ${\mu}$m Polycyclic Aromatic Hydrocarbon Feature Across Nearby Galaxies Driven by Metallicity and Radiation Field Spectrum
T0 review · 3 major / 4 minor · reviewed 2026-08-08 · deepseek-v4-flash
Pith's one-line read The paper shows that the 3.3 µm PAH feature strengthens at low metallicity because PAHs are smaller, not just hotter.
desk verdict Solid, useful methods-plus-survey paper; the metallicity trend is probably real, but the variable-B_PAH continuum subtraction and the trend are entangled enough that the authors should show a fixed-B control before the slopes are taken at face value. read the letter →
The pith
A machine-rendered reading of the paper's core claim, the machinery that carries it, and where it could break.
The reading
What carries the argument
The central object is the color-color slope $B_{\rm PAH}$, the slope of $F335M/F300M$ versus $F360M/F300M$ in PAH-dominated pixels selected by $F300M/F1130W<0.1$ and $F1130W>3$ MJy/sr. This slope parameterizes how much PAH-correlated emission contaminates the F360M continuum band, and the paper measures it per galaxy and per 1.5 kpc region, finding values from about 1.6 to above 2 that track specific star formation rate and the optical line ratio $[\mathrm{NII}]/\mathrm{H}\alpha$. The slope is inserted into a linear continuum relation derived from earlier F335M subtraction work to make continuum-subtracted F335M maps, which are then ratioed against stellar-subtracted F770W and F1130W maps. The second load-bearing ingredient is a grid of dust models with small, standard, and large PAH size distributions, low, standard, and high ionization, and several radiation field spectra; this grid lets the authors read ratio changes as PAH size changes rather than radiation temperature changes.
What would settle it
Take a low-metallicity galaxy or region and obtain a JWST NIRSpec spectrum across 3.2–3.6 µm alongside F300M/F335M/F360M photometry; if the aliphatic and plateau features do not scale with the 3.3 µm feature according to the paper's $B_{\rm PAH}$ prescription, the continuum-subtracted F335M maps are biased and the metallicity trend could shift. Alternatively, if a radiation field model with fixed PAH sizes can reproduce the full increase in 3.3/11.3 with decreasing metallicity, the size interpretation would fail.
Extended reading notes
Core claim
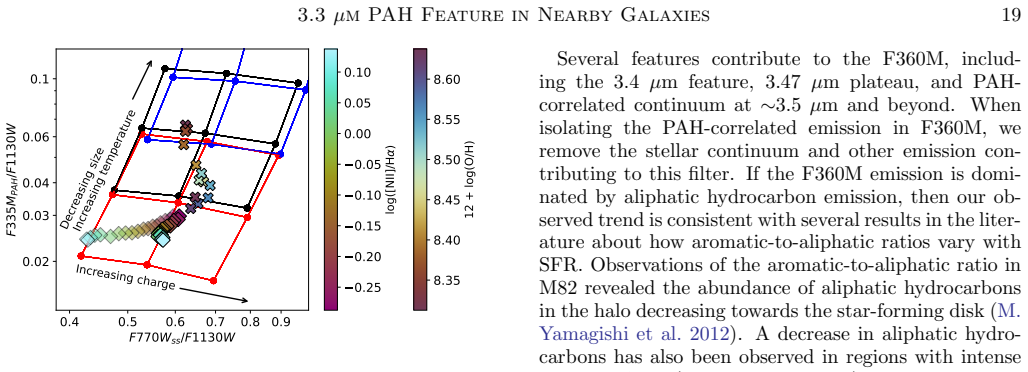
The paper's central claim is that the relative strength of the 3.3 µm PAH emission compared to longer-wavelength PAH bands increases toward low gas-phase metallicity, and the dominant cause is a shift to smaller PAH populations rather than a change in the spectrum of the heating radiation. The observed slopes are $y=-1.00\pm0.08\,x+7.07\pm0.69$ for $F335M_{\rm PAH}/F1130W$ (3.3/11.3) and $y=-0.85\pm0.08\,x+5.97\pm0.71$ for $F335M_{\rm PAH}/F770W_{\rm ss}$ (3.3/7.7), with $x=12+\log(\mathrm{O/H})$. Stellar population synthesis models are used to show that metallicity-driven changes in the radiation field spectrum would change the 3.3/11.3 ratio by only about 1.15%, too small to explain the trend. Binning by position in a Baldwin-Phillips-Terlevich (BPT) diagram separates a metallicity sequence in star-forming regions from a radiation-field-hardness sequence in LINER/AGN regions, so both effects operate, but the metallicity-to-size link dominates the 3.3/11.3 ratio.
Load-bearing premise
The method assumes that the F335M/F300M versus F360M/F300M colors of PAH-dominated pixels follow a single straight line in each region whose slope $B_{\rm PAH}$ fully describes the PAH-correlated and stellar emission, so any F360M emission component (aliphatic features, 3.47 µm plateau, PAH continuum) that does not scale linearly with the 3.3 µm PAH emission is correctly removed.
Editorial extensions
If this is right
- The 3.3/11.3 µm ratio is not a pure PAH-size tracer: at fixed high metallicity it responds to radiation field hardness, while across the full metallicity range the size signal dominates.
- Continuum-subtracted 3.3 µm maps should use an environment-dependent $B_{\rm PAH}$; using a single fixed slope changes F335M PAH fluxes by up to 21% in high-specific-star-formation regions.
- Lower-metallicity galaxies such as those reaching $12+\log(\mathrm{O/H})\lesssim8.4$ should show enhanced 3.3/7.7 and 3.3/11.3 ratios, matching the outlying radial profiles of IC 5332, NGC 2835, and NGC 5068.
- The metallicity trend supports the inhibited-growth scenario for PAH formation, in which the average PAH size decreases where carbon abundance limits growth, rather than destruction of small grains.
- In AGN/LINER regions, the radiation field remains important: the 7.7/11.3 ratio shifts toward neutral PAHs or older stellar populations, and removing AGN hosts weakens that shift.
Reading between the lines
- A testable implication left implicit is that the weaker F360M PAH-correlated carriers (aliphatic 3.4 µm feature, 3.47 µm plateau, and PAH continuum) are suppressed in active star formation; NIRSpec spectra of high-sSFR PAH-dominated pixels should show a lower 3.4/3.3 ratio than quiescent pixels.
- If $B_{\rm PAH}$ correlates with specific star formation rate, applying a single global slope to distant galaxies with different sSFR distributions could mimic or hide a metallicity trend; the paper's [NII]/Hα and WISE-based prescriptions give a way to propagate that systematic.
- The nearly vertical motion in 3.3/11.3 versus 7.7/11.3 space at low metallicity suggests the 3.3/11.3 ratio is a sensitive small-PAH fraction indicator even when 7.7/11.3 changes little; measuring it in galaxies below the metallicity of the current sample could test whether the trend saturates.
- Because the same $B_{\rm PAH}$ recipe is used to build the maps, any environmental variation in the F360M contamination is partly built into the reported ratios; comparing the annular and galaxy-wide map versions brackets this systematic.
Editorial analysis
A structured set of objections, weighed in public.
Referee Report
Summary. This manuscript presents an empirical method to isolate PAH-correlated emission in the JWST NIRCam F335M filter using F300M and F360M continuum subtraction, and applies it to 19 PHANGS galaxies. The authors introduce an environment-dependent slope B_PAH in the F335M/F300M versus F360M/F300M color plane, show that this slope correlates with sSFR and [NII]/Halpha, and use it to construct continuum-subtracted F335M maps. They then measure 3.3/7.7 and 3.3/11.3 micron band ratios as functions of metallicity, galactocentric radius, and optical-line ratios. The central claim is that the 3.3 micron feature strengthens relative to 7.7 and 11.3 micron at low metallicity, implying smaller PAH populations, with radiation field spectrum playing a secondary, separable role.
Significance. The 3.3 micron PAH feature is a promising high-resolution ISM tracer, and this is one of the first systematic, sample-wide studies using the NIRCam medium-band method. The paper is well positioned: it includes 19 galaxies, forward-modeling tests of the slope-recovery bias, an explicit treatment of the environmental dependence of B_PAH, and comparisons to established PAH models (Draine et al. 2021) and stellar population synthesis. If the metallicity trend survives a control for the continuum-subtraction systematics, it will be an important confirmation of inhibited PAH growth at low metallicity. The main limitation is the entanglement between the variable B_PAH used to construct the maps and the environmental trends the maps are used to measure.
major comments (3)
- [Section 3.5 / Table 2 / Fig. 7] The F335M_PAH maps used to measure the metallicity trends are produced with a region-dependent B_PAH through Eqs. (3)-(6), and Table 2 shows that B_PAH itself correlates with 12+log(O/H) (rho = -0.28, p << 0.03). The 2-5% difference between the annular and galaxy-wide map versions does not control for this, because the galaxy-wide version still uses per-galaxy B_PAH values that vary with metallicity (Table 1 lists B_PAH ~1.94 for NGC 2835 and ~1.96 for NGC 5068, two of the low-metallicity galaxies that drive the trend in Fig. 7). The paper should re-measure the slopes in Fig. 7 using a fixed, spectroscopically calibrated B_PAH (e.g., the Lai et al. 2020 value or a sample-wide constant) to show that the reported slopes (-1.00 +/- 0.08 and -0.85 +/- 0.08) are not imprinted by the subtraction recipe.
- [Section 3.3 / Eqs. (3)-(6)] The method assumes that all PAH-correlated emission in F360M scales linearly with F335M_PAH, so that a single color-color slope B_PAH captures the 3.4 micron aliphatic feature, the 3.47 micron plateau, and the PAH continuum. Section 5.1 explicitly acknowledges that these components are not separated and may vary with environment. The forward-model test in Section 3.3 is built on the same linearity assumption (model F335M from F1130W and F360M from B_PAH), so it cannot validate that assumption. A spectroscopic check (e.g., NIRSpec or PAHFIT-based synthetic photometry like Appendix E, applied to representative pixels spanning the environmental range) is needed to confirm that the F360M PAH-correlated component is proportional to F335M_PAH and to quantify how much an environmental variation in the 3.4 micron or plateau features biases the subtracted maps.
- [Section 5.2] The argument that metallicity-dependent radiation field spectral changes are too small to explain the observed trend rests on an FSPS calculation that is not fully specified: the text states that a 0.135 dex change in FUV-optical slope 'corresponds to' a ~1.15% change in 3.3/11.3, but the mapping from the stellar population slope to the PAH band ratio is not shown or accompanied by uncertainties. Because this calculation is load-bearing for the 'primarily PAH size' interpretation, the manuscript should either provide the synthetic-photometry details and the Draine et al. (2021) grid interpolation, or downgrade the claim to 'the stellar-population radiation field change is modest compared to the observed dynamic range'.
minor comments (4)
- [Section 6, item 1] There is a duplicate word in 'a new method to to isolate the PAH emission'.
- [Acknowledgments] 'Humbolt Research Award' should be 'Humboldt Research Award'.
- [Table 3] The table header 'Spearman (rho,p)' followed by two numeric columns is ambiguous; the reader must infer which column corresponds to 3.3/11.3 and which to 3.3/7.7, so the header should explicitly label both ratio columns.
- [Appendix B / main text] Equation references in Appendix B ('Equation B1', 'Equation B2') are styled inconsistently with the numbered equations in the main text; unify the formatting.
Circularity Check
No significant circularity: the metallicity trends are measured from maps, not constructed from the fitted B_PAH slope, and the sign of B_PAH's effect opposes the observed trend.
full rationale
I find no circular derivation. The central result, the decrease of 3.3/11.3 and 3.3/7.7 with increasing metallicity (Figure 7), is an observed correlation between independently constructed maps: F335M_PAH comes from Equations 3-6, F1130W is a direct MIRI measurement, and F770Wss is stellar-subtracted via a separate CIGALE-based procedure. The variable B_PAH slope is an empirical calibration quantity, measured from PAH-dominated pixels (F1130W > 3 MJy/sr, F300M/F1130W < 0.1) and then used to build the F335M_PAH maps; the band ratios are not fit to metallicity through B_PAH. Moreover, algebraically F335M_PAH/F300M = B_PAH * (y_m - A_L20 - B_L20 x_m)/(B_PAH - B_L20), which is a decreasing function of B_PAH for fixed observed colors. Since B_PAH correlates negatively with metallicity (Table 2, rho = -0.28), low-metallicity regions tend to have larger B_PAH, which would suppress F335M_PAH rather than create the observed low-metallicity enhancement. Thus the reported metallicity trend is not manufactured by the variable-B_PAH subtraction; if anything, the slopes in Figure 7 are likely conservative. The paper explicitly compares annular and galaxy-wide B_PAH versions, reporting 2-5% average map differences, and uses this as an error term. The method builds on Lai et al. (2020) and Sandstrom et al. (2023), but B_PAH is refit to the present 19-galaxy sample, and the physical interpretation relies on external Draine et al. (2021) model grids and FSPS stellar-population synthesis, not on a self-citation chain. The paper's own admission that spectroscopy is needed to identify which F360M features drive B_PAH variation is a stated limitation, not evidence of circularity.
Assumptions & free parameters
free parameters (5)
- B_PAH slope (per 1.5 kpc region and per galaxy) =
median 1.76, 16th-84th percentile 1.57-1.92 on 1.5 kpc scales
- Color cut thresholds (F300M/F1130W < 0.1 and F1130W > 3 MJy/sr) =
0.1 and 3 MJy/sr
- Stellar contamination coefficient 0.88 for F335M-F300M subtraction in Cycle 2 galaxies =
0.88
- Continuum slope parameters from Lai et al. (2020), A_L20=0.35 and B_L20=0.65 =
A_L20 = 0.35, B_L20 = 0.65
- AGN host list (NGC 1365, NGC 1672, NGC 4303, NGC 7496) =
four galaxies
assumptions (5)
- domain assumption The stellar continuum between F300M and F360M is a linear function in color-color space, as in Lai et al. (2020).
- domain assumption PAH-correlated emission in F335M and F360M follows a linear scaling in color-color space with a single slope B_PAH.
- domain assumption The F1130W filter trace is a valid PAH-selection tool and its >3 MJy/sr cut picks out PAH-dominated lines of sight rather than hot dust or other emission.
- domain assumption Draine et al. (2021) PAH emission models correctly predict band ratios for various sizes, charges, and radiation fields, including the 3.3 micron feature cross-section.
- domain assumption Optical line ratios such as [NII]/Halpha trace radiation field hardness independently of metallicity.
Cite this review
Pith. "Pith review of Variations in the 3.3 ${\mu}$m Polycyclic Aromatic Hydrocarbon Feature Across Nearby Galaxies Driven by Metallicity and Radiation Field Spectrum." pith.science (2026). https://pith.science/paper/ATUD6TC6
@misc{pith2026260805286,
  author       = {Pith},
  title        = {Pith review of: Variations in the 3.3 $\mu$m Polycyclic Aromatic Hydrocarbon Feature Across Nearby Galaxies Driven by Metallicity and Radiation Field Spectrum},
  year         = {2026},
  howpublished = {\url{https://pith.science/paper/ATUD6TC6}},
  note         = {Machine review of arXiv:2608.05286}
}
abstract
We use JWST NIRCam imaging to investigate the 3.3 ${\mu}$m polycyclic aromatic hydrocarbon (PAH) feature in nearby galaxies. NIRCam observations of the 3.3 ${\mu}$m feature are emerging as a powerful tool for studying the structure of the interstellar medium (ISM) and the conditions of the dust at ~0".1 resolution. These maps require accurate subtraction of the underlying continuum emission. We present an empirical method to isolate the PAH-correlated emission in the F335M filter using the F300M and F360M filters for continuum subtraction. We find that the slope of the F335M/F300M versus F360M/F300M colors for PAH-correlated emission shows a dependence on local ISM properties, with the strongest dependence on specific star formation rate. Weaker emission features captured by these bands appear suppressed relative to the main 3.3 ${\mu}$m feature in regions of active star formation. We find trends in the 3.3/7.7 and 3.3/11.3 ${\mu}$m ratios that suggest changes in PAH size, charge, and heating by a varying radiation field spectrum. We find decreases in both band ratios with increasing metallicity, which we attribute to a shift to smaller PAH populations at low metallicity. Comparison to optical ionized gas line ratios and dust models show that variations in the interstellar radiation field spectrum influence the PAH feature ratios. This analysis supports inhibited growth formation scenarios for the observed PAH band ratio trends with metallicity and emphasizes the importance of considering the local radiation field characteristics and gas-phase metallicity when using these band ratios as PAH property diagnostics.
Figures


Figures from the paper (21 more)




Reference graph
Works this paper leans on
-
[1]
Allamandola, L. J., Boersma, C., Lee, T. J., Bregman, J. D., & Temi, P. 2021, ApJL, 917, L35, doi: 10.3847/2041-8213/ac17f0
-
[2]
Allamandola, L. J., Hudgins, D. M., & Sandford, S. A. 1999, ApJL, 511, L115, doi: 10.1086/311843
doi:10.1086/311843 1999
-
[3]
Allamandola, L. J., Tielens, A. G. G. M., & Barker, J. R. 1989, ApJS, 71, 733, doi: 10.1086/191396
doi:10.1086/191396 1989
-
[4]
Anand, G. S., Lee, J. C., Van Dyk, S. D., et al. 2021, MNRAS, 501, 3621, doi: 10.1093/mnras/staa3668
-
[5]
Aniano, G., Draine, B. T., Gordon, K. D., & Sandstrom, K. 2011, PASP, 123, 1218, doi: 10.1086/662219 Astropy Collaboration, Robitaille, T. P., Tollerud, E. J., et al. 2013, A&A, 558, A33, doi: 10.1051/0004-6361/201322068 Astropy Collaboration, Price-Whelan, A. M., Sip˝ ocz, B. M., et al. 2018, AJ, 156, 123, doi: 10.3847/1538-3881/aabc4f
doi:10.1086/662219 2011
-
[6]
Bakes, E. L. O., & Tielens, A. G. G. M. 1994, ApJ, 427, 822, doi: 10.1086/174188
doi:10.1086/174188 1994
-
[7]
Baldwin, J. A., Phillips, M. M., & Terlevich, R. 1981, PASP, 93, 5, doi: 10.1086/130766
doi:10.1086/130766 1981
-
[8]
PHANGS-ML: dissecting multiphase gas and dust in nearby galaxies using machine learning
Baron, D., Sandstrom, K. M., Rosolowsky, E., et al. 2024, arXiv e-prints, arXiv:2402.04330, doi: 10.48550/arXiv.2402.04330
work page Pith review arXiv doi:10.48550/arxiv.2402.04330 2024
Show all 91 references
-
[9]
M., Sutter, J., et al
Baron, D., Sandstrom, K. M., Sutter, J., et al. 2025, ApJ, 978, 135, doi: 10.3847/1538-4357/ad972a
2025 doi
-
[10]
2022, A&A, 659, A26, doi: 10.1051/0004-6361/202141859
Belfiore, F., Santoro, F., Groves, B., et al. 2022, A&A, 659, A26, doi: 10.1051/0004-6361/202141859
2022 doi
-
[11]
K., Sun, J., et al
Belfiore, F., Leroy, A. K., Sun, J., et al. 2023, A&A, 670, A67, doi: 10.1051/0004-6361/202244863
2023 doi
-
[12]
Boersma, C., Bregman, J., & Allamandola, L. J. 2016, ApJ, 832, 51, doi: 10.3847/0004-637X/832/1/51
2016 doi
-
[13]
J., Esposito, V
Boersma, C., Allamandola, L. J., Esposito, V. J., et al. 2023, ApJ, 959, 74, doi: 10.3847/1538-4357/ad022b
2023 doi
- [14]
-
[15]
2019, A&A, 622, A103, doi: 10.1051/0004-6361/201834156
Boquien, M., Burgarella, D., Roehlly, Y., et al. 2019, A&A, 622, A103, doi: 10.1051/0004-6361/201834156
2019 doi
-
[16]
2003, MNRAS, 344, 1000, doi: 10.1046/j.1365-8711.2003.06897.x
Bruzual, G., & Charlot, S. 2003, MNRAS, 344, 1000, doi: 10.1046/j.1365-8711.2003.06897.x
2003
-
[17]
2023, ApJL, 944, L12, doi: 10.3847/2041-8213/acac94
Chastenet, J., Sutter, J., Sandstrom, K., et al. 2023, ApJL, 944, L12, doi: 10.3847/2041-8213/acac94
2023 doi
-
[18]
2024, A&A, 685, A75, doi: 10.1051/0004-6361/202346662
Chown, R., Sidhu, A., Peeters, E., et al. 2024, A&A, 685, A75, doi: 10.1051/0004-6361/202346662
2024 doi
-
[19]
K., Sandstrom, K., et al
Chown, R., Leroy, A. K., Sandstrom, K., et al. 2025a, ApJ, 983, 64, doi: 10.3847/1538-4357/adbd40
-
[20]
2025b, A&A, 698, A86, doi: 10.1051/0004-6361/202452940
Chown, R., Okada, Y., Peeters, E., et al. 2025b, A&A, 698, A86, doi: 10.1051/0004-6361/202452940
-
[21]
Conroy, C., & Gunn, J. E. 2010, ApJ, 712, 833, doi: 10.1088/0004-637X/712/2/833
2010 doi
-
[22]
E., & White, M
Conroy, C., Gunn, J. E., & White, M. 2009, ApJ, 699, 486, doi: 10.1088/0004-637X/699/1/486
2009 doi
-
[23]
2023, Scientific colour maps, 8.0.1 Zenodo, doi: 10.5281/zenodo.8409685
Crameri, F. 2023, Scientific colour maps, 8.0.1 Zenodo, doi: 10.5281/zenodo.8409685
2023 doi
-
[24]
A., Boquien, M., Barnes, A
Dale, D. A., Boquien, M., Barnes, A. T., et al. 2023, ApJL, 944, L23, doi: 10.3847/2041-8213/aca769
2023 doi
-
[25]
A., Graham, G
Dale, D. A., Graham, G. B., Barnes, A. T., et al. 2025, AJ, 169, 133, doi: 10.3847/1538-3881/ada89f
2025 doi
-
[26]
X., Boulanger, F., & Puget, J
Desert, F. X., Boulanger, F., & Puget, J. L. 1990, A&A, 237, 215
1990
-
[27]
M., & Rieke, G
Diamond-Stanic, A. M., & Rieke, G. H. 2010, ApJ, 724, 140, doi: 10.1088/0004-637X/724/1/140
2010 doi
-
[28]
P., Smith, J
Donnelly, G. P., Smith, J. D. T., Draine, B. T., et al. 2024, ApJ, 965, 75, doi: 10.3847/1538-4357/ad2169
2024 doi
- [29]
- [30]
-
[31]
T., Li, A., Hensley, B
Draine, B. T., Li, A., Hensley, B. S., et al. 2021, ApJ, 917, 3, doi: 10.3847/1538-4357/abff51
2021 doi
-
[32]
2022, A&A, 659, A191, doi: 10.1051/0004-6361/202141727 Garc ´ ıa-Bernete, I., Rigopoulou, D., Alonso-Herrero, A., et al
Emsellem, E., Schinnerer, E., Santoro, F., et al. 2022, A&A, 659, A191, doi: 10.1051/0004-6361/202141727 Garc ´ ıa-Bernete, I., Rigopoulou, D., Alonso-Herrero, A., et al. 2022, A&A, 666, L5, doi: 10.1051/0004-6361/202244806 Garc ´ ıa-Bernete, I., Rigopoulou, D., Donnan, F. R.,...
2022 doi
-
[33]
D., Bohlin, R., Sloan, G
Gordon, K. D., Bohlin, R., Sloan, G. C., et al. 2022, AJ, 163, 267, doi: 10.3847/1538-3881/ac66dc
2022 doi
-
[34]
B., Dale, D
Graham, G. B., Dale, D. A., Smith, C. L., et al. 2025, AJ, 170, 340, doi: 10.3847/1538-3881/ae10ad
2025 doi
-
[35]
2024, ApJ, 971, 115, doi: 10.3847/1538-4357/ad54b4
Gregg, B., Calzetti, D., Adamo, A., et al. 2024, ApJ, 971, 115, doi: 10.3847/1538-4357/ad54b4
2024 doi
-
[36]
2012, MNRAS, 426, 892, doi: 10.1111/j.1365-2966.2012.21696.x
Groves, B., Krause, O., Sandstrom, K., et al. 2012, MNRAS, 426, 892, doi: 10.1111/j.1365-2966.2012.21696.x
2012
-
[37]
2015, Planet
Hammonds, M., Mori, T., Usui, F., & Onaka, T. 2015, Planet. Space Sci., 116, 73, doi: 10.1016/j.pss.2015.05.010
2015 doi
-
[38]
R., Millman, K
Harris, C. R., Millman, K. J., van der Walt, S. J., et al. 2020, Nature, 585, 357, doi: 10.1038/s41586-020-2649-2
2020 doi
-
[39]
2004, ApJS, 154, 253, doi: 10.1086/422640
Helou, G., Roussel, H., Appleton, P., et al. 2004, ApJS, 154, 253, doi: 10.1086/422640
2004 doi
-
[40]
J., & Tielens, A
Hollenbach, D. J., & Tielens, A. G. G. M. 1999, Reviews of Modern Physics, 71, 173, doi: 10.1103/RevModPhys.71.173
1999 doi
-
[41]
K., Thuan, T
Hunt, L. K., Thuan, T. X., Izotov, Y. I., & Sauvage, M. 2010, ApJ, 712, 164, doi: 10.1088/0004-637X/712/1/164 38Koziol et al
2010 doi
-
[42]
Hunter, J. D. 2007, Computing In Science & Engineering, 9, 90
2007
-
[43]
D., Akritas, M
Isobe, T., Feigelson, E. D., Akritas, M. G., & Babu, G. J. 1990, ApJ, 364, 104, doi: 10.1086/169390
1990 doi
-
[44]
A., & Percival, S
James, P. A., & Percival, S. M. 2015, MNRAS, 450, 3503, doi: 10.1093/mnras/stv846
2015 doi
-
[45]
M., Tremonti, C., et al
Kauffmann, G., Heckman, T. M., Tremonti, C., et al. 2003, MNRAS, 346, 1055, doi: 10.1111/j.1365-2966.2003.07154.x
2003
-
[46]
Lai, T. S. Y., Smith, J. D. T., Baba, S., Spoon, H. W. W., & Imanishi, M. 2020, ApJ, 905, 55, doi: 10.3847/1538-4357/abc002
2020 doi
-
[47]
Lai, T. S. Y., Armus, L., Bianchin, M., et al. 2023, ApJL, 957, L26, doi: 10.3847/2041-8213/ad0387
2023 doi
-
[48]
S.-Y., Duval, S., Smith, J
Lai, T. S.-Y., Duval, S., Smith, J. D. T., et al. 2025, ApJL, 991, L56, doi: 10.3847/2041-8213/ae0467
2025 doi
-
[49]
E., Rosolowsky, E., et al
Lang, P., Meidt, S. E., Rosolowsky, E., et al. 2020, ApJ, 897, 122, doi: 10.3847/1538-4357/ab9953
2020 doi
-
[50]
C., Sandstrom, K
Lee, J. C., Sandstrom, K. M., Leroy, A. K., et al. 2023, ApJL, 944, L17, doi: 10.3847/2041-8213/acaaae
2023 doi
-
[51]
K., Sandstrom, K
Leroy, A. K., Sandstrom, K. M., Lang, D., et al. 2019, ApJS, 244, 24, doi: 10.3847/1538-4365/ab3925
2019 doi
-
[52]
K., Schinnerer, E., Hughes, A., et al
Leroy, A. K., Schinnerer, E., Hughes, A., et al. 2021, ApJS, 257, 43, doi: 10.3847/1538-4365/ac17f3
2021 doi
-
[53]
K., Sandstrom, K., Rosolowsky, E., et al
Leroy, A. K., Sandstrom, K., Rosolowsky, E., et al. 2023, ApJL, 944, L9, doi: 10.3847/2041-8213/acaf85
2023 doi
-
[54]
2020, Nature Astronomy, 4, 339, doi: 10.1038/s41550-020-1051-1
Li, A. 2020, Nature Astronomy, 4, 339, doi: 10.1038/s41550-020-1051-1
2020 doi
-
[55]
Li, A., & Draine, B. T. 2001, ApJ, 554, 778, doi: 10.1086/323147
2001 doi
-
[56]
J., Candian, A., Lee, T
Mackie, C. J., Candian, A., Lee, T. J., & Tielens, A. G. G. M. 2022, The Journal of Physical Chemistry A, 126, 3198, doi: 10.1021/acs.jpca.2c01849
2022 doi
-
[57]
2014, A&A, 570, A13, doi: 10.1051/0004-6361/201423496
Vauglin, I. 2014, A&A, 570, A13, doi: 10.1051/0004-6361/201423496
2014 doi
-
[58]
2020, MNRAS, 494, 642, doi: 10.1093/mnras/staa681
Maragkoudakis, A., Peeters, E., & Ricca, A. 2020, MNRAS, 494, 642, doi: 10.1093/mnras/staa681
2020 doi
-
[59]
S., Mezger, P
Mathis, J. S., Mezger, P. G., & Panagia, N. 1983, A&A, 128, 212
1983
-
[60]
B., & Ingargiola, A
Newville, M., Stensitzki, T., Allen, D. B., & Ingargiola, A. 2014, LMFIT: Non-Linear Least-Square Minimization and Curve-Fitting for Python, 0.8.0 Zenodo, doi: 10.5281/zenodo.11813
2014 doi
- [61]
-
[62]
2024, A&A, 685, A74, doi: 10.1051/0004-6361/202348244
Peeters, E., Habart, E., Bern´ e, O., et al. 2024, A&A, 685, A74, doi: 10.1051/0004-6361/202348244
2024 doi
-
[63]
J., & Allamandola, L
Pendleton, Y. J., & Allamandola, L. J. 2002, ApJS, 138, 75, doi: 10.1086/322999
2002 doi
-
[64]
D., Sivaramakrishnan, A., Lajoie, C.-P., et al
Perrin, M. D., Sivaramakrishnan, A., Lajoie, C.-P., et al. 2014, in Society of Photo-Optical Instrumentation Engineers (SPIE) Conference Series, Vol. 9143, Space Telescopes and Instrumentation 2014: Optical, Infrared, and Millimeter Wave, ed. J. M. Oschmann, Jr., M. Clampin, G...
2014 doi
-
[65]
2015, A&A, 577, A16, doi: 10.1051/0004-6361/201425590
Pilleri, P., Joblin, C., Boulanger, F., & Onaka, T. 2015, A&A, 577, A16, doi: 10.1051/0004-6361/201425590
2015 doi
-
[66]
S., & Grebel, E
Pilyugin, L. S., & Grebel, E. K. 2016, MNRAS, 457, 3678, doi: 10.1093/mnras/stw238
2016 doi
-
[67]
C., et al
Rigopoulou, D., Barale, M., Clary, D. C., et al. 2021, MNRAS, 504, 5287, doi: 10.1093/mnras/stab959 Rodr ´ ıguez, M. J., Lee, J. C., Whitmore, B. C., et al. 2023, ApJL, 944, L26, doi: 10.3847/2041-8213/aca653
2021 doi
-
[68]
M., Bolatto, A
Sandstrom, K. M., Bolatto, A. D., Bot, C., et al. 2012, ApJ, 744, 20, doi: 10.1088/0004-637X/744/1/20
2012 doi
-
[69]
M., Chastenet, J., Sutter, J., et al
Sandstrom, K. M., Chastenet, J., Sutter, J., et al. 2023, ApJL, 944, L7, doi: 10.3847/2041-8213/acb0cf
2023 doi
-
[70]
2020, AJ, 160, 231, doi: 10.3847/1538-3881/abb811
Schlawin, E., Leisenring, J., Misselt, K., et al. 2020, AJ, 160, 231, doi: 10.3847/1538-3881/abb811
2020 doi
-
[71]
A., Tielens, A
Schutte, W. A., Tielens, A. G. G. M., & Allamandola, L. J. 1993, ApJ, 415, 397, doi: 10.1086/173173
1993 doi
-
[72]
1984, ApJ, 277, 623, doi: 10.1086/161733
Sellgren, K. 1984, ApJ, 277, 623, doi: 10.1086/161733
1984 doi
-
[73]
C., Bregman, J
Sloan, G. C., Bregman, J. D., Geballe, T. R., Allamandola, L. J., & Woodward, E. 1997, ApJ, 474, 735, doi: 10.1086/303484
1997 doi
-
[74]
Smith, J. D. T., Draine, B. T., Dale, D. A., et al. 2007, ApJ, 656, 770, doi: 10.1086/510549
2007 doi
-
[75]
K., Schinnerer, E., et al
Sun, J., Leroy, A. K., Schinnerer, E., et al. 2020, ApJL, 901, L8, doi: 10.3847/2041-8213/abb3be
2020 doi
-
[76]
K., Rosolowsky, E., et al
Sun, J., Leroy, A. K., Rosolowsky, E., et al. 2022, AJ, 164, 43, doi: 10.3847/1538-3881/ac74bd
2022 doi
-
[77]
K., Ostriker, E
Sun, J., Leroy, A. K., Ostriker, E. C., et al. 2023, ApJL, 945, L19, doi: 10.3847/2041-8213/acbd9c
2023 doi
-
[78]
2024, ApJ, 971, 178, doi: 10.3847/1538-4357/ad54bd
Sutter, J., Sandstrom, K., Chastenet, J., et al. 2024, ApJ, 971, 178, doi: 10.3847/1538-4357/ad54bd
2024 doi
-
[79]
J., Roman-Duval, J., Sandstrom, K
Tarantino, E. J., Roman-Duval, J., Sandstrom, K. M., et al. 2025, arXiv e-prints, arXiv:2512.04060, doi: 10.48550/arXiv.2512.04060
2025 doi
-
[80]
Tielens, A. G. G. M. 2008, ARA&A, 46, 289, doi: 10.1146/annurev.astro.46.060407.145211 van Diedenhoven, B., Peeters, E., Van Kerckhoven, C., et al. 2004, ApJ, 611, 928, doi: 10.1086/422404
2008
-
[81]
2001, A&A, 372, 981, doi: 10.1051/0004-6361:20010515 3.3µm PAH Feature in Nearby Galaxies39
Verstraete, L., Pech, C., Moutou, C., et al. 2001, A&A, 372, 981, doi: 10.1051/0004-6361:20010515 3.3µm PAH Feature in Nearby Galaxies39
2001 doi
-
[82]
E., et al
Virtanen, P., Gommers, R., Oliphant, T. E., et al. 2020, Nature Methods, 17, 261, doi: https://doi.org/10.1038/s41592-019-0686-2
2020 doi
-
[83]
M., Sandstrom, K., & Smith, J.-D
Whitcomb, C. M., Sandstrom, K., & Smith, J.-D. T. 2023, Research Notes of the American Astronomical Society, 7, 38, doi: 10.3847/2515-5172/acc073
2023 doi
-
[84]
M., Smith, J
Whitcomb, C. M., Smith, J. D. T., Sandstrom, K., et al. 2024, ApJ, 974, 20, doi: 10.3847/1538-4357/ad66c8
2024 doi
-
[85]
M., Smith, J
Whitcomb, C. M., Smith, J. D. T., Tarantino, E., et al. 2025, arXiv e-prints, arXiv:2509.18347, doi: 10.48550/arXiv.2509.18347
2025 doi
-
[86]
G., Kreckel, K., Belfiore, F., et al
Williams, T. G., Kreckel, K., Belfiore, F., et al. 2022, MNRAS, 509, 1303, doi: 10.1093/mnras/stab3082
2022 doi
-
[87]
G., Lee, J
Williams, T. G., Lee, J. C., Larson, K. L., et al. 2024, PHANGS-JWST: Data Processing Pipeline and First Full Public Data Release, https://arxiv.org/abs/2401.15142
2024 arXiv
-
[88]
G., McKee, C
Wolfire, M. G., McKee, C. F., Hollenbach, D., & Tielens, A. G. G. M. 2003, ApJ, 587, 278, doi: 10.1086/368016
2003 doi
-
[89]
2012, A&A, 541, A10, doi: 10.1051/0004-6361/201218904
Yamagishi, M., Kaneda, H., Ishihara, D., et al. 2012, A&A, 541, A10, doi: 10.1051/0004-6361/201218904
2012 doi
-
[90]
J., Li, A., Glaser, R., & Zhong, J
Yang, X. J., Li, A., Glaser, R., & Zhong, J. X. 2017, ApJ, 837, 171, doi: 10.3847/1538-4357/aa5fa9
2017 doi
-
[91]
2024, ApJL, 975, L2, doi: 10.3847/2041-8213/ad81d0
Zhang, L., Garc ´ ıa-Bernete, I., Packham, C., et al. 2024, ApJL, 975, L2, doi: 10.3847/2041-8213/ad81d0
2024 doi
Reviewed August 8, 2026 · model on record in the stance chip above.
Discussion (0). Continue with ORCID to comment.