REVIEW 3 major objections 3 minor 53 references
Constructing a Hydrogen Line Library for Ly{\alpha} Emitters at Low Redshifts (z < 0.4): Estimating Dust Extinction and Assessing Paschen line Detectability with SPHEREx
T0 review · 3 major / 3 minor · reviewed 2026-08-14 · deepseek-v4-flash
Pith's one-line read SPHEREx can detect the Paschen-alpha line in 14 of 192 modeled low-redshift Lyman-alpha galaxies.
desk verdict Solid, honest literature compilation and a clearly-hedged SPHEREx forecast, but the 'reliable detection' counts use a flux-recovery criterion with no S/N minimum and likely overstate the blind-survey yield. read the letter →
The pith
A machine-rendered reading of the paper's core claim, the machinery that carries it, and where it could break.
The reading
What carries the argument
The load-bearing identity is the attenuation mapping from observed to intrinsic hydrogen line ratios, $E(B-V) = -2.5\,/\,(\kappa(H_j)-\kappa(H_i))\times \log_{10}[ (H_i/H_j)_{\rm int}/(H_i/H_j)_{\rm obs}]$, combined with a power-law attenuation law $A(\lambda)=A_V(\lambda/\lambda_V)^{\delta}$ whose slope $\delta$ is fixed by requiring a single $E(B-V)$ to reproduce the H$\alpha$/H$\beta$ and H$\beta$/H$\gamma$ ratios simultaneously. These two pieces convert the compiled line fluxes into dust properties and reveal object-to-object variation in attenuation-curve shape. The second mechanism is the SPHEREx mock-observation pipeline: a single star-forming SED template scaled to each galaxy's W1 magnitude, Gaussian Paschen lines with Case B flux ratios to dust-corrected H$\alpha$, and the SPHEREx simple simulator, which smooths the SED to survey resolution, samples $4\times 96$ spectral channels with a small wavelength jitter, and adds photometric noise. Fitting each line with a Gaussian plus a linear continuum decides whether Pa$\alpha$, Pa$\beta$, or Pa$\gamma$ emerges from the noise, and the continuum-versus-line contrast set by these two mechanisms determines the reliable-detection counts.
What would settle it
Take the 22 sample galaxies with H$\alpha$ flux above $4\times10^{-15}$ erg s$^{-1}$ cm$^{-2}$, and check the SPHEREx spectra for a Pa$\alpha$ line at the redshifted rest wavelength. If fewer than about half show a significant line, the forecast of a roughly 50% reliable-detection rate at that flux threshold fails; if the continuum slopes measured from the same spectra depart systematically from the adopted template, the predicted line contrast and detection counts need revision.
Extended reading notes
Core claim
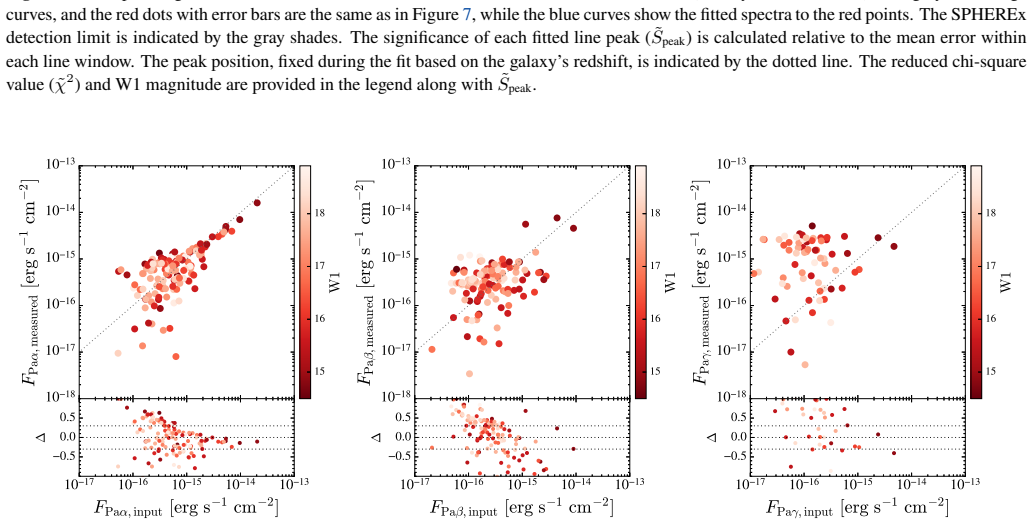
The central claim is that hydrogen-line diagnostics of low-redshift Ly$\alpha$ emitters can be pushed from the optical Balmer series into the near-infrared Paschen series, and that SPHEREx is capable of making that measurement for a significant fraction of the population. Using Case B recombination and the Calzetti attenuation curve, the authors convert observed H$\alpha$/H$\beta$ ratios into color excesses for 85 galaxies and infer Ly$\alpha$ escape fractions that anti-correlate with dust. For the 14 galaxies with H$\alpha$, H$\beta$, and H$\gamma$ all detected, they solve for the power-law slope $\delta$ of the attenuation curve that makes all three ratios agree, finding a wide spread in $\delta$ and $E(B-V)$ shifts of 10–50% relative to adopting a fixed Calzetti-like curve. Modeling the continuum with a single star-forming SED template scaled to each galaxy's catWISE W1 flux, adding Gaussian Pa$\alpha$, Pa$\beta$, and Pa$\gamma$ lines with Case B fluxes normalized by dust-corrected H$\alpha$ or Ly$\alpha$, and simulating SPHEREx observations with the survey's spectral resolution and expected noise, they find that Pa$\alpha$ flux can be measured to within about 0.3 dex for lines above roughly $2\times10^{-15}$ erg s$^{-1}$ cm$^{-2}$. This yields forecast reliable Pa$\alpha$ detections for 14 galaxies (six with Pa$\beta$, two with Pa$\gamma$), with a roughly 50% success rate for galaxies with H$\alpha$ flux near $4\times10^{-15}$ erg s$^{-1}$ cm$^{-2}$.
Load-bearing premise
The forecast assumes every galaxy's optical-to-near-infrared continuum has the same shape, represented by a single star-forming SED template scaled by the W1 magnitude, because only three of the 192 modeled galaxies have both 2MASS and catWISE photometry to constrain their individual continuum slopes.
Editorial extensions
If this is right
- SPHEREx's all-sky spectra can be searched blindly for Pa$\alpha$-selected galaxies at $z\lesssim0.4$, adding a wavelength regime where dust attenuation is several times weaker than in the optical.
- A practical target-selection rule follows: galaxies with H$\alpha$ flux above roughly $4\times10^{-15}$ erg s$^{-1}$ cm$^{-2}$ yield reliable Pa$\alpha$ measurements about half the time.
- The spread in fitted attenuation slopes among the 14 three-line galaxies implies that fixing a single dust curve can bias $E(B-V)$ by 10–50%; multi-line measurements including Paschen lines will be needed for accurate star-formation rates.
- Detected Pa$\alpha$ can be combined with H$\alpha$ to build a reddening-robust estimate of the ionizing photon production rate and, through the Ly$\alpha$ comparison, of the Ly$\alpha$ escape fraction.
- The rarer Pa$\beta$ and Pa$\gamma$ detections, though few, anchor the attenuation-curve slope at near-infrared wavelengths rather than extrapolating it from the optical.
Reading between the lines
- If the 14-of-192 reliable-detection rate carries over to the wider GALEX-selected LAE population, the all-sky SPHEREx survey would yield hundreds of Pa$\alpha$-measured galaxies at $z<0.4$, turning a feasibility study into a statistical sample.
- The single-template continuum assumption is directly testable as soon as SPHEREx data are in hand: comparing measured continuum slopes with the adopted template will show whether faint-line detection counts were over- or under-estimated.
- Applying the same mock pipeline to Brackett-series lines would extend the forecast to heavily obscured systems like ULIRGs, where Balmer lines are nearly invisible and Pa$\alpha$/Br$\alpha$ ratios carry the dust signal.
- The choice to fit the four repeated SPHEREx observations separately, rather than co-adding them, means the predicted detection counts depend on spectral resolution more than on depth; a co-added analysis would test the same science with higher signal-to-noise per channel.
Editorial analysis
A structured set of objections, weighed in public.
Referee Report
Summary. The paper compiles 260 low-redshift (z ≲ 0.4) Lyα emitters from six literature samples and constructs a hydrogen recombination-line library. For 85 galaxies with at least two Balmer lines, the authors estimate E(B − V) from Case B ratios and a Calzetti attenuation curve, and derive Lyα escape fractions. For 14 galaxies with all three Balmer lines, they fit the attenuation-curve slope δ and report diversity in the inferred dust-law slope. The second half of the paper builds mock SPHEREx spectra for 192 galaxies with catWISE photometry, injects Paα, Paβ, and Paγ lines derived from extinction-corrected Hα or Lyα fluxes, and uses the SPHEREx simple simulator to assess line recovery. The central forecast is that Paα will be reliably measurable for 14 galaxies (≈7% of the modeled sample) and that a 50% success rate is reached for Hα fluxes near 4×10^(−15) erg s^(−1) cm^(−2). The paper explicitly acknowledges the inhomogeneous compilation and the simplified modeling assumptions.
Significance. If the forecast is robust, this is a useful early assessment of SPHEREx's ability to detect Paschen lines in low-redshift star-forming galaxies, and the compiled line library plus machine-readable table is a serviceable community resource. The paper's strengths include the clear separation of measured quantities from assumed Case B physics, the propagation of literature flux uncertainties into E(B − V) and fesc(Lyα), the explicit discussion of negative E(B − V) values as systematic indicators, and the sensitivity tests in Section 4.2. The main scientific claims, however, rest on a detectability metric that measures flux-recovery accuracy at known line centers rather than the significance with which a line would be found in a blind survey. Because SPHEREx will be a blind survey, the forecasted number of Paα detections and the quoted 50% success rate are likely overstated unless a detection-significance threshold is applied. The continuum-template and attenuation-slope robustness also need strengthening before the quantitative forecasts can be accepted.
major comments (3)
- [§4.2 (Figs. 8 and 9)]
- [§4.1 and §4.2 (continuum SED template)]
- [§3.2 (Fig. 4, Eq. 4, Table A1)]
minor comments (3)
- [§4.2 (Fig. 8 caption)]
- [§4.1 (SPHEREx simulator setup)]
- [Appendix A (Fig. A3)] Galaxy ID 33 in Figure A3 has a reduced χ² of 8.73, indicating a poor fit; this case should be discussed or excluded from the summary statistics to avoid giving the impression that all recovered line measurements are well behaved.
Circularity Check
No circular reasoning found: the Paschen detectability forecast is a forward injection-recovery test built from independent Balmer-line measurements, not a fit to its own outcome.
full rationale
The paper's derivation chain is self-contained and non-circular. E(B-V) values are estimated from observed Balmer ratios through Equation (1) with Case B intrinsic ratios and the Calzetti curve, independent of any detectability claim. The Ly-alpha escape fraction is the ratio of observed Ly-alpha flux to the Case B-inferred intrinsic Ly-alpha flux, again a direct calculation from data rather than an assumed output. The attenuation-curve slope delta is solved for each of the 14 three-line galaxies via Equation (4), and the reported diversity is a description of that fit, not a prediction derived from the fit. The SPHEREx Paschen-line fluxes are forward-modeled from the extinction-corrected H-alpha or Ly-alpha fluxes using fixed Case B line ratios, and the mock spectra are generated with the SPHEREx simple simulator; the recovery test then compares fitted fluxes to the known injected fluxes, which is a standard sensitivity test rather than a circular fit. The reliability criterion (agreement within 0.3 dex) is applied to injected lines, so the quoted 14 Pa-alpha detections are a calibration result, not a prediction that has been tuned to match itself. No load-bearing self-citation, imported uniqueness theorem, or ansatz smuggled in via citation appears in the argument. Concerns about the low S/N of some recovered lines are accuracy or statistical-significance concerns, not circularity.
Assumptions & free parameters
free parameters (3)
- Per-galaxy dust attenuation slope δ =
-4.27, -3.44, -5.21, -0.82, and others for 8 galaxies
- Lyα escape fraction for Lyα-only galaxies =
0.10 (assumed)
- Emission line width =
400 km/s
assumptions (4)
- domain assumption Case B recombination intrinsic line ratios apply to all galaxies: Hα/Hβ = 2.86, Hγ/Hβ = 0.469, Lyα/Hα = 8.7, Paα/Hα = 0.118.
- domain assumption The Calzetti attenuation curve is applicable to low-redshift LAEs.
- ad hoc to paper A single Brown SED template, selected from three galaxies with 2MASS and catWISE photometry, is representative of the continuum of all 192 galaxies in the SPHEREx forecast.
- domain assumption The SPHEREx simple simulator reproduces the collaboration simulator and uses top-hat filter responses with 100% efficiency.
Cite this review
Pith. "Pith review of Constructing a Hydrogen Line Library for Ly{\alpha} Emitters at Low Redshifts (z < 0.4): Estimating Dust Extinction and Assessing Paschen line Detectability with SPHEREx." pith.science (2026). https://pith.science/paper/4CLRJMK7
@misc{pith2026260808393,
  author       = {Pith},
  title        = {Pith review of: Constructing a Hydrogen Line Library for Ly\alpha Emitters at Low Redshifts (z < 0.4): Estimating Dust Extinction and Assessing Paschen line Detectability with SPHEREx},
  year         = {2026},
  howpublished = {\url{https://pith.science/paper/4CLRJMK7}},
  note         = {Machine review of arXiv:2608.08393}
}
read the original abstract
Hydrogen recombination lines, one of the strongest emission lines from star-forming galaxies, are used to probe the early Universe as indicators of star formation rates and ionizing photon production rates. Ratios between different recombination lines provide clues to estimate dust attenuation, in addition to the H II region physical diagnostics. To prepare for future near-infrared spectral surveys and optical narrow-band imaging surveys aiming for hydrogen lines in different redshifts, we construct hydrogen recombination line libraries by compiling data from published literature. Our compilation includes 260 galaxies mostly at z < 0.4, of which at least one hydrogen recombination line is observed. The specific hydrogen emission lines under investigation encompass three Balmer lines (H{\alpha}, H\b{eta} and H{\gamma}) and Ly{\alpha} line. Of the compiled galaxies, we estimated dust extinction for 85 galaxies that have detections of at least two Balmer lines, by assuming the Case B recombination and Calzetti extinction curve, based on which Ly{\alpha} escape fraction is also inferred. For each of the 14 galaxies with detections of all three Balmer lines, we optimized the extinction curve so that it yields consistent E(B-V) values across the three possible Balmer line ratios, showing the variety in the slope of the dust attenuation curve. We further evaluated the feasibility of studying hydrogen emission line-selected galaxies with future spectral surveys such as SPHEREx by modeling the Paschen lines of our galaxy sample.
Figures


Figures from the paper (4 more)


Reference graph
Works this paper leans on
- [1]
-
[2]
Brown, M. J. I., Moustakas, J., Smith, J. D. T., et al. 2014, ApJS, 212, 18
2014
-
[3]
Brown, M. J. I., Moustakas, J., Kennicutt, R. C., et al. 2017, ApJ, 847, 136
2017
-
[4]
2021, ApJ, 918, 82 Calabrò, A., Pentericci, L., Talia, M., et al
Byun, W., Sheen, Y .-K., Seon, K.-I., et al. 2021, ApJ, 918, 82 Calabrò, A., Pentericci, L., Talia, M., et al. 2022, A&A, 667, A117
work page 2021
-
[5]
C., et al
Calzetti, D., Armus, L., Bohlin, R. C., et al. 2000, ApJ, 533, 682
2000
-
[6]
L., & Storchi-Bergmann, T
Calzetti, D., Kinney, A. L., & Storchi-Bergmann, T. 1994, ApJ, 429, 582
1994
-
[7]
M., Scoville, N
Casey, C. M., Scoville, N. Z., Sanders, D. B., et al. 2014, ApJ, 796, 95
2014
- [8]
Show all 53 references
-
[9]
2022, in American Astronomical Society Meeting Abstracts, Vol
Cleri, N., & Papovich, C. 2022, in American Astronomical Society Meeting Abstracts, Vol. 54, American Astronomical Society Meet- ing Abstracts, 241.31
2022
-
[10]
J., Trump, J
Cleri, N. J., Trump, J. R., Backhaus, B. E., et al. 2022, ApJ, 929, 3
2022
-
[11]
K., Best, P
Cochrane, R. K., Best, P . N., Sobral, D., et al. 2017, MNRAS, 469, 2913
2017
-
[12]
L., Barger, A
Cowie, L. L., Barger, A. J., & Hu, E. M. 2010, ApJ, 711, 928
2010
-
[13]
L., Barger, A
Cowie, L. L., Barger, A. J., & Hu, E. M. 2011, ApJ, 738, 136
2011
-
[14]
P ., Werner, M., Akeson, R., et al
Crill, B. P ., Werner, M., Akeson, R., et al. 2020, in Society of Photo- Optical Instrumentation Engineers (SPIE) Conference Series, Vol. 11443, Space Telescopes and Instrumentation 2020: Optical, In- frared, and Millimeter Wave, ed. M. Lystrup & M. D. Perrin, 114430I, doi: 10...
2020 doi
-
[15]
P ., Bach, Y
Crill, B. P ., Bach, Y . P ., Bryan, S. A., et al. 2025, arXiv e-prints, arXiv:2505.24856
2025
-
[16]
A., et al
Deharveng, J.-M., Small, T., Barlow, T. A., et al. 2008, ApJ, 680, 1072
2008
-
[17]
L., Cohen, S
Finkelstein, S. L., Cohen, S. H., Moustakas, J., et al. 2011, ApJ, 733, 117
2011
-
[18]
M., et al
Guo, Y ., Rafelski, M., Faber, S. M., et al. 2016, ApJ, 833, 37
2016
-
[19]
2023, A&A, 674, A99
Hamed, M., Małek, K., Buat, V ., et al. 2023, A&A, 674, A99
2023
-
[20]
N., Smail, I., & Kodama, T
Hayashi, M., Sobral, D., Best, P . N., Smail, I., & Kodama, T. 2013, MNRAS, 430, 1042
2013
-
[21]
C., Wisotzki, L., Saust, R., et al
Herenz, E. C., Wisotzki, L., Saust, R., et al. 2019, A&A, 621, A107
2019
-
[22]
2010, ApJ, 721, 1233 Ivezić, Ž., Ivezić, V ., Moeyens, J., et al
Imanishi, M., Nakagawa, T., Shirahata, M., Ohyama, Y ., & Onaka, T. 2010, ApJ, 721, 1233 Ivezić, Ž., Ivezić, V ., Moeyens, J., et al. 2022, Icarus, 371, 114696
2010
-
[23]
2023, A&A, 670, A125
Ji, X., Y an, R., Bundy, K., et al. 2023, A&A, 670, A125
2023
- [24]
-
[25]
C., & Evans, N
Kennicutt, R. C., & Evans, N. J. 2012, ARA&A, 50, 531
2012
-
[26]
A., Malhotra, S., Rhoads, J
Khostovan, A. A., Malhotra, S., Rhoads, J. E., et al. 2024, arXiv e- prints, arXiv:2408.00080
2024 arXiv
-
[27]
2018, A&A, 610, A31
Kim, D., & Im, M. 2018, A&A, 610, A31
2018
-
[28]
2010, ApJ, 724, 386
Kim, D., Im, M., & Kim, M. 2010, ApJ, 724, 386
2010
-
[29]
2023, ApJ, 954, 156
Kim, D., Im, M., Kim, M., et al. 2023, ApJ, 954, 156
2023
-
[30]
2018, ApJS, 238, 37
Kim, D., Im, M., Canalizo, G., et al. 2018, ApJS, 238, 37
2018
-
[31]
2024, ApJ, 962, 36
Lee, K.-S., Gawiser, E., Park, C., et al. 2024, ApJ, 962, 36
2024
-
[32]
2024, A&A, 691, A201 Mentuch Cooper, E., Gebhardt, K., Davis, D., et al
Lin, Z., & Y an, R. 2024, A&A, 691, A201 Mentuch Cooper, E., Gebhardt, K., Davis, D., et al. 2023, ApJ, 943, 177
2024
-
[33]
R., Heckman, T
Meurer, G. R., Heckman, T. M., & Calzetti, D. 1999, in American Institute of Physics Conference Series, Vol. 470, After the Dark Ages: When Galaxies were Y oung (the Universe at 2 < Z < 5), ed. S. Holt & E. Smith, 359–363, doi: 10.1063/1.58622
1999 doi
-
[34]
E., & Ferland, G
Osterbrock, D. E., & Ferland, G. J. 2006, Astrophysics of gaseous nebulae and active galactic nuclei Östlin, G., Hayes, M., Duval, F., et al. 2014, ApJ, 797, 11
2006
-
[35]
2008, ApJS, 176, 301
Ouchi, M., Shimasaku, K., Akiyama, M., et al. 2008, ApJS, 176, 301
2008
-
[36]
2018, PASJ, 70, S13
Ouchi, M., Harikane, Y ., Shibuya, T., et al. 2018, PASJ, 70, S13
2018
-
[37]
Pastrav, B. A. 2023, Monthly Notices of the Royal Astronomical So- ciety, 527, 11167
2023
-
[38]
V ., Inami, H., Malkan, M
Payne, A. V ., Inami, H., Malkan, M. A., Matsuhara, H., & Sakai, S. 2018, in The Cosmic Wheel and the Legacy of the AKARI Archive: From Galaxies and Stars to Planets and Life, ed. T. Oot- subo, I. Y amamura, K. Murata, & T. Onaka, 337–340
2018
-
[39]
E., Steidel, C
Pettini, M., Shapley, A. E., Steidel, C. C., et al. 2001, ApJ, 554, 981 Planck Collaboration, Aghanim, N., Akrami, Y ., et al. 2020, A&A, 641, A6
2001
-
[40]
2022, ApJ, 928, 71
Papovich, C. 2022, ApJ, 928, 71
2022
-
[41]
2023, ApJ, 948, 83
Brammer, G. 2023, ApJ, 948, 83
2023
-
[42]
2020, in XIV .0 Scientific Meeting (virtual) of the Spanish Astronomical Society, 182
Rodrigo, C., & Solano, E. 2020, in XIV .0 Scientific Meeting (virtual) of the Spanish Astronomical Society, 182
2020
-
[43]
2012, SVO Filter Profile Service Version 1.0, IVOA Working Draft 15 October 2012, doi:10.5479/ ADS/bib/2012ivoa.rept.1015R
Rodrigo, C., Solano, E., & Bayo, A. 2012, SVO Filter Profile Service Version 1.0, IVOA Working Draft 15 October 2012, doi:10.5479/ ADS/bib/2012ivoa.rept.1015R
2012
-
[44]
F., et al
Rodrigo, C., Cruz, P ., Aguilar, J. F., et al. 2024, A&A, 689, A93
2024
-
[45]
2020, ARA&A, 58, 529
Salim, S., & Narayanan, D. 2020, ARA&A, 58, 529
2020
-
[46]
2024, arXiv e-prints, arXiv:2404.09015
Scarlata, C., Hayes, M., Panagia, N., et al. 2024, arXiv e-prints, arXiv:2404.09015
2024 arXiv
-
[47]
I., et al
Scarlata, C., Colbert, J., Teplitz, H. I., et al. 2009, ApJ, 704, L98
2009
-
[48]
E., Zakamska, N
Sun, A.-L., Greene, J. E., Zakamska, N. L., et al. 2018, Monthly No- tices of the Royal Astronomical Society, 480, 2302
2018
-
[49]
T., Yuan, F.-T., Ikeyama, A., Murata, K
Takeuchi, T. T., Yuan, F.-T., Ikeyama, A., Murata, K. L., & Inoue, A. K. 2012, ApJ, 755, 144
2012
-
[50]
E., Franx, M., Leja, J., et al
Whitaker, K. E., Franx, M., Leja, J., et al. 2014, ApJ, 795, 104
2014
-
[51]
T., Förster Schreiber, N
Wisnioski, E., Mendel, J. T., Förster Schreiber, N. M., et al. 2018, ApJ, 855, 97
2018
-
[52]
Wold, I. G. B., Finkelstein, S. L., Barger, A. J., Cowie, L. L., & Rosen- wasser, B. 2017, ApJ, 848, 108
2017
-
[53]
M., van der Wel, A., et al
Wuyts, S., Förster Schreiber, N. M., van der Wel, A., et al. 2011, ApJ, 742, 96 Y ano, K., Baba, S., Nakagawa, T., et al. 2021, ApJ, 922, 272 Song et al. 13 Constructing a Hydrogen Line Library for Lyα Emitters at Low Redshifts 1.80 1.85 1.90 1.95 2.00 2.05 λ [ µ m] 0.0 0.2 0....
2011
Reviewed August 14, 2026 · model on record in the stance chip above.
Discussion (0). Continue with ORCID to comment.