REVIEW 4 major objections 6 minor 65 references
A systematic comparison of green valley selection criteria across multiparameter spaces using a homogeneous ultraviolet-optical dataset
T0 review · 4 major / 6 minor · reviewed 2026-08-16 · deepseek-v4-flash
Pith's one-line read Four commonly used 'green valley' selection criteria identify statistically distinct galaxy subsets, so single-diagnostic definitions are not interchangeable.
desk verdict Useful overlap matrix, but the diagnostic narrative leans on an unstated main-sequence relation and a sample-size swap; worth refereeing after fixes. read the letter →
The pith
A machine-rendered reading of the paper's core claim, the machinery that carries it, and where it could break.
The reading
What carries the argument
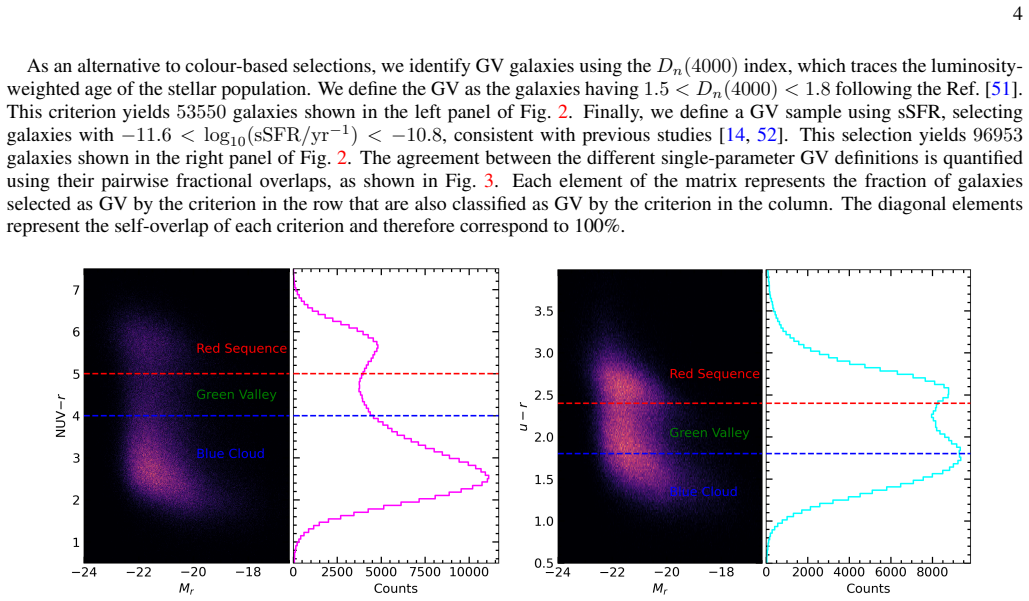
The central machinery is the pairwise overlap matrix combined with projection of each one-dimensional green valley selection onto two-dimensional reference planes. The paper defines green valley samples using fixed cuts: $4<\mathrm{NUV}-r<5$, $1.8<u-r<2.4$, $1.5<D_n(4000)<1.8$, and $-11.6<\log_{10}(\mathrm{sSFR}/\mathrm{yr}^{-1})<-10.8$. It then counts, for each sample, the fraction of galaxies lying above, within, and below the nominal green valley band in the NUV-r-stellar mass, u-r-stellar mass, g-r-magnitude, and SFR-stellar mass planes, using literature boundaries (Eqs. 1-6). These occupancy fractions and the overlap matrix are what carry the argument that the definitions trace different subpopulations.
What would settle it
Re-run the overlap analysis on an independent homogeneous sample (for example, galaxies with integral-field spectroscopy) using the same four definitions; if pairwise overlap fractions exceed roughly 0.7, the 'not interchangeable' claim fails. Alternatively, recompute Table III with non-parametric GV boundaries determined by a Gaussian mixture fit to the colour distributions and check whether the sSFR-selected sample remains the most projection-invariant.
Extended reading notes
Core claim
The central claim is that the green valley is not a single population recoverable by any one observable. Using a matched RCSED+GSWLC sample with SED-derived stellar masses and star formation rates, the paper selects green valley galaxies by four independent single-parameter cuts and projects each onto two-dimensional diagnostic planes. The NUV-r-selected sample is compact in UV colour space but shifts toward red-sequence galaxies and low SFR; the u-r-selected sample is tightly confined in optical colour space but biased toward high SFR; the D_n(4000)-selected sample is the most heterogeneous, spanning both star-forming and quiescent systems; and the sSFR-selected sample behaves most consistently across all projections. Overlap fractions between definitions are modest—about one-third of galaxies are shared by the better-matching pairs, and less for the UV-optical pair. Because the stellar mass distributions are nearly identical while the SFR and sSFR distributions differ strongly (KS statistics up to ~0.74), the paper concludes that the differences reflect star-formation activity rather than stellar mass, and that the one-dimensional definitions are not interchangeable.
Load-bearing premise
The analysis assumes that the literature-defined green valley boundaries—the colour ranges, the D_n(4000) and sSFR cuts, and the fitted lines in the colour-mass planes—remain valid for this particular homogeneous sample at 0.01<z<0.30, so the classification percentages and overlap fractions would shift if those calibrations do not transfer, and the main-sequence SFR(M*) relation behind ΔSFR is not stated for independent verification.
Editorial extensions
If this is right
- A study that quotes a green valley fraction or property based on a single diagnostic cannot be directly compared with a study using a different diagnostic; the systematic offsets are comparable to the physical differences being measured.
- UV-based (NUV-r) selections preferentially capture recently quenched, low-SFR systems, while optical u-r selections include many galaxies still forming stars, so interpretations of green valley morphology or environment depend on the chosen tracer.
- The sSFR-based definition is the most stable across projections and may be the most defensible single choice when a one-dimensional selection is required.
- Because stellar mass does not drive the differences, future work should treat star-formation activity—not mass—as the axis along which GV definitions diverge.
- The overlap regions between definitions, though small, may define a cleaner transitional subsample worth targeting in follow-up studies.
Reading between the lines
- If the four definitions genuinely trace distinct quenching phases, the small overlap subset should be the best 'true green valley' sample; a testable prediction is that those galaxies show the clearest intermediate spectral signatures (e.g., post-starburst Balmer absorption) and intermediate morphologies.
- The strong divergence between NUV-r and u-r selections in SFR space suggests dust attenuation contributes as much as recent star-formation timescales; comparing attenuation-corrected and uncorrected versions of the same cuts would separate these effects.
- The main-sequence relation used to define ΔSFR is not stated in the paper, so the SFR-M* classification fractions in Table III are not reproducible as written; re-running with an explicit main-sequence calibration (e.g., from the same GSWLC data) would test the robustness of the 'sSFR is most consistent' conclusion.
Signed reviews
Editorial analysis
A structured set of objections, weighed in public.
Referee Report
Summary. The manuscript compares four common single-parameter green-valley definitions (u−r colour, NUV−r colour, D_n(4000) spectral index, and sSFR) using a homogeneous GALEX/SDSS sample drawn from RCSED and GSWLC in the redshift range 0.01 < z < 0.30. It reports pairwise overlap fractions (Fig. 3), median and KS statistics for M*, SFR, and sSFR distributions (Tables I–II), and the location of each selected sample above/within/below GV bands in four two-dimensional planes (Table III). The main claim is that the four diagnostics identify statistically distinct subpopulations and are not interchangeable, with the sSFR selection showing the most consistent behavior across projections and the NUV−r selection biased toward red, more passive systems. The paper argues that these differences reflect distinct star-formation timescales and that single-diagnostic GV studies carry definition-dependent biases.
Significance. If the quantitative results are reliable, the paper makes a useful, straightforward contribution to the ongoing debate about the physical meaning of the green valley. The overlap matrix in Fig. 3 provides a direct pairwise quantification of diagnostic overlap that is largely independent of the adopted two-dimensional boundaries, and the finding that all four samples span similar stellar masses is a clean result. The demonstration that common GV cuts are far from equivalent, and that UV-optical, optical, and sSFR choices emphasize different stages of quenching, would be practically important for interpreting single-diagnostic galaxy-evolution studies. The analysis benefits from the use of a consistently processed multi-wavelength catalog (RCSED + GSWLC) with SED-based physical properties. However, the manuscript's reproducibility and the diagnostic-specific conclusions are currently limited by an internal sample-size contradiction and by unstated or unvalidated calibrations, so the significance can only be assessed after these issues are fixed.
major comments (4)
- [Section II.B, Fig. 3, Table III] There is an internal contradiction in the sample sizes. The text states that the D_n(4000) selection yields 53,550 galaxies and the sSFR selection yields 96,953 galaxies, but the diagonal of the overlap matrix and the 'Total' column of Table III assign 53,550 to sSFR and 96,953 to D_n(4000). Because all overlap fractions and projected percentages are normalized by these totals, the quantitative results as printed are not reproducible; the assignment should be corrected and all affected numbers re-derived.
- [Section III, Eq. (5)] The definition of ΔSFR is incomplete because the main-sequence relation SFR_MS(M*) is never specified. The SFR–M* rows of Table III, and in particular the statement that the sSFR-selected sample is 'most consistent' (62.1% inside the GV), depend on this calibration; the projection of a fixed log sSFR interval into the ΔSFR GV band is not independent of the chosen SFR_MS. Please state the adopted relation (with its source and redshift range) and test how the Table III fractions respond to plausible variations in its slope and zero-point.
- [Section III, Eqs. (3), (4), (6), Table III] The above/within/below classification in Table III is computed against literature boundaries, including two self-citations (Refs. [10] and [32]), but the manuscript never validates that these boundaries describe the blue cloud and red sequence ridges of the new RCSED/GSWLC sample at 0.01 < z < 0.30. The diagnostic-specific conclusions (e.g., NUV−r bias to red systems, u−r bias to star-forming systems, D_n(4000) heterogeneity) are read directly from Table III, so a mismatch between the imported calibrations and the sample would change the conclusions. Please re-derive or at least test the boundaries on this sample and report the sensitivity of Table III to boundary shifts.
- [Figures 3 and Table III] The overlap fractions and classification percentages are reported without any uncertainty estimates. With sample sizes of roughly 5×10^4–1.3×10^5, Poisson errors are small, but the comparison is presented as a quantitative statement of diagnostic dependence; bootstrap or jackknife uncertainties (and, where possible, systematic uncertainties from boundary choices) should be reported.
minor comments (6)
- [Section II.B] The NUV−r sample size is given as 49,706 in the text but as 49,709 in Fig. 3 and Table III; please reconcile these numbers.
- [Introduction] The survey is referred to as 'GAMAS' in the first paragraph of the Introduction; this should be 'GAMA' (see Refs. [22,23]).
- [Reference [19]] The word 'Forthcomig' is a typo and should be 'Forthcoming'.
- [Section III] The statement 'supported by very small overall chi-square test p-value (p < 0.001)' should be accompanied by the chi-square statistic and the number of degrees of freedom.
- [Section III] The criterion used to classify 'Five of the six pairwise comparisons are clearly different based on the KS effect size' is not defined; please specify the threshold used for the effect size.
- [Figures 3, 5, and 6] In Fig. 3, the caption should state explicitly that each off-diagonal entry is the fraction of the row-definition sample that also satisfies the column-definition criterion; Figs. 5 and 6 should include a color bar for the sSFR scale.
Circularity Check
The non-interchangeability claim is supported by the independent overlap matrix, but the 'sSFR most consistent' and 'u-r tightly confined' conclusions are largely predetermined by the definitions and by self-cited calibrations.
-
self definitional
[Section II.B (sSFR selection) and Section III, Eq. (5) and the ΔSFR GV classification; Table III, SFR vs. M* row.]
"Finally, we define a GV sample using sSFR, selecting galaxies with −11.6<log10(sSFR/yr−1)<−10.8 ... ΔSFR = log10(SFRgal)−log10(SFRMS) ... −1.1≤ΔSFR<−0.5dex: GV galaxies"
Since sSFR ≡ SFR/M* and ΔSFR ≡ log SFR − log SFRMS, we have ΔSFR = log sSFR + log M* − log SFRMS. The sSFR selection is a fixed interval in log sSFR, while the 'GV' band in the SFR–M* plane is a fixed interval in ΔSFR. The paper never specifies SFRMS(M*), so the 62.1% within-GV entry in Table III is not an independent validation of the sSFR definition: it is the projection of the sSFR cut onto a ΔSFR band whose zero-point is unstated. With the usual power-law main sequence (slope near unity), the two cuts coincide up to a constant offset, so the conclusion that the sSFR-selected sample is 'most consistent' and shows a 'strong concentration within the GV in the SFR–stellar mass plane' is true partly by construction.
-
self definitional
[Section II.B (u−r selection) and Section III, Eqs. (3)–(4) with Table III, u−r vs. M* row.]
"We also define an optically selected GV population using the colour range 1.8< u−r <2.4 ... following the empirical calibration of Refs. [10, 14, 32], we adopt the relations, u−r=−0.24+0.25 log10(M⋅/M⊙), u−r=−0.75+0.25 log10(M⋅/M⊙), which provide the upper and lower boundaries of the GV in u−r colour as a function of M⋅."
For log M* ≈ 10.7, the median stellar mass of the samples in Table I, Eq. (4) and Eq. (3) give GV boundaries u−r ≈ 1.93 and 2.44, which almost exactly bracket the adopted selection cut 1.8<u−r<2.4. The Table III entry showing 75.77% of the u−r sample 'within' the u−r–M* GV is therefore a direct consequence of choosing the selection interval and the mass-dependent boundaries to overlap, not an empirical discovery that the u−r definition is 'tightly confined'. Two of the three calibration references (Refs. [10] and [32]) are earlier papers by the same authors, so the 'tightly confined' conclusion re-imports their own calibration rather than providing an independent check.
full rationale
The paper's central claim that the four GV definitions are not interchangeable is independently supported by the pairwise overlap matrix (Fig. 3) and by the KS comparisons of M*, SFR, and sSFR distributions, which do not reduce to the adopted boundary equations. However, the diagnostic-specific narrative in Table III is partially circular. The sSFR 'consistency' in the SFR–M* plane is built from the same SFR and M* that define sSFR, with the SFRMS relation never stated, so the 62.1% within-GV fraction is not a free prediction. The u−r 'tight confinement' in the u−r–M* plane is likewise a near-tautological overlap between the adopted colour cut and the self-cited mass-dependent GV band. The remaining calibrations (Eqs. 1–2 and 6) are taken from external literature without retesting on this homogeneous sample; that is an unvalidated-assumption risk rather than circularity. Additionally, there is an internal inconsistency: Section II.B assigns 53,550 galaxies to Dn(4000) and 96,953 to sSFR, while Fig. 3 and Table III use the opposite assignment, undermining the reproducibility of the printed overlap fractions. Overall, the non-interchangeability conclusion has genuine independent content, but two of the paper's most prominent interpretive claims are substantially predetermined by construction.
Assumptions & free parameters
free parameters (6)
- u-r GV selection range =
1.8 < u-r < 2.4
- NUV-r GV selection range =
4 < NUV-r < 5
- Dn(4000) GV selection range =
1.5 < Dn(4000) < 1.8
- sSFR GV selection range =
-11.6 < log10(sSFR/yr^-1) < -10.8
- 2D GV boundary calibrations =
u-r vs M*: slope 0.25, intercepts -0.24 and -0.75; NUV-r vs M*: slope 0.92, intercept -5.52, +/-0.5; g-r vs M_r…
- Delta_SFR GV thresholds and MS calibration =
GV: -1.1 <= Delta_SFR < -0.5; MS: -0.5 to 0.5; SB: >0.5; quiescent: <-1.1; MS relation not stated
assumptions (5)
- domain assumption GSWLC SED-derived stellar masses and SFRs are accurate and homogeneous across the sample
- domain assumption The adopted literature GV boundaries remain valid for the new homogeneous sample at 0.01 < z < 0.30
- domain assumption K-corrections and foreground extinction corrections produce unbiased rest-frame colors
- domain assumption The RCSED-GSWLC cross-match with a 3 arcsec radius does not introduce significant incompleteness or contamination
- domain assumption The main-sequence SFR(M*) relation underlying Delta_SFR is correctly calibrated for this sample
Cite this review
Pith. "Pith review of A systematic comparison of green valley selection criteria across multiparameter spaces using a homogeneous ultraviolet-optical dataset." pith.science (2026). https://pith.science/paper/GY6VPSPP
@misc{pith2026260812260,
  author       = {Pith},
  title        = {Pith review of: A systematic comparison of green valley selection criteria across multiparameter spaces using a homogeneous ultraviolet-optical dataset},
  year         = {2026},
  howpublished = {\url{https://pith.science/paper/GY6VPSPP}},
  note         = {Machine review of arXiv:2608.12260}
}
abstract
We present a systematic comparison of commonly adopted green valley (GV) selection criteria by examining their distributions across multiple observational and physical parameter spaces. Using a homogeneous ultraviolet-optical dataset constructed from the Galaxy Evolution Explorer (GALEX) and the Sloan Digital Sky Survey (SDSS), we construct GV samples based on rest-frame $u-r$ and NUV$-r$ colours, specific star formation rate, and the $D_n(4000)$ spectral index. These samples are analysed in colour--stellar mass, colour--magnitude, and star formation rate--stellar mass diagrams. We find that the different selection criteria identify statistically distinct subsets of GV galaxies occupying different regions of parameter space. Ultraviolet-based selections are compact in NUV$-r$ colour space but shift toward optically red galaxies and lower star formation activity in the star formation rate--stellar mass plane. The $u-r$-selected sample is more tightly confined in optical colour space but is biased toward higher star formation rates, whereas the $D_n(4000)$-based selection yields the most heterogeneous population. In contrast, the sSFR-selected GV sample exhibits the most consistent behaviour across all parameter spaces. Despite these differences, all selection methods span a similar stellar mass range, indicating that the observed variations arise primarily from differences in star formation activity rather than stellar mass. The relatively small overlap between the different selection criteria demonstrates that GV identification is strongly diagnostic-dependent and that the commonly adopted one-dimensional definitions are not interchangeable. These results highlight the importance of combining complementary diagnostics to obtain a more complete and physically meaningful picture of transitional galaxy populations.
Figures


Figures from the paper (3 more)


Reference graph
Works this paper leans on
-
[10]
Main sequence of star formation and colour bimodality considering galaxy environment
P. Privatus, U. D. Goswami,Main sequence of star formation and colour bimodality considering galaxy environment, Phys. Dark Universe 47, 101802 (2025) [arXiv:2405.00481]
work page Pith review arXiv 2025
-
[32]
P. Privatus, U. D. Goswami,Ageing and quenching: influence of galaxy environment and nuclear activity in transition stage, Physica Scripta100, 035023 (2025). 12
work page 2025
-
[1]
T. Naab, J. P. Ostriker,Theoretical challenges in galaxy formation, ARA&A55, 59 (2017)
work page 2017
-
[2]
N. M. F ¨orster-Schreiber, S. Wuyts,Star-forming galaxies at cosmic noon, ARA&A58, 661 (2020)
work page 2020
-
[3]
A. C. Fabian,Observational evidence of active galactic nuclei feedback, ARA&A50, 455 (2012)
work page 2012
-
[4]
Y . Peng, S. J. Lilly, K. Kovaˇc, M. Bolzonella, et al.,Mass and environment as drivers of galaxy evolution in SDSS and zCOSMOS and the origin of the Schechter function, ApJ721, 193 (2010) [arXiv:1003.4747]
arXiv 2010
-
[5]
K. Decker French,Evolution Through the Post-starburst Phase: Using Post-starburst Galaxies as Laboratories for Understanding the Processes that Drive Galaxy Evolution, PASP133, 072001 (2021)
work page 2021
-
[6]
A. Saintonge, B. Catinella,The cold interstellar medium of galaxies in the local universe, ARA&A60, 319 (2022)
work page 2022
Show all 65 references
-
[7]
Kalinova, D
V . Kalinova, D. Colombo, S. F. S´anchez, K. Kodaira, et al.,Star formation quenching stages of active and non-active galaxies, A&A648, A64 (2019)
2019
-
[8]
D. G. York, J. Adelman, J. E. Anderson, S. F. Andersonet al.,The Sloan Digital Sky Survey: Technical Summary, AJ120, 1579 (2000) [arXiv:astro-ph/0006396]
2000 arXiv
-
[9]
D. C. Martin, J. Fanson, D. Schiminovich, P. Morrissey, et al.,The Galaxy Evolution Explorer: A Space Ultraviolet Survey Mission, ApJL619, L1 (2005)[arXiv:astro-ph/0411302]
2005 arXiv
-
[11]
Strateva, ˇZ
I. Strateva, ˇZ. Ivezi´c, G. R. Knapp, V . K. Narayanan, et al.,Color Separation of Galaxy Types in the Sloan Digital Sky Survey Imaging Data, AJ122, 1861 (2001)
2001
-
[12]
Baldry, K
I.K. Baldry, K. Glazebrook, J. Brinkmann, ˇZ. Ivezi´c, et al.,Quantifying the bimodal color-magnitude distribution of galaxies, ApJ600, 681 (2004) [arXiv:astro-ph/0309710]
2004 arXiv
-
[13]
T. K. Wyder, D. C. Martin, D. Schiminovich, M. Seibert, et al.,The UV-Optical Galaxy Color-Magnitude Diagram. I. Basic Properties, ApJS173, 293 (2007)
2007
-
[14]
Schawinski, C
K. Schawinski, C. M. Urry, B. D. Simmons, L. Fortson, et al.,The Green Valley is a Red Herring: Galaxy Zoo reveals two evolutionary pathways towards quenching of star formation in early- and late-type galaxies, MNRAS440, 889 (2014)
2014
-
[15]
Y . Li, T. Wang, J. Shi, et al.,Galaxy quenching time-scales from a forensic reconstruction of their colour evolution, MNRAS518, 1234 (2023)
2023
-
[16]
SalimGreen valley galaxies, Serbia Astronomical Journal189, 1 (2014) [arXiv:1501.01963]
S. SalimGreen valley galaxies, Serbia Astronomical Journal189, 1 (2014) [arXiv:1501.01963]
2014 arXiv
-
[17]
G. B. Brammer, K. E. Whitaker, P. G. Van Dokkum, D. Marchesini, et al.,The dead sequence: a clear bimodality in galaxy colors from z= 0toz= 2.5, ApJ706, L173 (2009)
2009
-
[18]
A. J. Mendez, A. L. Coil, J. Lotz, S. Salim, et al.,AEGIS: The Morphologies of Green Galaxies at0.4< z <1.2, ApJ736, 110 (2011)
2011
-
[19]
Ascasibar, G
Y . Ascasibar, G. Kleijn, C. Lovell, G. De Lucias, et al.,Euclid Quick Data Release (Q1). A probabilistic classification of quenched galaxies, A&A Forthcomig (2025) [arXiv:2503.15315]
2025
-
[20]
Levis, V
S. Levis, V . Coenda, H. Muriel, M. Delos Rios, et al.,Galaxy evolution in groups: Transition galaxies in the IllustrisTNG simulations, A&A698, A57 (2025)
2025
-
[21]
Angthopo , I
J. Angthopo , I. Ferreras , J. Silk,Exploring a new definition of the green valley and its implications, MNRAS488, L99 (2019)
2019
-
[22]
Driver, DT
P. Driver, DT. Hill, LS. Kelvin, ASG. Robotham, et al.,Galaxy and Mass Assembly (GAMA): survey diagnostics and core data re- lease,MNRAS413, 971 (2011)[arXiv:1009.0614]
2011 arXiv
-
[23]
Phillipps, M
S. Phillipps, M. N. Bremer, A. M. Hopkins, R. De Propris, et al.,Galaxy and Mass Assembly (GAMA): time-scales for galaxies crossing the green valley, MNRAS485, 5559 (2019)
2019
-
[24]
R. J. Williams, R. F. Quadri, M. Franx, P. Van Dokkum, et al.,Detection of quiescent galaxies in a bicolor sequence fromz= 0–2, ApJ 691, 1879 (2009)
2009
-
[25]
Muzzin, D
A. Muzzin, D. Marchesini, M. Stefanon, M. Franx, et al.,The evolution of the stellar mass functions of star-forming and quiescent galaxies to z= 4 from the COSMOS/UltraVISTA survey, ApJ777, 18 (2013)
2013
-
[26]
A. J. Battisti, D. Calzetti, R. R. Chary, et al.,Characterizing dust attenuation in local star-forming galaxies: Uv and optical reddening, ApJ818, 13 (2016)
2016
-
[27]
Coenda, H
V . Coenda, H. J. Mart´ınez, and H. Muriel,Green Valley Galaxies as a Transition Population in Different Environments, MNRAS490, 1076 (2019)
2019
-
[28]
H. Y . Jian, L. Lin, Y . Koyama, I. Tanaka, et al.,Redshift evolution of green valley galaxies in different environments from the hyper suprime-cam survey, ApJ894, 125 (2020)
2020
-
[29]
R. J. Smethurst , C. J. Lintott , B. D. Simmons , K. Schawinski, et al.,Galaxy Zoo: evidence for diverse star formation histories through the green valley, MNRAS450, 435 (2015)
2015
-
[30]
L. S. Kelvin, M. N. Bremer, S. Phillipps, et al.,Galaxy and Mass Assembly (GAMA): variation in galaxy structure across the green valley, MNRAS477, 4116 (2018)
2018
-
[31]
M. N. Bremer, S. Phillipps, L. S. Kelvin, et al.,Galaxy and Mass Assembly (GAMA): Morphological transformation of galaxies across the green valley, MNRAS476, 12 (2018)
2018
-
[33]
Smith, L
D. Smith, L. Haberzettl, L. E. Porter, et al.,Galaxy And Mass Assembly: galaxy morphology in the green valley, prominent rings, and looser spiral arms, MNRAS517, 4575 (2022)
2022
-
[34]
Lintott, K
CJ. Lintott, K. Schawinski, A. Slosar, K. Land, et al.,Galaxy Zoo: morphologies derived from visual inspection of galaxies from the Sloan Digital Sky Survey release,MNRAS413, 971 (2008)[arXiv:0804.4483]
2008 arXiv
-
[35]
Willett, CJ
KW. Willett, CJ. Lintott, SP. Bamford, KL. Masters, et al.,Galaxy Zoo 2: detailed morphological classifications for 304,122 galaxies from the Sloan Digital Sky Survey,MNRAS435, 2835 (2013)[arXiv:1308.3496]
2013 arXiv
-
[36]
Angthopo, B
J. Angthopo, B. R. Granett, F. La. Barbera, et al.,Retrieval of the physical parameters of galaxies from WEAVE-StePS-like data using machine learning, A&A690, A198 (2024)
2024
-
[37]
Siudek, K
M. Siudek, K. Małek, A. Pollo, T. Krakowski, et al.,The VIMOS Public Extragalactic Redshift Survey (VIPERS). The complexity of galaxy populations at0.4< z <1.3revealed with unsupervised machine-learning algorithms, A&A617, A70 (2018)
2018
-
[38]
A. F. L. Bluck, R. Maiolino, S. Brownson, et al.,The quenching of galaxies, bulges, and disks since cosmic noon-A machine learning approach for identifying causality in astronomical data, A&A659, A160 (2022)
2022
-
[39]
Ghosh, C
A. Ghosh, C. M. Urry, Z. Wang, K. Schawinski, et al.,Galaxy morphology network: A convolutional neural network used to study morphology and quenching in 100,000 sdss and 20,000 candels galaxies, ApJ895, 112 (2020)
2020
-
[40]
Aguilar-Arg ¨uello, G
G. Aguilar-Arg ¨uello, G. Fuentes-Pineda, H. M. Hern ´andez-Toledo, L. A. Mart ´ınez-V´azquez, et al.,Morphological classification of galaxies through structural and star formation parameters using machine learning, MNRAS537, 876 (2025)
2025
-
[41]
Sanjaripour, A
S. Sanjaripour, A. Aravindan, G. Canalizo, S. Hemmati, et al.,Selection of Dwarf Galaxies Hosting Active Galactic Nuclei: A Measure of Bias and Contamination Using Unsupervised Machine Learning Techniques, ApJ992, 138 (2025)
2025
-
[42]
Turner, M
S. Turner, M. Siudek, S. Salim, I. K. Baldry, et al.,Synergies between low- and intermediate-redshift galaxy populations revealed with unsupervised machine learning, MNRAS503, 3010 (2021)
2021
-
[43]
Wright, PRM
EL. Wright, PRM. Eisenhardt, AK. Mainzer, et al.,The Wide-field Infrared Survey Explorer (WISE): Mission Description and Initial On-orbit Performance,ApJ140, 1868 (2010)[arXiv:1008.0031]
2010 arXiv
-
[44]
Guzzo, M
L. Guzzo, M. Scodeggio, B. Garilli, BR. Granett, et al.,The VIMOS Public Extragalactic Redshift Survey (VIPERS)-An unprecedented view of galaxies and large-scale structure at0.5< z <1.2, A&A566, A108 (2014)[arXiv:1303.2623]
2014 arXiv
-
[45]
Chilingarian, I
I. Chilingarian, I. Zolotukhin, I. Katkov, A. Melchior, et al.,RCSED—A value-added reference catalog of spectral energy distributions of 800,299 galaxies in 11 ultraviolet, optical, and near-infrared bands: Morphologies, colors, ionized gas, and stellar population prop- erties...
2017 arXiv
-
[46]
Salim, JC
S. Salim, JC. Lee, S. Janowiecki, E. Cunha, et al.,GALEX-SDSS-WISE Legacy Catalog (GSWLC): Star Formation Rates, Stellar Masses and Dust Attenuations of 700,000 Low-redshift Galaxies,ApJS219, 12 (2016)[arXiv:1610.00712]
2016 arXiv
-
[47]
Lawrence, SJ
A. Lawrence, SJ. Warren, O. Almaini, AC. Edge, et al.,The UKIRT Infrared Deep Sky Survey (UKIDSS),MNRAS379, 1599 (2007)[arXiv:0604426]
2007
-
[48]
Abdurro’uf, K
N. Abdurro’uf, K. Accetta, C. Aerts, V . Silva Aguirre, et al.,The seventeenth data release of the sloan digital sky surveys: Complete release of MaNGA, MaStar, and APOGEE-2 data, ApJS259, 2 (2022) [arXiv:2112.02026 ]
2022
-
[49]
M. J. Seaton,Interstellar Extinction in the UV, MNRAS187, 73P (1979)
1979
-
[50]
Chilingarian, A
I. Chilingarian, A. Melchior, I. Zolotukhin,Analytical approximations of K-corrections in optical and near-infrared bands, MNRAS405, 1409 (2010) [arXiv:1002.2360]
2010 arXiv
-
[51]
Kauffmann, T
G. Kauffmann, T. M. Heckman, S. D. M. White, et al.,Stellar masses and star formation histories for 105 galaxies from the Sloan Digital Sky Survey, MNRAS341, 33 (2003) [arXiv:astro-ph/0205070]
2003 arXiv
-
[52]
Salim, D
S. Salim, D. Schiminovich, M. Rich, et al.,UV Star Formation Rates in the Local Universe, ApJS173, 267 (2007) [arXiv:0704.3611]
2007 arXiv
-
[53]
J. L. Hodges,The significance probability of the Smirnov two-sample test, Arkiv f ¨or matematik3, 469 (1958)
1958
-
[54]
Harari, S
D. Harari, S. Mollerach,Kolmogorov-Smirnov test as a tool to study the distribution of ultra-high energy cosmic ray sources, A&A394, 916 (2009) [arXiv:0811.0008]
2009 arXiv
-
[55]
Blanton, R
M. Blanton, R. Lupton, D. Schlegel, M. Strauss, et al.,The properties and luminosity function of extremely low luminosity galaxies, AJ 631, 208 (2005)
2005
-
[56]
Dhiwar , K
S. Dhiwar , K. Saha , A. Dekel , A. Paswan, et al.,Witnessing the star-formation quenching in L ∗ ellipticals, MNRAS518, 4943 (2023) [arXiv:2211.08884]
2023 arXiv
-
[57]
Privatus, U
P. Privatus, U. D. Goswami,Mapping Nearby Galaxies with Apache Point Observatory: Group and field galaxies’ morphologies in the colour-magnitude plane, Phys.Dark Universe49, 101987 (2025) [arXiv:2505.01776]
2025 arXiv
-
[58]
K. G. Noeske, S. M. Faber, D. Koo, et al.,Star Formation in AEGIS Field Galaxies sincez= 1.1: The Dominance of Gradually Declining Star Formation, ApJ660, L43 (2007) [arXiv:astro-ph/0701924]
2007 arXiv
-
[59]
Elbaz, E
D. Elbaz, E. Daddi, G. Le Borgne, et al.,The reversal of the star formation–density relation in the distant universe, A&A468, 33 (2007)
2007
-
[60]
Salim, J
S. Salim, J. C. Lee, C. Ly, J. Brinchmann, et al.,A critical look at the mass–metallicity–star formation rate relation in the local universe. I. An improved analysis framework and confounding systematics, ApJ797, 126 (2014)
2014
-
[61]
Rodighiero, E
G. Rodighiero, E. Daddi, M. B ´ethermin, et al.,The Lesser Role of Starbursts in Star Formation atz= 2, ApJL739, L40 (2011)
2011
-
[62]
Salim, D
S. Salim, D. C. Martin, G. A. P. Miller, et al.,UV Star Formation Rates in the Local Universe, ApJS173, 267 (2007)
2007
-
[63]
A. H. Maller, T. J. Cox, R. S. Somerville, et al.,Dust, Star Formation, and the Ultraviolet-Optical Color Distribution of Galaxies, ApJ 691, 394 (2009) [arXiv:0801.3272]
2009 arXiv
-
[64]
D. C. Martin, C. K. Xu, D. Schiminovich, et al.,The UV Galaxy Luminosity Function and Star Formation Rate atz∼0, ApJS173, 342 (2007) [arXiv:0708.0426]
2007 arXiv
-
[65]
Brinchmann, S
J. Brinchmann, S. Charlot, S. D. M. White, et al.,The Physical Properties of Star-forming Galaxies in the Low-redshift Universe, MNRAS 351, 1151 (2004) [astro-ph/0311060]
2004 arXiv
Reviewed August 16, 2026 · model on record in the stance chip above.
Discussion (0). Continue with ORCID to comment.