REVIEW 4 major objections 5 minor 42 references
ChordLink: A New Hybrid Visualization Model
T0 review · 4 major / 5 minor · reviewed 2026-08-14 · deepseek-v4-flash
Pith's one-line read ChordLink embeds dense communities as chord diagrams inside a node-link drawing, preserving the outside layout and the user's mental map.
desk verdict ChordLink is a coherent new hybrid visualization model with a sound stability-by-construction core, but the readability and effectiveness claims rest on unvalidated heuristics and case studies—worth a referee, not yet strong evidence. read the letter →
The pith
A machine-rendered reading of the paper's core claim, the machinery that carries it, and where it could break.
The reading
What carries the argument
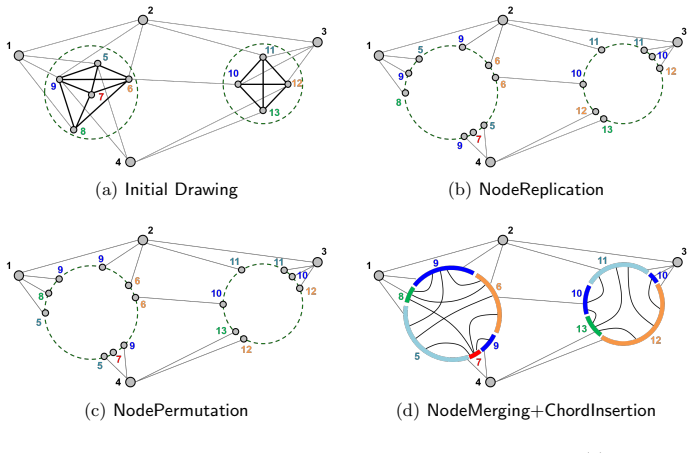
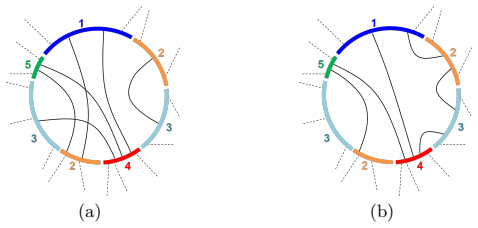
The load-bearing mechanism is node replication on the boundary of the cluster's circular region, operating through four phases: NodeReplication, NodePermutation, NodeMerging, and ChordInsertion. In NodeReplication, every extrovert node's copy is placed at the intersection of its external edge with the boundary, which preserves the outside drawing; in NodePermutation, copies are permuted only when they share the same external neighbor, again to keep outside geometry intact. A circular arc then replaces each maximal block of consecutive copies of the same node, and chords for internal edges are selected greedily to minimize a cost that combines the number of crossings and small crossing angles. The dynamic program for NodePermutation is exact when the copies in each group are consecutive along the boundary, and is used as a heuristic otherwise.
What would settle it
A benchmark measurement of node displacement and edge crossings before and after ChordLink transformations would settle the central claim: if redrawing a cluster as a chord diagram, or radially deforming a non-circular selection, moves external nodes beyond standard stability thresholds or introduces new crossings, then the mental-map benefit is not actually delivered.
Extended reading notes
Core claim
ChordLink's discovery is that the two competing goals—showing a dense community's internal structure and keeping the surrounding sparse network stable—can be reconciled by drawing the community as a chord diagram, in which nodes are circular arcs on the boundary and edges are chords inside, with the diagram's boundary coinciding with the circular region the community already occupied. Each extrovert node is replicated at the boundary points where its external edges attach, while introvert nodes appear once; the copies are permuted to group same-node copies together, merged into circular arcs, and internal edges are inserted as chords. Because the external edges are re-attached at their original boundary positions, the layout outside the cluster is unchanged, which supports the mental map during interactive selection, inspection, collapsing, and expansion. The paper also frames the two underlying optimization tasks—minimizing non-consecutive copies in NodePermutation and minimizing weighted crossings in ChordInsertion—and gives a dynamic program and a greedy algorithm for them.
Load-bearing premise
The central claim depends on the NodePermutation dynamic program and ChordInsertion greedy heuristic producing layouts that are readable and stable, yet the paper reports no quantitative evaluation of the resulting drawings.
Editorial extensions
If this is right
- If the model works as claimed, an interactive system can switch a dense community to a chord diagram without recomputing the global layout, preserving the user's spatial memory during analysis.
- Node replication does double duty: it keeps outside edges attached at the same boundary points and gives extra freedom to reduce crossings among internal chords.
- The NodePermutation and ChordInsertion problems are stated as independent optimization problems, opening the door to exact algorithms and complexity proofs.
- The model scales in practice only to communities of about 20-25 nodes, since larger chord diagrams become hard to read.
Reading between the lines
- The stability guarantee is strongest for circular selections; for rectangular or lasso selections the paper's radial deformation changes distances and may stretch areas, so a quantitative distortion measure would tell whether the mental-map benefit survives non-circular choices.
- Because the dynamic program is exact only when copies of each external neighbor's group are consecutive, the general permutation problem is a natural place to look for a hardness proof; comparing the heuristic to exact solutions on small random instances would show the price of that shortcut.
- The model's community selection is manual; coupling it with an automatic community-detection step could turn ChordLink from a proof-of-concept into a full analysis pipeline, and a user study would be needed to confirm that path tracing in chords beats matrix views.
Signed reviews
Editorial analysis
A structured set of objections, weighed in public.
Referee Report
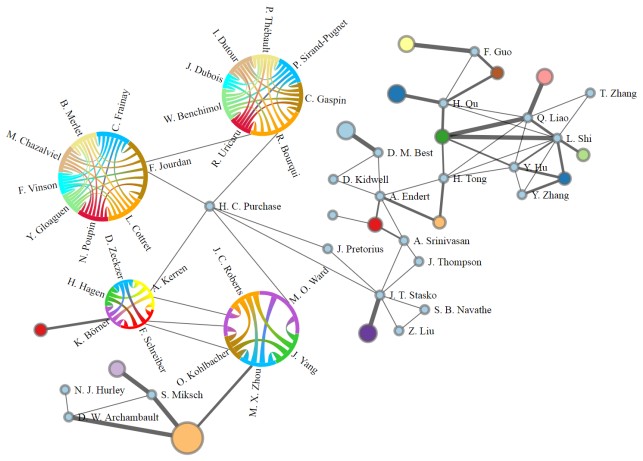
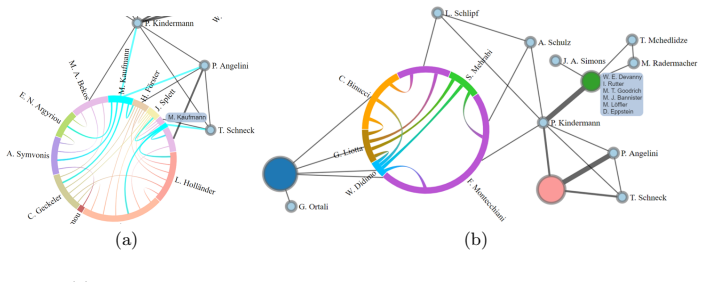
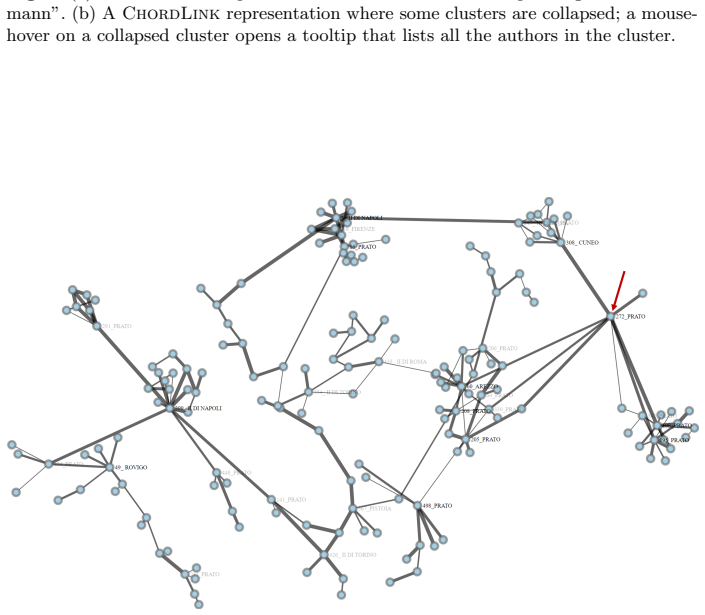
Summary. The paper proposes ChordLink, a hybrid visualization model that embeds chord diagrams for dense communities into a node-link diagram of a globally sparse network. The model is described through four phases: NodeReplication, NodePermutation, NodeMerging, and ChordInsertion. For NodePermutation, the paper gives a dynamic programming algorithm, exact when each external neighbor's copies are consecutive along the cluster boundary, and used as a heuristic otherwise. For ChordInsertion, it gives a greedy algorithm that minimizes a cost combining crossings and crossing angles. The paper also describes a JavaScript/D3.js prototype, reports two case studies (a fiscal network and a DBLP co-authorship network), and claims that the model supports the two tasks of overviewing the sparse global structure and inspecting dense communities while preserving drawing stability. The authors acknowledge in Section 5 that readability degrades for clusters larger than about 20-25 nodes.
Significance. If the claims were fully validated, ChordLink would be a useful addition to hybrid network visualization, complementing NodeTrix with a representation that keeps edges as curves and therefore may better support path-reading and mental-map preservation. The model is precisely specified and the algorithms are described in sufficient detail to be reimplemented; the recurrence and greedy procedure are nontrivial and the proposed optimization problems are of independent interest. The stability property for circular selections is supported by construction, and the cost functions are motivated by existing readability evidence rather than by fitting parameters to the presented examples. The main weakness is evidentiary: there is no user study, no quantitative comparison with NodeTrix or plain node-link layouts, and no experimental validation of the two heuristics that determine the quality of the resulting chord diagrams.
major comments (4)
- [Section 3.2, NodePermutation] The dynamic program (Eq. 1) is exact only when all copies in each group are consecutive along R(C); when this condition is not met, the paper explicitly says the algorithm is used as a heuristic. Since the readability of the final chord diagram depends on the quality of this permutation, the paper needs either a characterization of when the condition holds, a comparison against optimal solutions on small instances, or a lower-bound-based quality analysis. Without such evidence, the claim that the model produces well-organized chord diagrams for arbitrary user selections is not established.
- [Section 3.2, ChordInsertion] The greedy algorithm optimizes the point-based cost α(S) after collapsing each circular arc to a point, but the final drawing expands the arcs and distributes incident chords along them. The paper argues that crossing numbers of non-adjacent chords are invariant under this expansion, but the crossing angles realized in the final drawing are not necessarily those computed from the point model via a(wz,xy). The greedy also has no approximation guarantee. Please provide a quantitative check of the realized crossing counts and angles against the optimized cost, or a justification for why the discrepancy is negligible.
- [Section 4 and Section 5] The central claim is that ChordLink simultaneously supports tasks T1 and T2 while preserving stability, but the only evidence is descriptive case studies and citations of prior readability work. There is no user study, no quantitative comparison with NodeTrix or a standard node-link layout on the same networks, and Section 5 concedes that readability degrades for clusters above 20-25 nodes. This is a load-bearing gap: it leaves the effectiveness half of the central claim unsupported. The authors should either add empirical validation (even a small controlled study or a readability metric comparison) or carefully scale back the claims to what the case studies can support.
- [Appendix A] The stability guarantee stated in the introduction and in the description of the general strategy applies only when the selected cluster can be enclosed in a circular region that excludes all other nodes. For rectangular or lasso selections, Appendix A moves non-cluster nodes radially, so the geometry outside the cluster is changed and the introduced distortion is not measured. This limitation should be stated in the contributions, and if non-circular selections are claimed as a feature, the distortion should be quantified.
minor comments (5)
- [Section 3.2, Eq. (1)] The recurrence for O_i(vi,j, vi,z) does not specify the base case for O_{k-1}; please state the initialization explicitly.
- [Section 3.2, NodePermutation] The preprocessing step that removes elements vi,j with no matching neighbor in the adjacent group and later reinserts them 'in any position between fi and li' needs a brief justification, since it is not obvious that this never increases the cost.
- [Figure 3] The caption says the cluster has 'seven circular arcs' while the text lists five nodes; please clarify how the arcs correspond to copies of nodes.
- [Section 3.1] The paper first says the selected cluster must lie in a topologically connected region and then assumes a circular region; the relationship between these conditions should be stated more precisely.
- [Section 4] No performance figures are given for the prototype, such as interaction latency on the 1766-node DBLP network; a brief performance characterization would help readers judge practical usability.
Circularity Check
No significant circularity: the ChordLink stability claim is an engineered invariant, and the algorithmic components are presented as heuristics with explicit caveats rather than as fitted predictions.
full rationale
The paper makes no empirical prediction that could reduce to its inputs: there are no fitted parameters, no calibrated model, and no claim that a quantity derived from data is independently predicted. The central stability property is guaranteed by construction: NodeReplication replaces each external segment (u,w) with its subsegment (u,v), NodePermutation only swaps copies within a common external neighbor's group, and NodeMerging preserves external incidences, so the geometry outside the cluster is unchanged by design. This is an engineered invariant, not a circular definition of the model's success. The readability goals are supported by cost functions cited from independent external studies (Purchase; Huang et al.; Ware et al.), and the paper explicitly labels its own algorithms as exact only under a restrictive condition (NodePermutation is exact when all copies in each group are consecutive and is otherwise used as a heuristic) and as a greedy heuristic in ChordInsertion. These are honest limitations, not disguised fits. Section 5 further concedes that readability degrades for clusters beyond 20-25 nodes, and Appendix A acknowledges that non-circular selections require radial movement of outside nodes; both caveats weaken the effectiveness claim but do not make it circular. No load-bearing self-citation chain, uniqueness theorem, or ansatz smuggled via citation is present. The case studies are illustrative and not used to validate the model's parameters. Therefore the appropriate finding is no circularity.
Assumptions & free parameters
assumptions (4)
- domain assumption Selected cluster nodes lie within a circular region R(C) that excludes all other nodes; if not, radial deformation can enforce this.
- domain assumption NodePermutation DP is exact only when copies in each group are consecutive; otherwise used as heuristic.
- domain assumption Minimizing crossings and maximizing crossing angles improves readability, based on prior empirical studies (refs 25,26,34,35,40).
- domain assumption Chord diagrams remain readable for clusters up to 20-25 nodes.
Cite this review
Pith. "Pith review of ChordLink: A New Hybrid Visualization Model." pith.science (2026). https://pith.science/paper/2LEDVWMV
@misc{pith2026190808412,
  author       = {Pith},
  title        = {Pith review of: ChordLink: A New Hybrid Visualization Model},
  year         = {2026},
  howpublished = {\url{https://pith.science/paper/2LEDVWMV}},
  note         = {Machine review of arXiv:1908.08412}
}
read the original abstract
Many real-world networks are globally sparse but locally dense. Typical examples are social networks, biological networks, and information networks. This double structural nature makes it difficult to adopt a homogeneous visualization model that clearly conveys an overview of the network and the internal structure of its communities at the same time. As a consequence, the use of hybrid visualizations has been proposed. For instance, NodeTrix combines node-link and matrix-based representations (Henry et al., 2007). In this paper we describe ChordLink, a hybrid visualization model that embeds chord diagrams, used to represent dense subgraphs, into a node-link diagram, which shows the global network structure. The visualization is intuitive and makes it possible to interactively highlight the structure of a community while keeping the rest of the layout stable. We discuss the intriguing algorithmic challenges behind the ChordLink model, present a prototype system, and illustrate case studies on real-world networks.
Figures

Figures from the paper (5 more)


Reference graph
Works this paper leans on
-
[1]
Journal of Graph Algorithms and Applications 21(4), 731–755 (2017)
Angelini, P., Da Lozzo, G., Di Battista, G., Frati, F., Patrignani, M., Rutter, I.: Intersection-link representations of graphs. Journal of Graph Algorithms and Applications 21(4), 731–755 (2017). https://doi.org/10.7155/jgaa.00437
-
[2]
In: Laramee, R.S., Kerren, A., Braz, J
Argyriou, E.N., Symvonis, A., Vassiliou, V.: A fraud detection visualiza- tion system utilizing radial drawings and heat-maps. In: Laramee, R.S., Kerren, A., Braz, J. (eds.) IVAPP 2014. pp. 153–160. SciTePress (2014). https://doi.org/10.5220/0004735501530160
-
[3]
Arleo, A., Didimo, W., Liotta, G., Montecchiani, F.: Profiling distributed graph processing systems through visual analytics. Future Generation Comp. Syst. 87, 43–57 (2018). https://doi.org/10.1016/j.future.2018.04.067
-
[4]
Batagelj, V., Brandenburg, F., Didimo, W., Liotta, G., Palladino, P., Patrig- nani, M.: Visual analysis of large graphs using (X,Y)-Clustering and hybrid visualizations. IEEE Trans. Vis. Comput. Graph. 17(11), 1587–1598 (2011). https://doi.org/10.1109/TVCG.2010.265
-
[5]
Bedi, P., Sharma, C.: Community detection in social networks. Wi- ley Interdiscip. Rev. Data Min. Knowl. Discov. 6(3), 115–135 (2016). https://doi.org/10.1002/widm.1178
-
[6]
Bostock, M., Ogievetsky, V., Heer, J.: D 3 Data-Driven Docu- ments. IEEE Trans. Vis. Comput. Graph. 17(12), 2301–2309 (2011). https://doi.org/10.1109/TVCG.2011.185
-
[7]
Journal of Graph Algorithms and Applications 22(2), 139–176 (2018)
Da Lozzo, G., Di Battista, G., Frati, F., Patrignani, M.: Computing NodeTrix representations of clustered graphs. Journal of Graph Algorithms and Applications 22(2), 139–176 (2018). https://doi.org/10.7155/jgaa.00461
-
[8]
Di Giacomo, E., Lenhart, W.J., Liotta, G., Randolph, T.W., Tappini, A.: (k, p)- planarity: A relaxation of hybrid planarity. In: WALCOM. Lecture Notes in Com- puter Science, vol. 11355, pp. 148–159. Springer (2019)
work page 2019
Show all 42 references
-
[9]
Algorithmica (May 2019)
Di Giacomo, E., Liotta, G., Patrignani, M., Rutter, I., Tappini, A.: NodeTrix planarity testing with small clusters. Algorithmica (May 2019). https://doi.org/10.1007/s00453-019-00585-6
2019 doi
-
[10]
Decision Support Systems 110, 71–83 (2018)
Didimo, W., Giamminonni, L., Liotta, G., Montecchiani, F., Pagliuca, D.: A visual analytics system to support tax evasion discovery. Decision Support Systems 110, 71–83 (2018). https://doi.org/10.1016/j.dss.2018.03.008
2018 doi
-
[11]
Didimo, W., Liotta, G., Montecchiani, F.: Network visualization for fi- nancial crime detection. J. Vis. Lang. Comput. 25(4), 433–451 (2014). https://doi.org/10.1016/j.jvlc.2014.01.002
2014 doi
-
[12]
Didimo, W., Montecchiani, F.: Fast layout computation of clustered networks: Algorithmic advances and experimental analysis. Inf. Sci. 260, 185–199 (2014). https://doi.org/10.1016/j.ins.2013.09.048
2014 doi
-
[13]
Dogrus¨ oz, U., Giral, E., Cetintas, A., Civril, A., Demir, E.: A layout al- gorithm for undirected compound graphs. Inf. Sci. 179(7), 980–994 (2009). https://doi.org/10.1016/j.ins.2008.11.017
2009 doi
-
[14]
(eds.): Overlaying graph links on treemaps
Fekete, J.D., Wang, D., Dang, N., Aris, A., Plaisant, C. (eds.): Overlaying graph links on treemaps. IEEE Symposium on Information Visualization Conference Compendium (demonstration) (2003)
2003
-
[15]
IEEE Computer 35(3), 66–71 (2002)
Flake, G.W., Lawrence, S., Giles, C.L., Coetzee, F.: Self-organization and identification of web communities. IEEE Computer 35(3), 66–71 (2002). https://doi.org/10.1109/2.989932
2002 doi
-
[16]
Physics Reports 486(3-5), 75–174 (2010)
Fortunato, S.: Community detection in graphs. Physics Reports 486(3-5), 75–174 (2010). https://doi.org/10.1016/j.physrep.2009.11.002
2010 doi
-
[17]
In: Nin, J., Villatoro, D
Gabrielli, L., Rinzivillo, S., Ronzano, F., Villatoro, D.: From tweets to semantic trajectories: Mining anomalous urban mobility patterns. In: Nin, J., Villatoro, D. (eds.) CitiSens 2013. pp. 26–35. Springer (2014). https://doi.org/10.1007/978-3- 319-04178-0 3
2014 doi
-
[18]
Information Visualization 4(2), 114–135 (2005)
Ghoniem, M., Fekete, J., Castagliola, P.: On the readability of graphs using node- link and matrix-based representations: a controlled experiment and statistical anal- ysis. Information Visualization 4(2), 114–135 (2005)
2005
-
[19]
Girvan, M., Newman, M.E.J.: Community structure in social and bio- logical networks. Proc. Natl. Acad. Sci. USA 99(12), 7821–7826 (2002). https://doi.org/10.1073/pnas.122653799
2002 doi
-
[20]
Harel, D.: On visual formalisms. Commun. ACM 31(5), 514–530 (1988). https://doi.org/10.1145/42411.42414
1988
-
[21]
IEEE Trans
Henry, N., Fekete, J., McGuffin, M.J.: NodeTrix: A hybrid visualization of social networks. IEEE Trans. Vis. Comput. Graph. 13(6), 1302–1309 (2007). https://doi.org/10.1109/TVCG.2007.70582
2007
-
[22]
Himsolt, M.: GML: A portable graph file format (technical report Universit¨ at Pas- sau) (2010)
2010
-
[23]
Bioinformatics 19(4), 532–538 (2003)
Holme, P., Huss, M., Jeong, H.: Subnetwork hierarchies of biochemical pathways. Bioinformatics 19(4), 532–538 (2003). https://doi.org/10.1093/bioinformatics/btg033
2003 doi
-
[24]
IEEE Trans
Holten, D.: Hierarchical edge bundles: Visualization of adjacency relations in hierarchical data. IEEE Trans. Vis. Comput. Graph. 12(5), 741–748 (2006). https://doi.org/10.1109/TVCG.2006.147
2006 doi
-
[25]
Huang, W., Eades, P., Hong, S.: Larger crossing angles make graphs easier to read. J. Vis. Lang. Comput. 25(4), 452–465 (2014). https://doi.org/10.1016/j.jvlc.2014.03.001
2014 doi
-
[26]
Huang, W., Hong, S., Eades, P.: Effects of sociogram drawing conventions and edge crossings in social network visualization. J. Graph Algorithms Appl. 11(2), 397–429 (2007). https://doi.org/10.7155/jgaa.00152
2007 doi
-
[27]
(eds.): Drawing Graphs, Methods and Models (the book grow out of a Dagstuhl Seminar, April 1999), Lecture Notes in Computer Science, vol
Kaufmann, M., Wagner, D. (eds.): Drawing Graphs, Methods and Models (the book grow out of a Dagstuhl Seminar, April 1999), Lecture Notes in Computer Science, vol. 2025. Springer (2001). https://doi.org/10.1007/3-540-44969-8
2001 doi
-
[28]
Genome Res
Krzywinski, M., Schein, J., Birol, n., Connors, J., Gascoyne, R., Hors- man, D., Jones, S.J., Marra, M.A.: Circos: An information aesthetic for comparative genomics. Genome Res. 19(9), 1639–1645 (2009). https://doi.org/10.1101/gr.092759.109
2009 doi
-
[29]
Ley, M.: The DBLP computer science bibliography, https://dblp.uni-trier.de
-
[30]
In: CIBB
Mahmoud, H., Masulli, F., Rovetta, S., Russo, G.: Community detection in protein-protein interaction networks using spectral and graph approaches. In: CIBB. Lecture Notes in Computer Science, vol. 8452, pp. 62–75. Springer (2013). https://doi.org/10.1007/978-3-319-09042-9 5
2013 doi
-
[31]
In: PacificVis
Muelder, C., Ma, K.: A treemap based method for rapid layout of large graphs. In: PacificVis. pp. 231–238. IEEE Computer Society (2008). https://doi.org/10.1109/PACIFICVIS.2008.4475481
2008
-
[32]
The European Physical Journal B-Condensed Matter and Com- plex Systems 38(2), 353–362 (2004)
Onnela, J., Kaski, K., Kert´ esz, J.: Clustering and information in correlation based financial networks. The European Physical Journal B-Condensed Matter and Com- plex Systems 38(2), 353–362 (2004). https://doi.org/10.1140/epjb/e2004-00128-7
2004 doi
-
[33]
Notices of the American Mathematical Society 56, 1082–1097, 1164–1166 (2009)
Porter, M.A., Onnela, J.P., Mucha, P.J.: Communities in networks. Notices of the American Mathematical Society 56, 1082–1097, 1164–1166 (2009)
2009
-
[34]
Interacting with Computers 13(2), 147–162 (2000)
Purchase, H.C.: Effective information visualisation: A study of graph drawing aesthetics and algorithms. Interacting with Computers 13(2), 147–162 (2000). https://doi.org/10.1016/S0953-5438(00)00032-1
2000 doi
-
[35]
Empirical Software Engineering 7(3), 233–255 (2002)
Purchase, H.C., Carrington, D.A., Allder, J.: Empirical evaluation of aesthetics- based graph layout. Empirical Software Engineering 7(3), 233–255 (2002)
2002
-
[36]
In: Proceedings of the 1996 IEEE Symposium on Visual Languages, Boulder, Colorado, USA, September 3-6, 1996
Shneiderman, B.: The eyes have it: A task by data type taxonomy for infor- mation visualizations. In: Proceedings of the 1996 IEEE Symposium on Visual Languages, Boulder, Colorado, USA, September 3-6, 1996. pp. 336–343 (1996). https://doi.org/10.1109/VL.1996.545307
1996
-
[37]
Sindre, G., Gulla, B., Jokstad, H.G.: Onion graphs: Asthetics and layout. In: VL. pp. 287–291. IEEE Computer Society (1993). https://doi.org/10.1109/VL.1993.269613
1993
-
[38]
In: Graph Drawing
Six, J.M., Tollis, I.G.: A framework for user-grouped circular drawings. In: Graph Drawing. Lecture Notes in Computer Science, vol. 2912, pp. 135–146. Springer (2003). https://doi.org/10.1007/978-3-540-24595-7 13
2003 doi
-
[39]
Sugiyama, K.: Graph Drawing and Applications for Software and Knowledge Engi- neers, Series on Software Engineering and Knowledge Engineering, vol. 11. World- Scientific (2002). https://doi.org/10.1142/4902
2002 doi
-
[40]
Information Visualization 1(2), 103–110 (2002)
Ware, C., Purchase, H.C., Colpoys, L., McGill, M.: Cognitive measure- ments of graph aesthetics. Information Visualization 1(2), 103–110 (2002). https://doi.org/10.1057/palgrave.ivs.9500013
2002 doi
-
[41]
In: ICIC (1)
Wu, H., He, J., Pei, Y., Long, X.: Finding research community in collaboration network with expertise profiling. In: ICIC (1). Lecture Notes in Computer Science, vol. 6215, pp. 337–344. Springer (2010). https://doi.org/10.1007/978-3-642-14922- 1 42
2010 doi
-
[42]
lasso” selection (i.e., a “free form
Zhao, S., McGuffin, M.J., Chignell, M.H.: Elastic hierarchies: Combining treemaps and node-link diagrams. In: INFOVIS. pp. 57–64. IEEE Computer Society (2005). https://doi.org/10.1109/INFVIS.2005.1532129 Appendix A Additional Material for Section 3.2 Algorithm for the NodeMergin...
2005
Reviewed August 14, 2026 · model on record in the stance chip above.
Discussion (0). Continue with ORCID to comment.