REVIEW 2 major objections 6 minor 89 references
Chemical enrichment in LINERs from MaNGA. I. Tracing Oxygen and Nitrogen Nuclear Abundances in LINERs with Varied Ionizing Sources
T0 review · 2 major / 6 minor · reviewed 2026-08-12 · deepseek-v4-flash
Pith's one-line read The nitrogen-to-oxygen ratio of LINER nuclear gas is nearly independent of the assumed ionizing source and is suprasolar, while oxygen abundances shift with that assumption.
desk verdict A careful, useful paper on LINER abundances whose central N/O robustness claim is solid among photoionization models but is not yet tested against the shock mechanism. read the letter →
The pith
A machine-rendered reading of the paper's core claim, the machinery that carries it, and where it could break.
The reading
What carries the argument
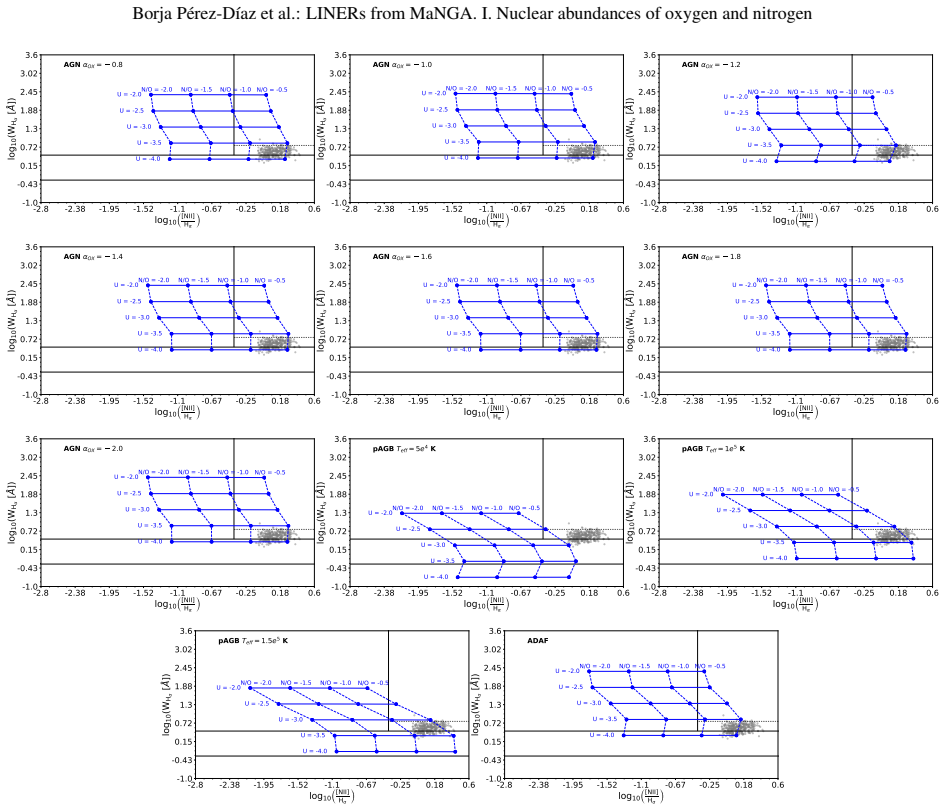
The load-bearing machinery is the Bayesian-like code HII-CHI-Mistry, which estimates $12+\log(\mathrm{O/H})$, $\log(\mathrm{N/O})$, and the ionization parameter $\log(U)$ by comparing observed line ratios $[\mathrm{O\,II}]/\mathrm{H}\beta$, $[\mathrm{Ne\,III}]/\mathrm{H}\beta$, $[\mathrm{O\,III}]/\mathrm{H}\beta$, $[\mathrm{N\,II}]/\mathrm{H}\beta$, and $[\mathrm{S\,II}]/\mathrm{H}\beta$ against precomputed grids of photoionization models. For each ionizing source the authors build 4,928 Cloudy models spanning $6.9<12+\log(\mathrm{O/H})<9.1$, $-2.0<\log(\mathrm{N/O})<0.0$, and $-4.0<\log(U)<-0.5$, at fixed density $500\,\mathrm{cm^{-3}}$, standard dust, and two stopping criteria. The grids differ only in the assumed spectral energy distribution: AGN power laws with $\alpha_{\mathrm{OX}}$ from $-0.8$ to $-2.0$, post-AGB atmospheres at $T_{\mathrm{eff}}=5\times10^4$, $1\times10^5$, and $1.5\times10^5$ K, and an ADAF average SED. Because N/O is largely set by the $[\mathrm{N\,II}]/[\mathrm{O\,II}]$ ratio while O/H is tied to the harder ionization stages, the N/O output survives the grid choice and the O/H output does not.
What would settle it
Measure auroral lines such as $[\mathrm{O\,III}]\,\lambda4363$ or $[\mathrm{N\,II}]\,\lambda5755$ in a sample of LINER nuclei; a direct-method $\log(\mathrm{N/O})$ that comes out solar or subsolar would contradict the suprasolar model-based values, while agreement would confirm them. Alternatively, split the sample by X-ray detection: if X-ray-bright and X-ray-quiet LINERs give the same $\log(\mathrm{N/O})$, the ratio is genuinely source-independent, and if they differ, the apparent invariance is a grid artifact.
Extended reading notes
Core claim
The central discovery is that the nitrogen-to-oxygen abundance ratio in LINER nuclear gas is insensitive to the assumed ionizing source and is suprasolar, whereas the oxygen abundance is not. Across AGN grids with seven spectral slopes, post-AGB grids at three effective temperatures, and an ADAF grid, the median $\log(\mathrm{N/O})$ stays in the range roughly $-0.79$ to $-0.69$, while median $12+\log(\mathrm{O/H})$ moves from about $8.69$ under AGN models to $8.53$ under pAGB models. The paper further reports that under pAGB ionization the N/O versus O/H relation becomes a strong anticorrelation, with Pearson coefficients around $-0.62$ to $-0.71$, which would require inflows or outflows to explain, while the AGN assumption keeps LINERs inside the scatter of the standard enrichment relation. A pAGB-only scenario also requires about $3.2\times10^4$ ionizing post-AGB stars within 1 kpc, a number the authors argue is hard to reconcile with observed globular cluster counts. The authors conclude that AGN activity is the chemically conservative interpretation, with old stellar populations possibly contributing but not uniquely powering the emission.
Load-bearing premise
The load-bearing premise is that each family of photoionization models maps the observed five line ratios to one unique set of gas-phase abundances, with fixed density, standard dust, no shocks, and a single ionizing SED per grid; if the real gas is multiphase or shock-excited, the medians shift.
Editorial extensions
If this is right
- If the paper is right, $\log(\mathrm{N/O})$ can be used as an ionizing-source-independent chemical enrichment indicator for LINERs, removing one major systematic from studies of the most common local active galaxies.
- Oxygen abundances of LINER nuclei should be reported with the assumed ionizing source made explicit, since the same line ratios yield solar medians under AGN SEDs and subsolar medians under pAGB SEDs.
- Under the AGN interpretation, LINER nuclei follow the standard N/O versus O/H enrichment relation, so no exotic inflow or outflow is required to explain their chemistry.
- Under the pAGB interpretation, a strong N/O versus O/H anticorrelation appears, implying gas flows that scale with chemical abundance or some other non-standard enrichment channel.
- The nuclear $\log(\mathrm{N/O})$ estimates agree with values extrapolated from each galaxy's radial gradient, while nuclear $12+\log(\mathrm{O/H})$ does not, reinforcing N/O as the more trustworthy nuclear tracer.
Reading between the lines
- An implication the authors leave implicit is that the gradient comparison is testable: if nuclear N/O matches the radial extrapolation while O/H does not, the central gas may have been nitrogen-enriched without corresponding oxygen enrichment, for example by secondary nitrogen production in intermediate-mass stars or by selective removal of oxygen-rich gas.
- The N/O invariance across SED families could be used to calibrate cheap empirical nitrogen-based metallicity indicators for LINERs, since existing N-based calibrations inherit the O/H ambiguity this paper documents.
- Adding shock-dominated photoionization models to the same Bayesian machinery would test whether the pAGB anticorrelation is an artifact of the shock contribution that all grids explicitly omit.
- A natural next observational check is to compare X-ray-detected and X-ray-quiet LINERs: if their derived $\log(\mathrm{N/O})$ values agree, the source-independence is genuine, and if not, the apparent invariance is a grid artifact.
Editorial analysis
A structured set of objections, weighed in public.
Referee Report
Summary. The manuscript presents a systematic analysis of nuclear oxygen and nitrogen abundances in 105 LINERs from the MaNGA survey. The authors construct photoionization model grids for three ionizing-source scenarios (AGN with varying α_OX, pAGB stars with three effective temperatures, and ADAF) and use the HII-CHI-Mistry code to derive 12+log(O/H), log(N/O), and log(U) from optical line ratios. They find that oxygen abundances depend on the assumed source (median 12+log(O/H) = 8.69 for AGN, 8.53 for pAGB), whereas the derived log(N/O) is nearly independent of the assumed source, with median values around -0.69 to -0.79, i.e., suprasolar. They further examine the N/O-O/H relation, the mass-metallicity and mass-N/O relations, and compare nuclear estimates with extrapolations from HII-region gradients. The paper concludes that the pAGB scenario requires a complex inflow/outflow picture, whereas the AGN scenario is consistent with standard enrichment, and it acknowledges that shocks are not modeled.
Significance. If the central result holds, the paper makes a valuable contribution: it provides the first large-sample, spatially resolved abundance analysis of LINER nuclei across multiple ionizing-source scenarios, and it identifies log(N/O) as a comparatively robust diagnostic. The analysis is reproducible in design: it uses the public HII-CHI-Mistry code, clearly specifies the Cloudy grids, and provides full tables at CDS. The internal consistency check against HII-region gradients (Fig. 9) is a useful falsifiable cross-check. The claim that N/O is largely independent of the assumed SED family is well supported among the pure-photoionization grids (Fig. A.2). However, the absolute N/O scale and the inference of suprasolar values rest on the assumption that fast radiative shocks, a canonical LINER mechanism, do not contribute significantly; this assumption is stated but not tested.
major comments (2)
- [Sec. 5.3, Sec. 3.2] The omission of fast radiative shocks is load-bearing for the central claim. The Introduction identifies shocks (Dopita & Sutherland 1995; Allen et al. 2008) as one of the three canonical LINER ionization mechanisms, but all grids in Sec. 3.2 are pure Cloudy photoionization models, and Sec. 5.3 states that shocks were omitted "due to the large number of free parameters required." In fast shocks, the hot post-shock gas and the photoionized precursor produce [N ii]/Hβ and [O i]/Hα ratios that mimic photoionization with little sensitivity to the gas-phase N/O; a pure-photoionization fit may therefore absorb the excess [N ii] into an overestimated log(N/O). The comparison in Fig. 9 with HII-region gradients does not resolve this concern, because the HII-region abundances are derived from the same pure-photoionization methodology. I request a quantitative test: for a representative subset, fit grids that include shock+precursor components (e.g., MAPPINGS) or use literature shock models to estimate the potential bias on the median log(N/O). Without such a test, the statement "the nitrogen-to-oxygen ratio we derived is much less affected by the assumptions on the ionizing source" (Abstract) is established only within the restricted space of pure-photoionization SEDs, not across the full range of proposed LINER mechanisms.
- [Sec. 3.2] The description of the ionization parameter range is internally inconsistent, and the imposed prior may affect the results. The text states that log(U) "varied in the range -4.0 < log(U) < -0.5 in steps of 0.25 dex," but then says the parameter was "preliminarily constrained in the range -4.0 < log(U) < -2.5 based on previous findings." If the grid actually covers only -4.0 to -2.5, the sentence should be corrected; if the full -4.0 to -0.5 grid is computed but subsequent inference is restricted to -2.5, the paper should justify that the truncation does not bias the derived log(N/O), since log(U) and log(N/O) can be degenerate in the fitted line ratios. Please clarify which range was used and report the sensitivity of the median abundances to this choice.
minor comments (6)
- [Table 1, Sec. 2.2] The text says the preliminary sample contains 429 galaxies, but the "Total" row of Table 1 sums to 428 (329 + 48 + 51). Please reconcile this discrepancy.
- [Fig. 5 caption] The caption says "The solid back line represents the fit"; this should be "solid black line."
- [Sec. 5.3, after Eq. (2)] The phrase "all these stars ionize the gas nowadays today" is awkward; suggest "these stars ionize the gas at the present day."
- [Data availability] The line "Tables B1–B5B.5 are available" contains a typo; it should read "Tables B.1–B.5."
- [Sec. 3.2] The total number of models is given as 54,208, which equals 4,928 × 11; it would be helpful to state explicitly that this corresponds to 7 AGN SEDs + 3 pAGB temperatures + 1 ADAF.
- [Sec. 4.1 and Sec. 5] The exclusion of pAGB models with Teff = 5×10^4 K from the discussion (Sec. 5) should be stated earlier, since Table 3 shows these models yield the highest median log(N/O) (-0.58), which would otherwise appear to contradict the robustness claim.
Circularity Check
No circular derivation: N/O and O/H are standard grid-fit estimates, and the N/O invariance claim is an inter-grid comparison, not an input assumption.
full rationale
The paper derives chemical abundances by fitting observed optical line ratios against Cloudy photoionization grids within the HCm Bayesian code; 12+log(O/H), log(N/O), and log(U) are free grid parameters, and the text explicitly states that no relation was assumed between them (Sec. 3.1). The central claim that log(N/O) is nearly independent of the assumed ionizing source is not built into the inputs: it emerges from comparing 4928-model grids per SED family (AGN, pAGB, ADAF) and is displayed as one-to-one correlations in Fig. A.2. The result is an abundance estimate, not a prediction forced by construction: no equation in the paper reduces a predicted quantity to a fitted input. The self-citations that exist (HCm, the log(U) prior range, and previous AGN-grid conventions) are methodological tool citations and grid prior choices, not load-bearing inferences that pre-encode the result. The N/O versus O/H trends are checked against external literature relations and against the galaxies' own HII-region gradient extrapolations. The explicit omission of fast radiative shocks (Sec. 5.3) is a genuine completeness limitation that could bias the absolute N/O scale by absorbing shock-enhanced [N ii] into a higher fitted log(N/O); however, that is a model-family assumption and a correctness risk, not a circular step in the derivation chain.
Assumptions & free parameters
free parameters (5)
- log(U) prior range =
-4.0 to -2.5
- Gas density n_e =
500 cm^-3 (nuclear), 100 cm^-3 (HII regions)
- Dust-to-gas ratio =
standard (unspecified)
- pAGB ionizing photon rate per star =
5 x 10^46 s^-1
- pAGB progenitor mass range and IMF =
1.5-8 Msun, Salpeter IMF, M_min=0.5 Msun, M_max=20 Msun
assumptions (5)
- domain assumption The observed optical line ratios are produced by a single-zone, ionization-bounded, constant-density photoionized gas in equilibrium.
- domain assumption The three SED families (AGN power law + big blue bump, pAGB NLTE atmospheres, ADAF average SED) bracket the true ionizing spectral energy distribution of LINERs.
- domain assumption The reddening correction is valid under case B recombination with Halpha/Hbeta=3.1, n_e~500 cm^-3, T_e~10^4 K, and a Howarth (1983) extinction curve with R_V=3.1.
- domain assumption Classical stellar population synthesis and IMF assumptions (Salpeter, 0.5-20 Msun) plus globular cluster specific frequency provide a valid upper limit for pAGB counts.
- domain assumption Chemical evolution reference relations (Andrews & Martini 2013, Belfiore et al. 2015, Curti et al. 2020) are representative of normal galaxies.
Cite this review
Pith. "Pith review of Chemical enrichment in LINERs from MaNGA. I. Tracing Oxygen and Nitrogen Nuclear Abundances in LINERs with Varied Ionizing Sources." pith.science (2026). https://pith.science/paper/2P5Y5CJA
@misc{pith2026241116611,
  author       = {Pith},
  title        = {Pith review of: Chemical enrichment in LINERs from MaNGA. I. Tracing Oxygen and Nitrogen Nuclear Abundances in LINERs with Varied Ionizing Sources},
  year         = {2026},
  howpublished = {\url{https://pith.science/paper/2P5Y5CJA}},
  note         = {Machine review of arXiv:2411.16611}
}
read the original abstract
The chemical enrichment in low-ionization nuclear emission-line regions (LINERs) is still an issue with spatial resolution spectroscopic data due to the lack of studies and the uncertainties in the nature of their ionizing source, despite being the most abundant type of active galaxies in the nearby Universe. Considering different scenarios for the ionizing source (hot old stellar populations, active galactic nuclei (AGN) or inefficient accretion disks), we analyze the implications of these assumptions to constrain the chemical content of the gas-phase interstellar medium (ISM). We used a sample of 105 galaxies from Mapping Nearby Galaxies at Apache Point Observatory (MaNGA) survey, whose nuclear central spaxels show LINER-like emission. For each scenario considered, we built a grid of photoionization models (4928 models for each considered ionizing source) which are later used in the open-source code HII-CHI-Mistry, allowing us to estimate chemical abundance ratios such as 12+log(O/H) or log(N/O) and constrain the ionization parameter that characterize the ionized ISM in those galaxies. We obtain that oxygen abundances in the nuclear region of LINER-like galaxies spread over a wide range 8.08 < 12+log(O/H) < 8.89, with a median solar value (in agreement with previous studies) if AGN models are considered. Nevertheless, the derived nitrogen-to-oxygen ratio is much less affected by the assumptions on the ionizing source, and point towards suprasolar values (log(N/O) = -0.69). By comparing the different analyzed scenarios, we show that if hot old stellar populations were responsible of the ionization of the ISM a complex picture (such as outflows and/or inflows scaling with galaxy chemical abundance) would be needed to explain the chemical enrichment history, whereas the assumption of AGN activity is compatible with the standard scenario found in most galaxies.
Figures


Figures from the paper (8 more)


Reference graph
Works this paper leans on
-
[1]
2022, ApJS, 259, 35
Abdurro’uf, Accetta, K., Aerts, C., et al. 2022, ApJS, 259, 35
2022
-
[2]
G., Groves, B
Allen, M. G., Groves, B. A., Dopita, M. A., Sutherland, R. S., & Kewley, L. J. 2008, ApJS, 178, 20 Amorín, R., Pérez-Montero, E., Vílchez, J. M., & Papaderos, P. 2012, ApJ, 749, 185 Amorín, R. O., Pérez-Montero, E., & Vílchez, J. M. 2010, ApJ, 715, L128
2008
-
[3]
Andrews, B. H. & Martini, P. 2013, ApJ, 765, 140
2013
-
[4]
2010, A&A, 519, A40
Annibali, F., Bressan, A., Rampazzo, R., et al. 2010, A&A, 519, A40
2010
-
[5]
V ., Cid Fernandes, R., Stasi´nska, G., et al
Asari, N. V ., Cid Fernandes, R., Stasi´nska, G., et al. 2007, MNRAS, 381, 263
2007
-
[6]
J., & Scott, P
Asplund, M., Grevesse, N., Sauval, A. J., & Scott, P. 2009, ARA&A, 47, 481 Astropy Collaboration, Price-Whelan, A. M., Lim, P. L., et al. 2022, ApJ, 935, 167 Article number, page 18 of 24 Borja Pérez-Díaz et al.: LINERs from MaNGA. I. Nuclear abundances of oxygen and nitrogen Astropy Collaboration, Price-Whelan, A. M., Sip˝ocz, B. M., et al. 2018, AJ, 156...
2009
-
[7]
A., Phillips, M
Baldwin, J. A., Phillips, M. M., & Terlevich, R. 1981, PASP, 93, 5
1981
-
[8]
2015, MNRAS, 449, 867
Belfiore, F., Maiolino, R., Bundy, K., et al. 2015, MNRAS, 449, 867
2015
Show all 89 references
-
[9]
Bica, E., Ortolani, S., Barbuy, B., & Oliveira, R. A. P. 2024, A&A, 687, A201
2024
-
[10]
G., Stasi´nska, G., & Bruzual, A
Binette, L., Magris, C. G., Stasi´nska, G., & Bruzual, A. G. 1994, A&A, 292, 13
1994
-
[11]
R., Bershady, M
Blanton, M. R., Bershady, M. A., Abolfathi, B., et al. 2017, AJ, 154, 28
2017
-
[12]
& Charlot, S
Bruzual, G. & Charlot, S. 2003, MNRAS, 344, 1000
2003
-
[13]
A., Law, D
Bundy, K., Bershady, M. A., Law, D. R., et al. 2015, ApJ, 798, 7
2015
-
[14]
R., Feruglio, C., Hickox, R
Capelo, P. R., Feruglio, C., Hickox, R. C., & Tombesi, F. 2023, in Handbook of X-ray and Gamma-ray Astrophysics, 126
2023
-
[15]
P., Dors, O
Carvalho, S. P., Dors, O. L., Cardaci, M. V ., et al. 2020, MNRAS, 492, 5675
2020
-
[16]
2003, ApJ, 586, L133 Cid Fernandes, R., Mateus, A., Sodré, L., Stasi ´nska, G., & Gomes, J
Chabrier, G. 2003, ApJ, 586, L133 Cid Fernandes, R., Mateus, A., Sodré, L., Stasi ´nska, G., & Gomes, J. M. 2005, MNRAS, 358, 363 Cid Fernandes, R., Stasi ´nska, G., Mateus, A., & Vale Asari, N. 2011, MNRAS, 413, 1687 Cid Fernandes, R., Stasi´nska, G., Schlickmann, M. S., et a...
2003
-
[17]
& Aldrovandi, S
Contini, M. & Aldrovandi, S. M. V . 1983, A&A, 127, 15
1983
-
[18]
Coziol, R., Reyes, R. E. C., Considère, S., Davoust, E., & Contini, T. 1999, A&A, 345, 733
1999
-
[19]
2020, MNRAS, 491, 944
Curti, M., Mannucci, F., Cresci, G., & Maiolino, R. 2020, MNRAS, 491, 944
2020
-
[20]
H., Fields, B
Cyburt, R. H., Fields, B. D., Olive, K. A., & Yeh, T.-H. 2016, Reviews of Modern Physics, 88, 015004
2016
-
[21]
L., Groves, B., Kewley, L
Davies, R. L., Groves, B., Kewley, L. J., et al. 2016, MNRAS, 462, 1616 de Nicola, S., Marconi, A., & Longo, G. 2019, MNRAS, 490, 600
2016
-
[22]
Dopita, M. A. & Sutherland, R. S. 1995, ApJ, 455, 468
1995
-
[23]
L., Cardaci, M
Dors, O. L., Cardaci, M. V ., Hägele, G. F., et al. 2015, MNRAS, 453, 4102
2015
-
[24]
L., Valerdi, M., Riffel, R
Dors, O. L., Valerdi, M., Riffel, R. A., et al. 2023, MNRAS, 521, 1969 Duarte Puertas, S., Vilchez, J. M., Iglesias-Páramo, J., et al. 2022, A&A, 666, A186
2023
-
[25]
Eckert, D., Gaspari, M., Gastaldello, F., Le Brun, A. M. C., & O’Sullivan, E. 2021, Universe, 7, 142
2021
-
[26]
Edmunds, M. G. 1990, MNRAS, 246, 678
1990
-
[27]
J., Chatzikos, M., Guzmán, F., et al
Ferland, G. J., Chatzikos, M., Guzmán, F., et al. 2017, Rev. Mexicana Astron. Astrofis., 53, 385 Fernández-Ontiveros, J. A., Pérez-Montero, E., Vílchez, J. M., Amorín, R., &
2017
-
[28]
2021, A&A, 652, A23
Spinoglio, L. 2021, A&A, 652, A23
2021
-
[29]
Gaskell, C. M. 2009, New A Rev., 53, 140
2009
-
[30]
Gitti, M., Brighenti, F., & McNamara, B. R. 2012, Advances in Astronomy, 2012, 950641
2012
-
[31]
2021, MNRAS, 508, 719
Grisoni, V ., Matteucci, F., & Romano, D. 2021, MNRAS, 508, 719
2021
-
[32]
Henry, R. B. C., Edmunds, M. G., & Köppen, J. 2000, ApJ, 541, 660
2000
-
[33]
C., Filippenko, A
Ho, L. C., Filippenko, A. V ., & Sargent, W. L. W. 1997, ApJS, 112, 315
1997
-
[34]
C., Shields, J
Ho, L. C., Shields, J. C., & Filippenko, A. V . 1993, ApJ, 410, 567
1993
-
[35]
Howarth, I. D. 1983, Monthly Notices of the Royal Astronomical Society, 203, 301
1983
-
[36]
Hunter, J. D. 2007, Computing in Science and Engineering, 9, 90 Ili´c, D., Shapovalova, A. I., Popovi ´c, L. ˇC., et al. 2017, Frontiers in Astronomy and Space Sciences, 4, 12
2007
-
[37]
M., Tremonti, C., et al
Kauffmann, G., Heckman, T. M., Tremonti, C., et al. 2003, MNRAS, 346, 1055
2003
-
[38]
J., Groves, B., Kauffmann, G., & Heckman, T
Kewley, L. J., Groves, B., Kauffmann, G., & Heckman, T. 2006, MNRAS, 372, 961
2006
-
[39]
I., & Lugaro, M
Kobayashi, C., Karakas, A. I., & Lugaro, M. 2020, ApJ, 900, 179
2020
-
[40]
A., Kennicutt, Robert C., J., & Pizagno, J
Kobulnicky, H. A., Kennicutt, Robert C., J., & Pizagno, J. L. 1999, ApJ, 514, 544
1999
-
[41]
Kobulnicky, H. A. & Skillman, E. D. 1996, ApJ, 471, 211
1996
-
[42]
A., Skillman, E
Kobulnicky, H. A., Skillman, E. D., Roy, J.-R., Walsh, J. R., & Rosa, M. R. 1997, ApJ, 477, 679 Köppen, J. & Edmunds, M. G. 1999, MNRAS, 306, 317 Köppen, J. & Hensler, G. 2005, A&A, 434, 531
1997
-
[43]
C., Oliveira, C
Krabbe, A. C., Oliveira, C. B., Zinchenko, I. A., et al. 2021, MNRAS, 505, 2087
2021
-
[44]
L., Irwin, M
Kumari, N., James, B. L., Irwin, M. J., Amorín, R., & Pérez-Montero, E. 2018, MNRAS, 476, 3793
2018
-
[45]
R., Cherinka, B., Yan, R., et al
Law, D. R., Cherinka, B., Yan, R., et al. 2016, AJ, 152, 83
2016
-
[46]
F., Serrano, A., & Torres-Peimbert, S
Lequeux, J., Peimbert, M., Rayo, J. F., Serrano, A., & Torres-Peimbert, S. 1979, A&A, 500, 145 López-Sánchez, Á. R. & Esteban, C. 2010, A&A, 517, A85
1979
-
[47]
& Mannucci, F
Maiolino, R. & Mannucci, F. 2019, A&A Rev., 27, 3
2019
-
[48]
K., Rakshit, S., Stalin, C
Mandal, A. K., Rakshit, S., Stalin, C. S., et al. 2021, MNRAS, 502, 2140
2021
-
[49]
2024, A&A, 689, A78 Márquez, I., Masegosa, J., González-Martin, O., et al
Marconi, A., Amiri, A., Feltre, A., et al. 2024, A&A, 689, A78 Márquez, I., Masegosa, J., González-Martin, O., et al. 2017, Frontiers in Astron- omy and Space Sciences, 4, 34
2024
-
[50]
2006, MNRAS, 370, 721
Mateus, A., Sodré, L., Cid Fernandes, R., et al. 2006, MNRAS, 370, 721
2006
-
[51]
McClure, R. D. & van den Bergh, S. 1968, AJ, 73, 1008 Méndez-Delgado, J. E., Esteban, C., García-Rojas, J., Kreckel, K., & Peimbert, M. 2023, Nature, 618, 249 Mollá, M., García-Vargas, M. L., & Bressan, A. 2009, MNRAS, 398, 451 Mollá, M., Vílchez, J. M., Gavilán, M., & Díaz, A...
1968
-
[52]
D., Combes, F., & Semelin, B
Montuori, M., Di Matteo, P., Lehnert, M. D., Combes, F., & Semelin, B. 2010, A&A, 518, A56
2010
-
[53]
2017, Frontiers in Astronomy and Space Sciences, 4, 42
Morganti, R. 2017, Frontiers in Astronomy and Space Sciences, 4, 42
2017
-
[54]
S., Storchi-Bergmann, T., & Eracleous, M
Nemmen, R. S., Storchi-Bergmann, T., & Eracleous, M. 2014, MNRAS, 438, 2804
2014
-
[55]
Nobels, F. S. J., Schaye, J., Schaller, M., Bahé, Y . M., & Chaikin, E. 2022, MN- RAS, 515, 4838
2022
-
[56]
B., Dors, O
Oliveira, C. B., Dors, O. L., Zinchenko, I. A., et al. 2024a, arXiv e-prints, arXiv:2411.02043
-
[57]
B., Krabbe, A
Oliveira, C. B., Krabbe, A. C., Hernandez-Jimenez, J. A., et al. 2022, MNRAS, 515, 6093
2022
-
[58]
Osterbrock, D. E. & Ferland, G. J. 2006, Astrophysics of gaseous nebulae and active galactic nuclei
2006
-
[59]
J., Stevens, J
Page, M. J., Stevens, J. A., Ivison, R. J., & Carrera, F. J. 2004, ApJ, 611, L85
2004
-
[60]
1967, ApJ, 150, 825
Peimbert, M. 1967, ApJ, 150, 825
1967
-
[61]
& Costero, R
Peimbert, M. & Costero, R. 1969, Boletin de los Observatorios Tonantzintla y Tacubaya, 5, 3
1969
-
[62]
2007, ApJ, 666, 636 Pérez-Díaz, B., Masegosa, J., Márquez, I., & Pérez-Montero, E
Peimbert, M., Luridiana, V ., & Peimbert, A. 2007, ApJ, 666, 636 Pérez-Díaz, B., Masegosa, J., Márquez, I., & Pérez-Montero, E. 2021, MNRAS, 505, 4289 Pérez-Díaz, B., Pérez-Montero, E., Fernández-Ontiveros, J. A., & Vílchez, J. M. 2022, A&A, 666, A115 Pérez-Díaz, B., Pérez-Mon...
2007
-
[63]
Peterson, B. M. 2006, in Physics of Active Galactic Nuclei at all Scales, ed. D. Alloin, V ol. 693, 77
2006
-
[64]
M., Denney, K
Peterson, B. M., Denney, K. D., De Rosa, G., et al. 2013, ApJ, 779, 109
2013
-
[65]
S., Vílchez, J
Pilyugin, L. S., Vílchez, J. M., & Contini, T. 2004, A&A, 425, 849 Povi´c, M., Márquez, I., Netzer, H., et al. 2016, MNRAS, 462, 2878
2004
-
[66]
& Buzzoni, A
Renzini, A. & Buzzoni, A. 1986, in Astrophysics and Space Science Library, V ol. 122, Spectral Evolution of Galaxies, ed. C. Chiosi & A. Renzini, 195–231
1986
-
[67]
Rupke, D. S. N., Kewley, L. J., & Barnes, J. E. 2010, ApJ, 710, L156
2010
-
[68]
Salpeter, E. E. 1955, ApJ, 121, 161 Sánchez Almeida, J., Elmegreen, B. G., Muñoz-Tuñón, C., et al. 2015, ApJ, 810, L15 Sánchez-Menguiano, L., Sánchez Almeida, J., Sánchez, S. F., & Muñoz-Tuñón, C. 2024, A&A, 681, A121
1955
-
[69]
1971, ApJ, 168, 327
Searle, L. 1971, ApJ, 168, 327
1971
-
[70]
& Sargent, W
Searle, L. & Sargent, W. L. W. 1972, ApJ, 173, 25
1972
-
[71]
R., et al
Sharda, P., Ginzburg, O., Krumholz, M. R., et al. 2024, MNRAS, 528, 2232
2024
-
[72]
2022, MNRAS, 509, 2720 Stasi´nska, G., Vale Asari, N., Cid Fernandes, R., et al
Sparre, M., Whittingham, J., Damle, M., et al. 2022, MNRAS, 509, 2720 Stasi´nska, G., Vale Asari, N., Cid Fernandes, R., et al. 2008, MNRAS, 391, L29
2022
-
[73]
R., Calzetti, D., & Kinney, A
Storchi-Bergmann, T., Schmitt, H. R., Calzetti, D., & Kinney, A. L. 1998, AJ, 115, 909
1998
-
[74]
Sutherland, R. S. & Dopita, M. A. 2017, ApJS, 229, 34
2017
-
[75]
D., Dopita, M
Thomas, A. D., Dopita, M. A., Kewley, L. J., et al. 2018, ApJ, 856, 89
2018
-
[76]
X., Izotov, Y
Thuan, T. X., Izotov, Y . I., & Lipovetsky, V . A. 1995, ApJ, 445, 108
1995
-
[77]
A., Heckman, T
Tremonti, C. A., Heckman, T. M., Kauffmann, G., et al. 2004, ApJ, 613, 898
2004
-
[78]
& Anupama, G
Valluri, M. & Anupama, G. C. 1996, AJ, 112, 1390 van der Walt, S., Colbert, S. C., & Varoquaux, G. 2011, Computing in Science and Engineering, 13, 22
1996
-
[79]
& Osterbrock, D
Veilleux, S. & Osterbrock, D. E. 1987, ApJS, 63, 295 Article number, page 19 of 24 A&A proofs: manuscript no. aa52862-24corr
1987
-
[80]
Ventura, P., Stanghellini, L., Dell’Agli, F., & García-Hernández, D. A. 2017, MNRAS, 471, 4648
2017
-
[81]
Vila-Costas, M. B. & Edmunds, M. G. 1993, MNRAS, 265, 199
1993
-
[82]
M., Pagel, B
Vilchez, J. M., Pagel, B. E. J., Diaz, A. I., Terlevich, E., & Edmunds, M. G. 1988, MNRAS, 235, 633 Villar Martín, M., López Cobá, C., Cazzoli, S., Pérez Montero, E., & Cabrera
1988
-
[83]
2024, A&A, 690, A397
Lavers, A. 2024, A&A, 690, A397
2024
-
[84]
2016, MN- RAS, 458, 3466
Vincenzo, F., Belfiore, F., Maiolino, R., Matteucci, F., & Ventura, P. 2016, MN- RAS, 458, 3466
2016
-
[85]
E., et al
Virtanen, P., Gommers, R., Oliphant, T. E., et al. 2020, Nature Methods, 17, 261
2020
-
[86]
2005, ApJ, 620, 905
Yuan, F., Cui, W., & Narayan, R. 2005, ApJ, 620, 905
2005
-
[87]
A., Xue, Y ., & Wu, X.-B
Yuan, F., Zdziarski, A. A., Xue, Y ., & Wu, X.-B. 2007, ApJ, 659, 541
2007
-
[88]
A., Pilyugin, L
Zinchenko, I. A., Pilyugin, L. S., Grebel, E. K., Sánchez, S. F., & Vílchez, J. M. 2016, MNRAS, 462, 2715
2016
-
[89]
[PLATE]-[IFUDESIGN]
Zinchenko, I. A., Vílchez, J. M., Pérez-Montero, E., et al. 2021, A&A, 655, A58 Article number, page 20 of 24 Borja Pérez-Díaz et al.: LINERs from MaNGA. I. Nuclear abundances of oxygen and nitrogen Appendix A: Comparison of estimations of chemical abundances We present in thi...
1983
Reviewed August 12, 2026 · model on record in the stance chip above.
Discussion (0). Continue with ORCID to comment.