REVIEW 3 major objections 4 minor 3 cited by
Multi-scale reconstruction of large supply networks
T0 review · 3 major / 4 minor · reviewed 2026-08-11 · deepseek-v4-flash
Pith's one-line read A single scale-invariant link formula reconstructs firm-to-firm supply networks from industry-level data.
desk verdict Sound multi-scale reconstruction paper with honest empirics, but the abstract oversells 'reliably predicts' and the practical claim of reconstructing from aggregate data outruns the evidence. read the letter →
The pith
A machine-rendered reading of the paper's core claim, the machinery that carries it, and where it could break.
The reading
What carries the argument
The load-bearing object is the multi-scale invariant functional $p_{ij}=1-e^{-\theta_i^T B\theta_j}$, where $\theta_i$ stacks the firm's sector-level out- and in-strength vectors and $B$ selects the product-layer interaction; with $B$ chosen as a block matrix containing $\mathrm{diag}(\delta)$, this reduces to the stripe form. The argument is carried by the bilinearity of $\log(1-p_{ij})$, which guarantees that if node parameters add under coarse-graining, the probability of an aggregate link is the same whether computed directly or by aggregating micro-links. This identity lets the authors calibrate $\delta$ on a coarse graph of a few hundred nodes, predict a firm-level graph of roughly $3\times10^5$ nodes, incorporate rest-of-the-world information as a single aggregate node, and condition fine-grained sampling on an observed macro graph at cost $M+N+1$ instead of $MN$.
What would settle it
Use payment or VAT data with true product classification (CPA) for a subset of firms: if two firms with identical NACE-stripe strengths but different product mixes show systematically different connection patterns, the sector-proxy assumption fails. Alternatively, compute the product-layer aggregation relation from disaggregated product data; if the implied layer-aggregated parameter differs substantially from the global $\delta$ used across scales, product-level scale invariance does not hold.
Extended reading notes
Core claim
The central claim is that the scale-invariant link probability $p_{ij}=1-e^{-\sum_\alpha \delta_\alpha s^{\mathrm{out}}_{i,\alpha}s^{\mathrm{in}}_{j,\alpha}}$, with $s^{\mathrm{out}}_{i,\alpha}$ and $s^{\mathrm{in}}_{i,\alpha}$ the sector-level sales and purchases of firm $i$ and $\delta_\alpha$ a density parameter, is a sufficient and transferable description of directed production links. The model's defining property is that the logarithm of the non-link probability is bilinear in additive node vectors, so coarsening any partition of firms into sectors leaves the functional form intact. The paper shows this invariance is not only formal: fitting the density parameter on graphs aggregated by NACE digits and predicting the firm-level graph gives small density errors, the stripe version reproduces the observed neighbourhood structure better than density-only versions, and treating the unobserved part of the economy as one additional node corrects a roughly 2000% density overestimation that arises when outside trade is ignored.
Load-bearing premise
The argument collapses if a firm's buying and selling behaviour is not fully captured by its total purchases and sales split by the seller's NACE industry, since sector codes are used as a proxy for the products actually exchanged; it also assumes links form independently given those strengths.
Editorial extensions
If this is right
- Input-output tables at 2 to 5 digit NACE resolution are enough to calibrate the model, and the fitted parameter transfers to firm level with small density error across all tested years.
- Including a rest-of-the-world aggregate node when only a subgraph is observed removes a systematic density overestimation, so partially observed or multi-country networks can be reconstructed without discarding outside-trade information.
- The same functional form supports dyadic factors like geographic distance and conditional fine-grained sampling, extending the approach beyond the density-only version tested here.
- Because the ensemble is not optimized for link prediction, its usefulness is measured by reproducing network statistics and functional equivalence rather than by exact link identification.
- When sector information is available, the stripe-corrected version captures average nearest-neighbour degree and ranks observed links higher than density-only versions.
Reading between the lines
- The model's empirical success is entangled with the NACE-code proxy for products; testing with true product categories (CPA) would show how much of the stripe advantage comes from the model rather than from the classification.
- The aggregation consistency is formal, and the paper itself finds an outlier when fitting on randomly grouped intermediate levels, suggesting that real partitions with skewed sector mixes may need partition-aware calibration.
- The density-calibration choice means $\delta$ absorbs all network sparsity; applying maximum likelihood to node fitnesses as free parameters is a natural next benchmark that could make the method work when only aggregate totals, not firm sizes, are known.
- The conditional fine-graining result offers a scalable sampling algorithm: sample a sparse macro graph, then sample only within existing macro links, which could make full ensemble generation feasible for millions of firms.
Signed reviews
Editorial analysis
A structured set of objections, weighed in public.
Referee Report
Summary. The paper proposes a multi-scale network model for reconstructing firm-to-firm supply networks, building on the scale-invariant functional form of Garuccio et al. (2023). The model represents each firm by in- and out-strength vectors across NACE sectors, and the link probability is a bilinear exponential form in these vectors. The authors test the model on two Dutch bank payment datasets, comparing density-corrected and stripe-corrected variants against gravity-model baselines in three scenarios: single-scale reconstruction, incorporation of a rest-of-the-world node, and estimation from aggregate input-output data. They claim the model reliably predicts important topological properties at scale and is a suitable candidate for reconstruction. The theoretical derivation of the scale-invariant form is sound, and the empirical evaluation is honest about limitations, but the headline claim is only partially supported by the reported results.
Significance. If the practical claims held, the model would be a significant contribution to economic network reconstruction because its parameters are invariant to node aggregation, which is a useful property when data are available at mixed scales. The paper provides a clear derivation of the functional form, open-source code, and a transparent comparison with existing gravity models. The empirical analysis is careful, and the inclusion of the rest-of-the-world and aggregate-data experiments is valuable. However, the main advantage of the model in reconstructing mesoscopic structure depends on having the true firm-level sectoral strengths, which the paper itself concedes are not uniquely recoverable from aggregate data. The practical scope is therefore narrower than the abstract suggests, and the reported error magnitudes (50-60% density errors in the ROW scenario, KS distances of 0.2-0.6 for degree distributions) do not fully support the term 'reliably predicts'.
major comments (3)
- [Working with aggregate data, Appendix A8] The paper's central claim that the model is 'a suitable candidate for reconstructing firm-to-firm networks at scale' is not supported in the concrete scenario of reconstruction from aggregate data. In the aggregate-data scenario (main text, after Fig. 6), the stripe model (scIN) cannot be fitted when the observed network coincides with the stripe definitions, because the density-matching parameter diverges; Appendix A8 states that in this regime the estimated parameter carries no information about firm-level density. The main text therefore fits the density parameter with the dcIN model, which only constrains total link density. The topological properties that give the model its claimed advantage (degree distribution tails, average nearest-neighbour degree, ROC curves in Fig. 2) require the true stripe fitnesses, which are not available from an input-output table. The Discussion explicitly states that the additive nature of the parameters does not give a unique way to obtain firm-level fitnesses from aggregate ones and defers this to future work. The abstract should be qualified to state that the reconstruction advantages are demonstrated only when firm-level sectoral strengths are known.
- [Handling the rest of the world] The reported quantitative results do not support the unqualified claim of reliable prediction. In the ROW scenario, the absolute density error of the model is in the range 50-60% (main text, after Fig. 4), and in the aggregation scenario the KS distances between empirical and reconstructed degree distributions are 0.2-0.6 (Fig. 6b). The paper itself describes the ROW performance as 'somewhat disappointing'. These values are not necessarily disqualifying, but they are inconsistent with the abstract's 'reliably predicts important topological properties'. The abstract and conclusions should be revised to reflect the magnitude of the errors and the conditions under which the model is reliable.
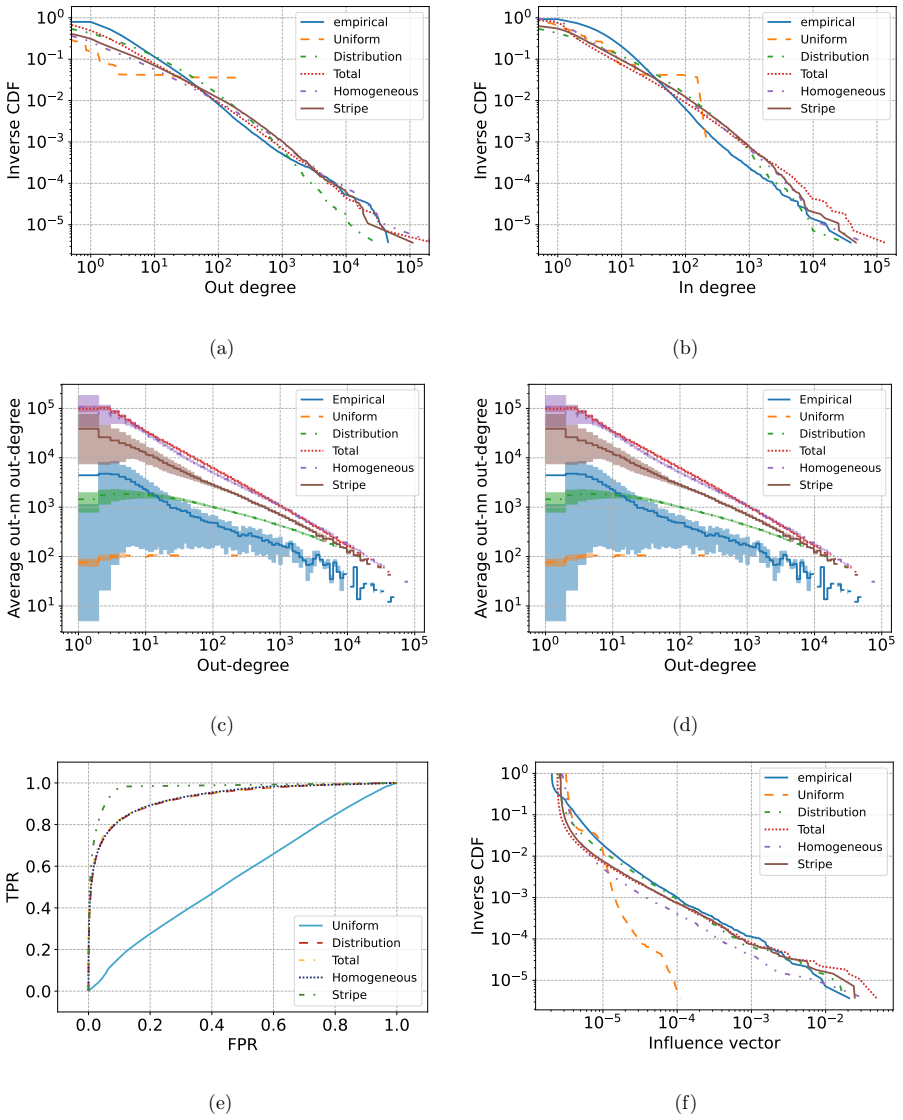
- [Appendix A5, Firm level information effects] The evaluation of the model's added value over the density-corrected baseline is circular in a practical sense: the stripe model outperforms the density model only because the true firm-level in- and out-strengths by NACE sector are supplied as inputs. When this information is degraded, as in the Uniform, Distribution, Total, and Homogeneous cases shown in Fig. 8, the model loses its advantage in ROC curves and average nearest-neighbour degree. Since the paper's stated goal is reconstruction from aggregate data, and the paper itself shows that firm-level fitnesses cannot be uniquely recovered from aggregate ones, the comparison with true stripe fitnesses does not establish the model's utility in the reconstruction setting. The paper should either compare against baselines using only information available in the intended application, or explicitly discuss what additional information beyond aggregate tables is needed for the model to deliver its claimed advantages.
minor comments (4)
- [Fig. 2 caption] The phrase 'our in and out degree sequences' appears to contain a typo; it should likely read 'the in and out degree sequences' or 'the observed in and out degree sequences'.
- [Main text after Eq. (5)] The term 'stripe' is used frequently but is not defined in the main text before the first use; a brief definition (firm-level in- and out-strengths disaggregated by product/sector layer) would improve readability.
- [Appendix A8, Eq. (A40)] Equation (A40) defines δ_k as a ratio that appears to depend on the specific pair (il, jl), yet the text refers to a global δ_k; the notation should clarify whether the relation is required to hold for all pairs and how a single δ_k is chosen in that case.
- [Working with aggregate data, after Fig. 6d] The sentence 'This is probably the reason why as the network becomes more dense, our estimation of δ becomes more unreliable as seen in figure 6a' is speculative; it would be clearer to state the connection to the well-posedness issue discussed in Appendix A8 and to refer explicitly to that appendix.
Circularity Check
No significant circularity: the model is re-derived from invariance assumptions, delta is fit only to density, cross-scale predictions are out-of-sample, and the true-stripes requirement is an acknowledged limitation rather than a circular input.
full rationale
The paper's derivation chain is not circular. The invariant functional form (Eq. 2) is derived from two stated assumptions, edge independence and additivity of embedding vectors under coarse-graining, in Appendix A2 (Eqs. A1-A9), so the appeal to [34] is not load-bearing. The only fitted parameter delta is calibrated to the observed link density (Section 'RESUL TS': 'we will calibrate the parameter delta to ensure that the expected link density of the ensemble is equal to the observed one'), and the reported predictions (degree distributions, average nearest-neighbour degrees, ROC/precision-recall, density across aggregation levels) are not the fitted quantity. Cross-scale predictions in 'Working with aggregate data' are genuinely out-of-sample: delta is estimated at one aggregation level and used to predict properties at other levels. The paper explicitly acknowledges the practical limitation that firm-level stripe fitnesses are not uniquely recoverable from aggregate input-output tables (Discussion: 'the additive nature of the parameters does not give us a unique way to obtain the firm-level fitnesses from the estimated aggregate ones. How to solve this in practice is the subject for future work'), and the supplementary 'Firm level information effects' honestly reports that true stripes outperform homogeneous or distributional proxies. This is a limitation on the 'reconstruction at scale' applicability, not a case of a fitted parameter renamed as a prediction or an equation reducing to its own input by construction. The self-citations to [30] and [34] overlap with the authors, but the model derivation is reproduced and the empirical benchmarks (dcGM/scGM) are used as external baselines, so the citations are not circularity. Overall, no significant circularity; score 2 only to note the minor self-citation overlap.
Assumptions & free parameters
free parameters (2)
- delta (global density parameter) =
Not reported; calibrated to match observed link density at the chosen scale
- Lognormal distribution parameters (mean and standard deviation) =
Not reported; fitted to firm sizes in Figure 9
assumptions (4)
- domain assumption Edges are conditionally independent given the fitnesses.
- ad hoc to paper Node parameters are additive under coarse-graining: theta_{l+1} = sum over child nodes of theta_i.
- domain assumption The NACE code of the producing node identifies the product exchanged on each link.
- domain assumption The observed bank-payment subgraphs are representative of the true firm-to-firm supply network.
Cite this review
Pith. "Pith review of Multi-scale reconstruction of large supply networks." pith.science (2026). https://pith.science/paper/32RTJNTU
@misc{pith2026241216122,
  author       = {Pith},
  title        = {Pith review of: Multi-scale reconstruction of large supply networks},
  year         = {2026},
  howpublished = {\url{https://pith.science/paper/32RTJNTU}},
  note         = {Machine review of arXiv:2412.16122}
}
read the original abstract
The structure of the supply chain network has important implications for modelling economic systems, from growth trajectories to responses to shocks or natural disasters. However, reconstructing firm-to-firm networks from available information poses several practical and theoretical challenges: the lack of publicly available data, the complexity of meso-scale structures, and the high level of heterogeneity of firms. With this work we contribute to the literature on economic network reconstruction by proposing a novel methodology based on a recently developed multi-scale model. This approach has three main advantages over other methods: its parameters are defined to maintain statistical consistency at different scales of node aggregation, it can be applied in a multi-scale setting, and it is computationally more tractable for very large graphs. The consistency at different scales of aggregation, inherent to the model definition, is preserved for any hierarchy of coarse-grainings. The arbitrariness of the aggregation allows us to work across different scales, making it possible to estimate model parameters even when node information is inconsistent, such as when some nodes are firms while others are countries or regions. Finally, the model can be fitted at an aggregate scale with lower computational requirements, since the parameters are invariant to the grouping of nodes. We assess the advantages and limitations of this approach by testing it on two complementary datasets of Dutch firms constructed from inter-client transactions on the bank accounts of two major Dutch banking institutions. We show that the model reliably predicts important topological properties of the observed network in several scenarios of practical interest and is therefore a suitable candidate for reconstructing firm-to-firm networks at scale.
Figures


Figures from the paper (10 more)




Forward citations
Cited by 3 Pith papers
-
Synthetic supply networks
A new pipeline generates synthetic firm-level supply networks that match selected empirical network statistics and aggregate exactly to national input-output tables using only public data.
-
Reconstructing Large Scale Production Networks
A four-step algorithm reconstructs millions-firm production networks from public sector flows and firm-size distributions, but key validation claims appear only in the abstract.
-
Renormalizable Graph Embeddings For Multi-Scale Network Reconstruction
Scale-invariant graph embeddings whose parameters add under node merging give consistent multi-scale network reconstructions, with accuracy that depends on the metric and model family.
Reference graph
Works this paper leans on
-
[1]
F. Schweitzer, G. Fagiolo, D. Sornette, F. Vega-Redondo, A. Vespignani, and D. R. White, science 325, 422 (2009)
work page 2009
-
[2]
B. S. Bernanke, Brookings Papers on Economic Activity 2018, 251 (2018)
work page 2018
-
[3]
V. M. Carvalho, M. Nirei, Y. U. Saito, and A. Tahbaz-Salehi, The Quarterly Journal of Economics 136, 1255 (2021)
work page 2021
-
[4]
F. Henriet, S. Hallegatte, and L. Tabourier, Journal of Economic Dynamics and Control 36, 150 (2012)
work page 2012
-
[5]
D. Acemoglu, V. M. Carvalho, A. Ozdaglar, and A. Tahbaz-Salehi, Econometrica 80, 1977 (2012)
work page 2012
-
[6]
M. G. A. Contreras and G. Fagiolo, Physical Review E 90, 062812 (2014)
work page 2014
-
[7]
A. Pichler, M. Pangallo, R. M. del Rio-Chanona, F. Lafond, and J. D. Farmer, Journal of Economic Dynamics and Control 144, 104527 (2022)
work page 2022
-
[8]
K. Huremovic, G. Jim´ enez, E. Moral-Benito, J.-L. Peydr´ o, and F. Vega-Redondo, Available at SSRN 4657236 (2023)
work page 2023
Show all 54 references
-
[9]
McNerney, C
J. McNerney, C. Savoie, F. Caravelli, V. M. Carvalho, and J. D. Farmer, Proceedings of the National Academy of Sciences 119, e2106031118 (2022)
2022
-
[10]
Klimek, S
P. Klimek, S. Poledna, and S. Thurner, Nature communications 10, 1677 (2019)
2019
-
[11]
C. Diem, A. Borsos, T. Reisch, J. Kert´ esz, and S. Thurner, Scientific reports 12, 7719 (2022)
2022
-
[12]
Colon, S
C. Colon, S. Hallegatte, and J. Rozenberg, Nature Sustainability 4, 209 (2021)
2021
-
[13]
C. Diem, A. Borsos, T. Reisch, J. Kert´ esz, and S. Thurner, PNAS nexus 3, pgae064 (2024)
2024
-
[14]
Moran and J.-P
J. Moran and J.-P. Bouchaud, Physical Review E 100, 032307 (2019). 21
2019
-
[15]
Lafond, P
F. Lafond, P. Astudillo-Est´ evez, A. Bacilieri, and A. Borsos, Firm-level production networks: what do we (really) know?, Tech. Rep. (INET Oxford Working Paper, 2023)
2023
-
[16]
Demir, A
B. Demir, A. C. Fieler, D. Y. Xu, and K. K. Yang, Journal of Political Economy 132, 200 (2024)
2024
-
[17]
Fujiwara and H
Y. Fujiwara and H. Aoyama, The European Physical Journal B 77, 565 (2010)
2010
-
[18]
Mizuno, W
T. Mizuno, W. Souma, and T. Watanabe, Plos one 9, e100712 (2014)
2014
-
[19]
Inoue and Y
H. Inoue and Y. Todo, Nature Sustainability 2, 841 (2019)
2019
-
[20]
Fujiwara, H
Y. Fujiwara, H. Inoue, T. Yamaguchi, H. Aoyama, T. Tanaka, and K. Kikuchi, EPJ data science 10, 19 (2021)
2021
-
[21]
Atalay, A
E. Atalay, A. Hortacsu, J. Roberts, and C. Syverson, Proceedings of the National Academy of Sciences 108, 5199 (2011)
2011
-
[22]
Dhyne, A
E. Dhyne, A. K. Kikkawa, M. Mogstad, and F. Tintelnot, The Review of Economic Studies 88, 643 (2021)
2021
-
[23]
A. B. Bernard, A. Moxnes, and Y. U. Saito, Journal of Political Economy 127, 639 (2019)
2019
-
[24]
Squartini, G
T. Squartini, G. Caldarelli, G. Cimini, A. Gabrielli, and D. Garlaschelli, Physics reports 757, 1 (2018)
2018
-
[25]
Mungo, A
L. Mungo, A. Brintrup, D. Garlaschelli, and F. Lafond, Journal of Physics: Complexity 5, 012001 (2024)
2024
-
[26]
Campajola, F
C. Campajola, F. Lillo, P. Mazzarisi, and D. Tantari, Journal of Statistical Mechanics: Theory and Experiment 2021, 033412 (2021)
2021
- [27]
-
[28]
Reisch, G
T. Reisch, G. Heiler, C. Diem, and S. Thurner, arXiv preprint arXiv:2110.05625 (2021)
2021 arXiv
-
[29]
Mungo, F
L. Mungo, F. Lafond, P. Astudillo-Est´ evez, and J. D. Farmer, Journal of Economic Dynamics and Control 148, 104607 (2023)
2023
-
[30]
L. N. Ialongo, C. de Valk, E. Marchese, F. Jansen, H. Zmarrou, T. Squartini, and D. Gar- laschelli, Scientific Reports 12, 1 (2022)
2022
-
[31]
Brintrup, P
A. Brintrup, P. Wichmann, P. Woodall, D. McFarlane, E. Nicks, and W. Krechel, Complexity 2018 (2018)
2018
-
[32]
E. E. Kosasih and A. Brintrup, International Journal of Production Research , 1 (2021)
2021
-
[33]
Bacilieri and P
A. Bacilieri and P. Austudillo-Estevez, arXiv preprint arXiv:2304.00081 (2023)
2023 arXiv
-
[34]
Garuccio, M
E. Garuccio, M. Lalli, and D. Garlaschelli, Physical Review Research 5, 043101 (2023). 22
2023
- [35]
-
[36]
C. E. Mattsson, F. W. Takes, E. M. Heemskerk, C. Diks, G. Buiten, A. Faber, and P. M. Sloot, Frontiers in big Data 4, 666712 (2021)
2021
-
[37]
Di Vece, F
M. Di Vece, F. P. Pijpers, and D. Garlaschelli, Scientific Reports 14, 3625 (2024)
2024
-
[38]
macro” link that we did not sample before there can be no “micro
as a special case. The main advantages of our model with respect to [38] is that in our approach the density of connections is an exogenous parameter that we are free to change, that we have a consistent model at all scales, and that we take the functional structure of product...
2000
-
[39]
A. B. Bernard and Y. Zi, Sparse production networks, Tech. Rep. (National Bureau of Eco- nomic Research, 2022)
2022
-
[40]
Milocco, F
R. Milocco, F. Jansen, and D. Garlaschelli, arXiv preprint arXiv:2412.04354 (2024)
2024
-
[41]
Council of European Union, Regulation (ec) no 696/1993 of 15 march 1993 on the statistical units for the observation and analysis of the production system in the community (1993)
1993
-
[42]
Chung and L
F. Chung and L. Lu, Annals of combinatorics 6, 125 (2002)
2002
-
[43]
V. M. Carvalho, Journal of Economic Perspectives 28, 23 (2014). 23 Appendix A: Supplementary Information
2014
-
[44]
The data was provided to us by ABN AMRO Bank N.V
Data The analysis has been conducted on production networks at firm level extracted from payments data of two major Dutch financial institutions. The data was provided to us by ABN AMRO Bank N.V. (ABN) and ING Bank N.V. (ING). Note that for privacy reasons the data was not sha...
-
[46]
Multi-scale model derivation Given a network with N nodes and L edges between them, we define an aggregated node as a collection of these original nodes. An edge will exist at a given aggregation level l if and only if at least one edge existed from the set of nodes belonging ...
-
[47]
Random allocation model Let us consider the multi-scale formula with a single dimension given by the size of the company. We can approximate the value by taking the first element of the Taylor series expansion of the exponential function, giving us the following: pij = 1 − e−δ...
-
[48]
In figure 7a we plot the complementary cumulative distribution of the in- and out-strengths if we include or exclude the ROW node
Rest of the world embeddings performance We show here the improvement in reconstruction performance obtained from using the full information available in our datasets about the firm embeddings. In figure 7a we plot the complementary cumulative distribution of the in- and out-s...
-
[49]
We report here in figures 8a and 8b the effect on reconstructing the degree distribution
Firm level information effects In the main text we have briefly discussed the effect of firm-level information on the reconstruction accuracy of the model. We report here in figures 8a and 8b the effect on reconstructing the degree distribution. We can see that the uniform cas...
-
[50]
Even if these do not exist at the lowest level, when no aggregation is present, they can arise through aggregation
Undirected networks and accounting for self-loops The multi-scale model allows for connection of a node with itself. Even if these do not exist at the lowest level, when no aggregation is present, they can arise through aggregation. We can see that in the model we have present...
-
[51]
To see this we must first generalize our model to include the possibility of an edge existing between layers
Aggregating product layers We note that the functional form of the multi-scale model is not only invariant to node aggregation but also to product aggregation under certain conditions. To see this we must first generalize our model to include the possibility of an edge existin...
-
[52]
This is due to the fact that we have industries as nodes but we are also using the industrial classification of the source vertex of an edge to determine the product layer
Estimating the parameters from aggregate data When estimating the parameters from an input-output table we usually have that the number of layers and aggregated nodes are the same. This is due to the fact that we have industries as nodes but we are also using the industrial cl...
-
[53]
Conditional probability under fine-graining In many cases of practical interest we will not only have access to the fitness variables of the node and the global density for calibration but to some coarse-grained graph as well. In this case, when trying to find the probability ...
-
[54]
Additional figures We report for completeness additional figures generated for this analysis. 40 102 103 104 105 Number of vertices 10 4 10 3 10 2 10 1 100 Link density (%) Empirical dcIN scIN (a) 0 1 2 3 4 5 6 7 Aggregation level 0.4 0.6 0.8 1.0Density parameter 1e 12 (b) 5 d...
2022
-
[2022]
Note that the direction of the connections has been chosen opposite the flow of money to reflect instead the movement of goods
For clarity we will mostly show results concerning the ABN dataset and refer to the Supplementary Information for the duplicate result when useful. Note that the direction of the connections has been chosen opposite the flow of money to reflect instead the movement of goods. I...
Reviewed August 11, 2026 · model on record in the stance chip above.
Discussion (0). Continue with ORCID to comment.