REVIEW 6 minor 23 references
Measurement of the variation of electron-to-proton mass ratio using ultracold molecules produced from laser-cooled atoms
T0 review · 0 major / 6 minor · reviewed 2026-08-14 · deepseek-v4-flash
Pith's one-line read Ultracold KRb molecules provide the most precise molecular laboratory bound on temporal variation of the electron-to-proton mass ratio, five times tighter than before.
desk verdict A clean, statistically limited molecular measurement of μ-variation that delivers the first ultracold realization of DeMille's enhanced-sensitivity idea and improves the best molecular limit by a factor of five. read the letter →
The pith
A machine-rendered reading of the paper's core claim, the machinery that carries it, and where it could break.
The reading
What carries the argument
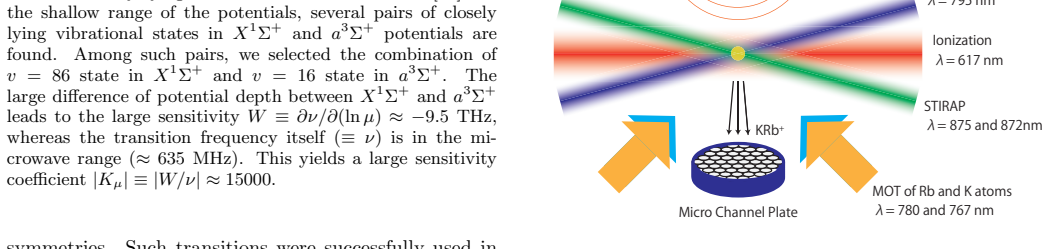
The load-bearing object is the near-degenerate pair of vibrational levels, $v=86$ in the deep $X^1\Sigma^+$ potential and $v=16$ in the shallow $a^3\Sigma^+$ potential of $^{41}$K$^{87}$Rb. Their energy separation is only about 635 MHz, while the individual energies have large and opposite dependence on $\ln \mu$, producing $W \approx -9.45$ THz and $|K_\mu| \approx 15000$. The sensitivity is computed from experimentally determined potential energy curves, so it is not tied to a free-parameter model. The protocol uses stimulated Raman adiabatic passage (STIRAP) to prepare a rovibrationally pure molecular sample, a 16 ms microwave $\pi$-pulse to drive the transition, and a simultaneous Zeeman-sensitive transition to subtract the second-order magnetic shift.
What would settle it
Measure the $v=86$ to $v=16$ energy interval, or the same microwave transition, in another KRb isotopologue and compare with the prediction from the same potential curves; a deviation beyond the quoted sensitivity uncertainty would invalidate $K_\mu$. Alternatively, an independent two-photon spectroscopic determination of the interval at sub-kHz accuracy would test the potential-curve-derived sensitivity.
Extended reading notes
Core claim
The central finding is that a microwave transition in ultracold KRb can serve as a nearly model-independent probe of the stability of $\mu$. The transition connects $|S=0,F_1=3/2,F=0,m_F=0\rangle$ in $v=86$ of $X^1\Sigma^+$ with $|S=1,F_1=1/2,F=1,m_F=0\rangle$ in $v=16$ of $a^3\Sigma^+$, at frequency $\nu = 634.96$ MHz. Its sensitivity coefficient is $K_\mu = W/\nu = -14890(60)$, with $W = \partial \nu/\partial(\ln \mu) \approx -9.45$ THz, so a fractional frequency measurement is magnified by roughly $1.5 \times 10^4$ in $\mu$. Over sixteen months of alternating measurements with a Zeeman-sensitive companion transition, the fractional frequency drift was $(-0.44 \pm 1.47_{\mathrm{stat}} \pm 0.24_{\mathrm{syst}}) \times 10^{-10}\,\mathrm{year}^{-1}$, which translates to $(1/\mu)(d\mu/dt) = (0.30 \pm 1.00_{\mathrm{stat}} \pm 0.16_{\mathrm{syst}}) \times 10^{-14}\,\mathrm{year}^{-1}$, a factor of five better than the most stringent previous molecular limit.
Load-bearing premise
The conversion from the measured frequency drift to a drift in $\mu$ assumes that the sensitivity coefficient $K_\mu = -14890(60)$, computed from the experimentally fitted potential energy curves of $^{41}$K$^{87}$Rb, is accurate to its quoted uncertainty.
Editorial extensions
If this is right
- Molecular spectroscopy now yields an independent laboratory bound on $\mu$ drift five times tighter than the previous molecular result, complementing atomic-clock limits that probe a different combination of constants.
- Because the dominant error is statistical, longer integration or larger molecular samples should improve the bound roughly as $\sqrt{N}$ in the number of detected molecules.
- The near-degeneracy enhancement can be sought in other alkali dimers or other isotopologues, where different potential curves may give even larger $|K_\mu|$.
- With proposed narrow-line laser cooling and molecular fountains or magic-wavelength lattices, linewidths near 1 Hz would convert the $\sim 10^4$ sensitivity into a proportionally stronger $\mu$-drift constraint.
Reading between the lines
- A direct isotope-substitution test of $K_\mu$ is an obvious next experiment: the ratio of transition frequencies between isotopologues is a predicted function of the potential curves, so any mismatch would expose errors in the sensitivity coefficient.
- If the statistical limit is pushed, the blackbody-radiation shift, currently the largest systematic, will need to be measured directly with infrared fields; the paper identifies this path but does not carry it out.
- The scheme effectively turns a microwave transition into a $\mu$-variation detector with built-in gain near $10^4$; applying the same idea to additional near-degenerate molecular pairs could create a set of independent probes with different systematic signatures.
Signed reviews
Editorial analysis
A structured set of objections, weighed in public.
Referee Report
Summary. The paper reports a new laboratory limit on the temporal variation of the electron-to-proton mass ratio μ using a ~635 MHz transition between the v=86 level of the X^1Σ^+ state and the v=16 level of the a^3Σ^+ state of ultracold ⁴¹K⁸⁷Rb molecules produced by photoassociation and STIRAP. The transition is chosen for its large sensitivity coefficient K_μ = −14890(60), calculated from published potential curves. From 16 months of intermittent measurements, the authors derive (1/μ)(dμ/dt) = (0.30 ± 1.00_stat ± 0.16_syst) × 10⁻¹⁴ yr⁻¹, a factor of five improvement over the previous most stringent molecular limit (Shelkovnikov et al.). The measurement is statistics-limited, with a 94 mHz statistical uncertainty per spectrum versus a 10 mHz systematic budget.
Significance. If the result stands, it provides the most accurate molecular constraint on μ-variation and demonstrates the power of ultracold, near-degenerate molecular levels for precision metrology. The analysis is internally consistent: the conversion from the measured fractional frequency drift to the μ drift is arithmetically sound, the error budget in Table I is dominated by counting statistics, and the sensitivity coefficient is derived from independent potential curves rather than from the variation data, so there is no circularity. The paper also gives a concrete path toward further improvement via molecular fountains or lattice trapping. These strengths justify publication; only local presentation issues remain.
minor comments (6)
- [Title] The title contains a typo: 'ra tio' should read 'ratio'.
- [Fig. 3 caption] The phrase 'full-width-of-half-maximum' should be 'full width at half maximum'.
- [Supplementary Table 1] The E_cal values for the F1=5/2 manifold (0.0000, 0.0009, 0.0008, 0.0004) appear to be residuals rather than absolute energies, contrary to the column header, which states that both E_exp and E_cal are measured from the |S=0,F1=3/2,F=0⟩ state; please clarify the column definition or correct the entries.
- [Methods, Uncertainty of the sensitivity] The description of how the 4 GHz uncertainty in W was estimated is too brief; please specify which vibrational levels were compared and how the uncertainties of the vibrational level intervals were propagated into the sensitivity uncertainty.
- [Introduction] The statement that the atomic-clock results of Refs. [9] and [10] are 'essentially measuring the variation of the electron-to-proton magnetic moment ratio' is an oversimplification; a more precise characterization of what those measurements constrain would be helpful.
- [Abstract] The phrase 'Observed limit' could be replaced with 'Measurement' or 'Constraint', since the result is a measurement with error bars consistent with zero variation.
Circularity Check
No circularity identified: the sensitivity coefficient is an independent conversion factor and the final limit is statistics-dominated.
full rationale
The derivation chain is: measure the transition frequency drift df/dt from repeated microwave spectroscopy; convert to dmu/dt using K_mu = W/nu = -14890(60), where W is computed from experimentally determined potential energy curves of 41K87Rb reported in Ref. [15] and the measured transition frequency nu = 634.96 MHz. No parameter of the temporal-variation analysis is fitted to the drift data. The hyperfine fit in the supplement (E0, A_K, A_Rb) is used for state assignment and Zeeman corrections, not to determine the drift; the time variation is extracted from a linear fit to the central frequencies of the same transition over 16 months, with the sensitivity coefficient entering only as a fixed multiplicative conversion. The sensitivity uncertainty (about 0.4%) is small compared with the 1.47e-10 statistical uncertainty of the frequency drift, so even a fivefold underestimate of K_mu would not change the conclusion. The cited potential curves [15] and enhancement proposal [11] are independent published works, not authored by the present authors, and the result is stated to be statistics-limited, consistent with the quoted error budget. The comparisons with Shelkovnikov et al. and atomic clock limits are external benchmarks rather than inputs. No step in the paper's equations reduces by construction to its own inputs; hence no circularity is present.
Assumptions & free parameters
free parameters (3)
- E0 =
4720.27 MHz
- A_K =
125.54 MHz
- A_Rb =
3384.99 MHz
assumptions (4)
- domain assumption Potential energy curves for X^1Σ+ and a^3Σ+ of 41K87Rb from Pashov et al. [15] are accurate within the quoted uncertainties.
- domain assumption The ab initio BBR shift coefficients from Beuc et al. [16] and dipole moments from Kotochigova et al. [17] are reliable within their stated uncertainties.
- domain assumption The hyperfine Hamiltonian H = A_K S_K·I_K + A_Rb S_Rb·I_Rb with N=0 only is sufficient to describe the observed states.
- domain assumption The sensitivity coefficient W is constant over the measurement period.
Cite this review
Pith. "Pith review of Measurement of the variation of electron-to-proton mass ratio using ultracold molecules produced from laser-cooled atoms." pith.science (2026). https://pith.science/paper/337EVC52
@misc{pith2026190808722,
  author       = {Pith},
  title        = {Pith review of: Measurement of the variation of electron-to-proton mass ratio using ultracold molecules produced from laser-cooled atoms},
  year         = {2026},
  howpublished = {\url{https://pith.science/paper/337EVC52}},
  note         = {Machine review of arXiv:1908.08722}
}
abstract
Experimental techniques to manipulate cold molecules have seen great development in recent years. The precision measurements of cold molecules are expected to give insights into fundamental physics. We use a rovibrationally pure sample of ultracold KRb molecules to improve the measurement on the stability of electron-to-proton mass ratio ($\mu = \frac{m_{\rm e}}{M_{\rm p}}$). The measurement is based upon a large sensitivity coefficient of the molecular spectroscopy, which utilizes a transition between nearly a degenerate pair of vibrational levels each associated with a different electronic potential. Observed limit on temporal variation of $\mu$ is $\frac{1}{\mu}\frac{d\mu}{dt} = (0.30\pm1.0) \times 10^{-14}$ year$^{-1}$, which is better by a factor of five compared with the most stringent laboratory molecular limits to date. Further improvements should be straightforward, because our measurement was only limited by statistical errors.
Figures


Figures from the paper (1 more)

Reference graph
Works this paper leans on
-
[1]
2(1. 1) × 10−16 year−1 [9] and 1 µ dµ dt = −0. 5(1. 6) × 10−16 year−1 [10] were obtained by using atomic clocks. These measurements are essentially measuring the vari- ∗ Electronic address: j-kobayashi@scphys.kyoto-u.ac.jp ation of the electron-to-proton magnetic moment ratio. Here we report a measurement on the variation of µ us- ing ultracold KRb molecu...
work page 2000
-
[2]
The ACME Collaboration, Improved limit on the electric dipole moment of the electron nature 562 355-360 (2018)
work page 2018
-
[3]
Cairncross W.B. et al. Precision Measurement of the Electron’s Electric Dipole Moment Using Trapped Molec- ular Ions Phys. Rev. Lett. 119, 153001 (2017)
work page 2017
-
[4]
Hudson J.J. et al. Improved measurement of the shape of the electron nature 473 493 (2011)
work page 2011
-
[5]
Carr L. D., DeMille D., Krems R.V., Ye J., Cold and ultracold molecules: science, technology and application s New Journal of Physics 11 055049 (2009)
work page 2009
-
[6]
Search for the electron electric dipole moment using Ωdoublet levels in PbO Phys
Eckel S., Hamilton P., Kirilov E., Smith H.W., and De- Mille D. Search for the electron electric dipole moment using Ωdoublet levels in PbO Phys. Rev. A 87, 052130 (2013)
work page 2013
-
[7]
DeMille D., Doyle J.M., Sushkov A.O. Probing the fron- tiers of particle physics with tabletop-scale experiments Science 357, 990-994 (2017)
work page 2017
-
[8]
Uzan, J. -P. The fundamental constants and their vari- ation: observational and theoretical status Rev. Mod. Phys. 75, 403-455 (2003)
work page 2003
Show all 23 references
-
[9]
J., Chardonnet, C
Shelkovnikov, A., Butcher, R. J., Chardonnet, C. & Amy- Klein, A. Stability of the Proton-to-Electron Mass Ratio Phys. Rev. Lett. 100, 150801 (2008)
2008
-
[10]
Godun, R. M. et al. Frequency Ratio of Two Optical Clock Transitions in 171Yb+ and Constraints on the Time Variation of Fundamental Constants Phys. Rev. Lett. 113, 210801 (2014)
2014
-
[11]
Huntemann, N. et al. Improved Limit on a Temporal Variation of mp/me from Comparisons of Yb + and Cs Atomic Clocks, Phys. Rev. Lett. 113, 210802 (2014)
2014
-
[12]
DeMille, D. et al. Enhanced Sensitivity to Variation of me/mp in Molecular Spectra Phys. Rev. Lett. 100, 043202 (2008)
2008
-
[13]
Aikawa, K. et al. Coherent Transfer of Photoassociated Molecules into the Rovibrational Ground State Phys. Rev. Lett. 105, 203001 (2010)
2010
-
[14]
Bagdonaite, J. et al. A stringent limit on a drifting proton-to-electron mass ratio from alcohol in the early universe Science 339 46-48 (2013)
2013
-
[15]
Leefer, N., Weber, C. T. M., Cing¨ oz, A., Torgerson, J. R. & Budker D. New Limits on Variation of the Fine- Structure Constant Using Atomic Dysprosium Phys. Rev. Let. 111, 060801 (2013)
2013
-
[17]
Beuc, R. et al. Predictions for the observation of KRb spectra under cold conditions J. Phys. B 39, S1191 (2006). 6
2006
-
[18]
Kotochigova, S., Julienne, P. S. & Tiesinga, E Ab initio calculation of KRb dipole moments Phys. Rev. A 68, 022501 (2003)
2003
-
[19]
& Inouye, S
Kobayashi, J., Aikawa, K., Oasa, K. & Inouye, S. Prospects for narrow-line cooling of KRb molecules in the rovibrational ground state Phys. Rev. A 89, 021401 (2014)
2014
-
[20]
Precision Tes t of Mass-Ratio Variations with Lattice-Confined Ultracold Molecules Phys
Zelevinsky, T., Kotochigova, S., & Ye, J. Precision Tes t of Mass-Ratio Variations with Lattice-Confined Ultracold Molecules Phys. Rev. Lett. 100, 043201 (2008)
2008
-
[21]
J., Kaewuam, R., Roy, A., Tan, T
Arnold, K. J., Kaewuam, R., Roy, A., Tan, T. R., & Barrett, M. D. Blackbody radiation shift assessment for lutetium in clock Nat. Comm. 9, 1650 (2018)
2018
-
[22]
Measurement of the variati on of electron-to-proton mass ratio using ultracold molecules produced from laser-c ooled atoms
Townes, C. H. & Schawlow, A. L. Microwave Spec- troscopy (Dover Publications, New York, 1975). End Notes Acknowledgements This work was supported by a Grant-in-Aid for Young Scientists (A) of JSPS (No. 23684034), a Grant-in-Aid for Scientific Research on Innovative Areas of JSP...
1975 arXiv
-
[23]
Pashov, A. et al. Coupling of the X 1Σ + and a3Σ + states of KRb. Phys. Rev. A 76, 022511 (2007)
2007
-
[24]
& Violino, P
Arimondo, E., Inguscio, M. & Violino, P. Experimental de terminations of the hyperfine structure in the alkali atoms Rev. Mod. Phys. 49, 31-75 (1977)
1977
Reviewed August 14, 2026 · model on record in the stance chip above.
Discussion (0). Continue with ORCID to comment.