REVIEW 4 major objections 4 minor 32 references
Analysis of Server Throughput For Managed Big Data Analytics Frameworks
T0 review · 4 major / 4 minor · reviewed 2026-08-07 · deepseek-v4-flash
Pith's one-line read Managed analytics frameworks reach higher server throughput by offloading heap objects to fast storage, because GC and serialization overhead—not DRAM capacity—cap CPU utilization.
desk verdict Useful co-location study of TeraHeap that is rougher than it looks: the Spark numbers are credible, but the unmeasured 'other time' and missing artifacts keep it from a clean accept. read the letter →
The pith
A machine-rendered reading of the paper's core claim, the machinery that carries it, and where it could break.
The reading
What carries the argument
The load-bearing mechanism is TeraHeap's dual-heap design: a regular Java managed heap (H1) that holds short-lived objects, plus a secondary memory-mapped heap (H2) over an NVMe device that holds long-lived objects. Because objects in H2 are accessed through direct memory-mapped I/O, serialization and deserialization are eliminated, and because GC scans skip H2, GC pause overhead drops; space in H2 is reclaimed lazily by returning whole regions rather than compacting live objects. The paper's methodology also manages each instance's cgroup DRAM budget as a split between H1 and the OS page cache, testing both H1-dominated (80/20) and page-cache-dominated (40/60) splits to separate the two memory uses.
What would settle it
Measure NVMe device throughput, I/O queue depth, and page-cache pressure during the co-located runs and correlate them with the growth of 'Other time' as instance count increases; if device utilization saturates before CPU utilization does, or if 'Other time' grows even when GC/S/D are already near zero, the CPU-efficiency conclusion would not generalize to storage-limited systems.
Extended reading notes
Core claim
The paper's central claim is that reducing garbage collection and serialization/deserialization overhead is the effective lever for raising server throughput in managed big-data analytics, while increasing memory per core is not. In co-located Spark runs at 8 GB per core, TeraHeap used up to 59% fewer CPU cycles than native Spark for the machine-learning workloads at four instances, and for Giraph at 16 GB per core TeraHeap scaled to four co-located instances where native Giraph failed with out-of-memory errors. The authors conclude that high CPU utilization in native Spark and Giraph largely reflects wasted cycles on GC and S/D, not useful application work, and that offloading the heap lowers the DRAM-per-core requirement, letting more instances share a server.
Load-bearing premise
The paper's conclusion assumes that the time labeled 'Other time' does not hide a compensating bottleneck such as NVMe throughput saturation, which the authors suspect but never measure, and that reducing GC and S/D is the actual cause of the throughput gains.
Editorial extensions
If this is right
- Cloud operators can pack more analytics instances per physical server when the heap is offloaded, since the DRAM-per-core requirement falls and throughput per server rises.
- For some Spark workloads under co-location, effective CPU utilization improves by up to 59% in CPU-cycle terms, meaning users pay for useful computation rather than GC and S/D.
- The finding implies that future servers with more memory per core will not, by themselves, deliver higher analytics throughput unless the GC/S/D overhead is also addressed.
- The paper's execution-breakdown methodology (GC, S/D, I/O, other) offers a reusable template for evaluating co-located managed workloads in other settings.
Reading between the lines
- A direct measurement of NVMe throughput and I/O queue depth during co-location would test whether 'Other time' growth is caused by device saturation; the paper suspects this but leaves it unmeasured.
- The up-to-50% cloud cost saving assumes hourly rental charges scale with wall-clock time; per-hour minimum billing or spot pricing could change the realized savings.
- The same off-heap strategy could plausibly extend to other managed runtimes with similar GC and serialization profiles, though only JVM-based Spark and Giraph are evaluated here.
- Testing on multi-socket, multi-NUMA, or RDMA-connected clusters would reveal whether the throughput gains persist when memory bandwidth or network, rather than DRAM capacity, becomes the binding constraint.
Editorial analysis
A structured set of objections, weighed in public.
Referee Report
Summary. This paper presents an empirical methodology for studying server throughput in managed big-data frameworks (Spark and Giraph) under workload co-location. The authors compare native JVM execution with TeraHeap (TH), a JVM extension that moves long-lived objects from the managed heap to a secondary heap on NVMe storage, thereby reducing GC overhead and eliminating serialization/deserialization (S/D) for off-heap data. Experiments are run at 4, 8, and 16 GB DRAM per core, with 2, 4, or 8 co-located instances per configuration. The paper reports execution-time breakdowns, CPU cycles, user/system utilization, interference, and average throughput, and concludes that increasing memory per core does not by itself maximize server throughput, that reducing GC and S/D improves effective CPU utilization for Spark, and that TeraHeap can reduce cloud rental cost by up to 50%.
Significance. If the central conclusion holds, the paper would provide a useful methodology for evaluating memory offloading in managed analytics frameworks and evidence that co-located server throughput can be improved by moving heap objects to fast storage rather than by simply increasing DRAM per core. The strength of the paper is its grounding in measured GC and S/D reductions against an external baseline (native JVM Spark/Giraph), its attention to memory-budget sizing for H1 versus page cache, and its explicit reporting of interference and standard deviations for several configurations. The work also makes a falsifiable prediction: reducing GC and S/D should increase effective CPU utilization and allow more co-located instances. However, the central attribution is weakened by an unmeasured 'Other time' component that the authors themselves suspect is device-throughput saturation, and by a definition of 'effective CPU utilization' that counts GC and S/D cycles as user CPU. These issues are load-bearing for the paper's main claim, so the present version requires additional measurement and analysis before the conclusions can be accepted at face value.
major comments (4)
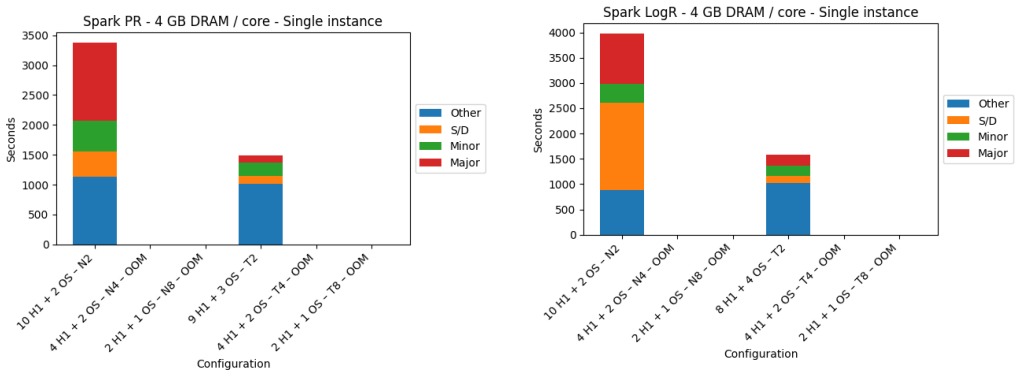
- [§5.5.2–5.5.4] The central attribution of throughput gains to reduced GC and S/D is undermined by the unmeasured 'Other time' component. In §5.5.2, §5.5.3, and §5.5.4 the authors repeatedly write 'We suspect device throughput reaching its limit with increasing number of instances, as the cause to other time for both Native and TH,' and §5.5.4 adds that TH has more Other time than Native because of page-granular I/O. Other time is a large and growing fraction of the co-located breakdowns (Figs. 17–24), yet no NVMe throughput, I/O queue depth, page-cache hit rate, or kernel CPU time is reported. If the growth in Other time comes from storage bandwidth saturation or page-cache pressure, the observed throughput advantage of TeraHeap is partly a storage effect rather than purely the effect of removing GC and S/D, and the abstract's claim that TeraHeap offloads 'without increasing the CPU load' is not established because system CPU time for I/O is not separated from the reported utilization. This concern is flagged by the authors' own text and needs to be resolved by direct I/O measurement.
- [§5.6] The definition of 'effective CPU utilization' is internally inconsistent. The text states that user utilization 'includes GC cycles, S/D cycles and cycles for mutator tasks except I/O' and then says 'we have to focus to User utilization, which includes the effective CPU cycles executed by the application.' Since GC and S/D are the very overheads the paper aims to remove, user utilization cannot be equated with effective application cycles. The CPU-cycle numbers are also derived rather than directly measured: §5.6 gives the formula '(total number of cores * cpu frequency * execution time of slowest instance * cpu utilization achieved by all instances)', which requires clarification of whether the utilization is time-averaged and how per-instance variation is handled. Without separating mutator cycles from GC/S-D cycles, the conclusion that fewer CPU cycles plus higher user utilization implies more effective CPU utilization due to reduced GC/S-D does not follow.
- [§5.5.5 and Table 1] The paper's headline claim that increasing memory per core does not help reach max server throughput is not directly supported by a controlled comparison. The evidence is that Spark cannot run more than 2 instances at 4 GB/core and that Native Giraph cannot run at 4 or 8 GB/core; however, the co-location runs at different memory-per-core levels differ in the number of instances, and there is no experiment that varies memory-per-core while holding instance count, workload, and dataset fixed and reports server throughput for those configurations. The observation that GC and S/D overheads persist at larger H1 sizes is suggestive, but the cross-scenario throughput conclusion needs either a dedicated controlled experiment or a more carefully scoped claim that avoids mixing heterogeneous configurations.
- [§5.5.8 and Table 3] The reproducibility of the quantitative claims is insufficient for a methodological empirical study. §5.5.8 states that only a subset of experiments was repeated (all 8 and 16 GB/core Spark runs with 2 and 4 instances, excluding the TH PC variants, and only one repetition for 2-instance Giraph), and Table 3 reports standard deviations for that subset only; one entry (LogR Native, 8 GB/core, 2 instances) reaches 10%, and the text also reports a 14% deviation for Native CC with 4 co-located instances. The paper does not provide raw data or scripts, and OOM runs are excluded from figures without being shown. As a result, the precise speedup, throughput, and 50% cost-reduction figures cannot be checked independently. Data release and a fuller repetition protocol would be needed to support the paper's methodology contribution.
minor comments (4)
- [Figures 15, 16, 30, 52; §5.5.3] Several figure/caption mismatches should be corrected: Figure 15's caption says Logistic Regression while the text describes PageRank; Figure 16's caption says Connected Component while the text describes PageRank; Figures 30 and 52 are captioned 'Page Rank' but the surrounding text describes CDLP; and §5.5.3 refers to Figures 21 and 22 (the 8 GB Giraph figures) when introducing the 16 GB Giraph runs.
- [§5.7 and Table 4] The cost model is underspecified: §5.7 says 'The calculations are very simple so we skip them,' Table 4 has a missing price for GCP 128 GB, and the 'up to 50%' estimate is asserted without showing per-configuration cost comparisons or the formula used to compute savings.
- [Throughout] The paper contains numerous typos and undefined terms, including 'Serialiation' in the abstract, 'utlization', 'choise', and the repeated use of 'Other time' without a formal definition of how this component is computed from the execution breakdown.
- [§4.4 and §1] The discussion of Alibaba and Facebook traces would be easier to verify if the specific figures or tables from the cited trace studies were identified; the current text cites the papers but does not locate the exact numbers used to motivate the 80% memory / 40% CPU and 2 GB-per-core claims.
Circularity Check
No circularity: TeraHeap's GC/S-D reductions are measured against native Spark/Giraph; self-citation is not load-bearing.
full rationale
The paper's central claim—that reducing GC and S/D improves effective CPU utilization and server throughput under co-location—is supported by direct measurements of the two systems (Native Spark/Giraph vs. TeraHeap) in the same experimental setup. The execution-time breakdowns (Figures 1-24) and CPU-cycle/utilization analyses (Figures 37-52) compare observed behavior; GC and S/D components are not set equal to the conclusion by construction. TeraHeap is cited from prior work [21] with a common author, but that citation is used to motivate the system's design, not as the evidence for the new throughput results: the present paper measures GC, S/D, CPU cycles, user/system utilization, and average throughput for both configurations. The H1/PC ratios and cgroup budgets are configurable inputs, not fitted parameters renamed as predictions. The cost estimate is a simple multiplication of measured execution times by cloud hourly rates, so it inherits the measurements rather than defining them. The only material limitation is the unmeasured 'Other time' (device-throughput suspicion in section 5.5.4), which threatens the attribution to GC/S-D and generalization; but an unmeasured confound is a validity risk, not a circular derivation. No equation or fitted parameter reduces to the paper's target claim, and no uniqueness/self-citation chain forces the conclusion. Therefore no significant circularity.
Assumptions & free parameters
free parameters (3)
- H1 fraction of cgroup DRAM budget =
0.80 baseline, 0.40 PC-dominant
- OS-reserved DRAM =
8 GB in all scenarios
- Dataset sizes per workload =
Spark PR/CC 8 GB, Spark LinR/LogR 64 GB, Giraph 13 GB
assumptions (4)
- domain assumption TeraHeap correctly eliminates S/D and reduces GC as described in reference [21]
- domain assumption CPU utilization split into user and system time correctly isolates GC, S/D, and I/O
- domain assumption Selected workloads and memory-per-core scenarios represent datacenter server conditions
- domain assumption Cgroup memory budgets constrain H1 and Page Cache as intended
Cite this review
Pith. "Pith review of Analysis of Server Throughput For Managed Big Data Analytics Frameworks." pith.science (2026). https://pith.science/paper/363NFKMR
@misc{pith2026250603854,
  author       = {Pith},
  title        = {Pith review of: Analysis of Server Throughput For Managed Big Data Analytics Frameworks},
  year         = {2026},
  howpublished = {\url{https://pith.science/paper/363NFKMR}},
  note         = {Machine review of arXiv:2506.03854}
}
read the original abstract
Managed big data frameworks, such as Apache Spark and Giraph demand a large amount of memory per core to process massive volume datasets effectively. The memory pressure that arises from the big data processing leads to high garbage collection (GC) overhead. Big data analytics frameworks attempt to remove this overhead by offloading objects to storage devices. At the same time, infrastructure providers, trying to address the same problem, attribute more memory to increase memory per instance leaving cores underutilized. For frameworks, trying to avoid GC through offloading to storage devices leads to high Serialization/Deserialization (S/D) overhead. For infrastructure, the result is that resource usage is decreased. These limitations prevent managed big data frameworks from effectively utilizing the CPU thus leading to low server throughput. We conduct a methodological analysis of server throughput for managed big data analytics frameworks. More specifically, we examine, whether reducing GC and S/D can help increase the effective CPU utilization of the server. We use a system called TeraHeap that moves objects from the Java managed heap (H1) to a secondary heap over a fast storage device (H2) to reduce the GC overhead and eliminate S/D over data. We focus on analyzing the system's performance under the co-location of multiple memory-bound instances to utilize all available DRAM and study server throughput. Our detailed methodology includes choosing the DRAM budget for each instance and how to distribute this budget among H1 and Page Cache (PC). We try two different distributions for the DRAM budget, one with more H1 and one with more PC to study the needs of both approaches. We evaluate both techniques under 3 different memory-per-core scenarios using Spark and Giraph with native JVM or JVM with TeraHeap. We do this to check throughput changes when memory capacity increases.
Figures


Figures from the paper (25 more)


Reference graph
Works this paper leans on
-
[1]
Per- formance characterization of spark workloads on shared numa systems
Marcelo Amaral, Jordà Polo, David Carrera, et al. Per- formance characterization of spark workloads on shared numa systems. In 2018 IEEE Fourth International Con- ference on Big Data Computing Service and Applica- tions (BigDataService), pages 41–48. IEEE, 2018
work page 2018
-
[2]
Aguilera, Auro- jit Panda, Sylvia Ratnasamy, and Scott Shenker
Emmanuel Amaro, Christopher Branner-Augmon, Zhi- hong Luo, Amy Ousterhout, Marcos K. Aguilera, Auro- jit Panda, Sylvia Ratnasamy, and Scott Shenker. Can far memory improve job throughput? InEuroSys 2020, Her- aklion, Greece. Association for Computing Machinery, April 2020
work page 2020
-
[3]
Amazon. Aws pricing calculator. https:// calculator.aws/#/, June 2023
work page 2023
-
[4]
Apache. Graphx. https://spark.apache.org/ graphx/
-
[5]
Apache. Mllib. https://spark.apache.org/ mllib/
-
[6]
Building spark (spark 3.4.0 - 2023 up- date)
Apache. Building spark (spark 3.4.0 - 2023 up- date). https://spark.apache.org/docs/latest/ building-spark.html, April 2023
work page 2023
-
[7]
Monitoring and instrumentation (spark 3.4.0 - 2023 update)
Apache. Monitoring and instrumentation (spark 3.4.0 - 2023 update). https://spark.apache.org/docs/ latest/monitoring.html, April 2023
work page 2023
-
[8]
Rdd programming guide (spark 3.4.0 - 2023 up- date)
Apache. Rdd programming guide (spark 3.4.0 - 2023 up- date). https://spark.apache.org/docs/latest/ rdd-programming-guide.html", 2023
work page 2023
Show all 32 references
-
[9]
Spark configuration (spark 3.4.0 - 2023 up- date)
Apache. Spark configuration (spark 3.4.0 - 2023 up- date). https://spark.apache.org/docs/latest/ configuration.html, April 2023
2023
-
[10]
Tuning spark (spark 3.4.0 - 2023 up- date)
Apache. Tuning spark (spark 3.4.0 - 2023 up- date). https://spark.apache.org/docs/latest/ tuning.html, April 2023
2023
-
[11]
Large scale graph processing systems: survey and an experimental evaluation
Omar Batarfi, Radwa El Shawi, Ayman G Fayoumi, Reza Nouri, Seyed-Mehdi-Reza Beheshti, Ahmed Bar- nawi, and Sherif Sakr. Large scale graph processing systems: survey and an experimental evaluation. Clus- ter Computing, 18:1189–1213, 2015. 27
2015
-
[12]
Interference analysis of co-located container workloads: a perspective from hard- ware performance counters
Wen-Yan Chen, Ke-Jiang Ye, Cheng-Zhi Lu, Dong-Dai Zhou, and Cheng-Zhong Xu. Interference analysis of co-located container workloads: a perspective from hard- ware performance counters. Journal of Computer sci- ence and Technology, 35:412–417, 2020
2020
-
[13]
Analyz- ing alibaba’s co-located datacenter workloads
Yue Cheng, Ali Anwar, and Xuejing Duan. Analyz- ing alibaba’s co-located datacenter workloads. In 2018 IEEE International Conference on Big Data (Big Data), pages 292–297. IEEE, 2018
2018
-
[14]
Characteriz- ing co-located datacenter workloads: An alibaba case study
Yue Cheng, Zheng Chai, and Ali Anwar. Characteriz- ing co-located datacenter workloads: An alibaba case study. In Proceedings of the 9th Asia-Pacific Workshop on Systems, pages 1–3, 2018
2018
-
[15]
Panthera: Holistic memory management for big data processing over hybrid memories
Wang et al. Panthera: Holistic memory management for big data processing over hybrid memories. In PLDI 2019: Proceedings of the 40th ACM SIGPLAN Confer- ence on Programming Language Design and Implemen- tation, 2019
2019
-
[16]
Facebook’s new front-end server design delivers on performance without suck- ing up power
Facebook. Facebook’s new front-end server design delivers on performance without suck- ing up power. https://engineering.fb. com/2016/03/09/data-center-engineering/ facebook-s-new-front-end-server-design-delivers-on-performance-without-sucking-up-power/
2016
-
[17]
Google cloud platform pricing cal- culator
Google. Google cloud platform pricing cal- culator. https://cloud.google.com/products/ calculator#id=, 2023
2023
-
[18]
Who limits the resource efficiency of my datacenter: An analysis of alibaba datacenter traces
Jing Guo, Zihao Chang, Sa Wang, Haiyang Ding, Yihui Feng, Liang Mao, and Yungang Bao. Who limits the resource efficiency of my datacenter: An analysis of alibaba datacenter traces. In Proceedings of the Inter- national Symposium on Quality of Service, pages 1–10, 2019
2019
-
[19]
Ldbc graphalytics: A benchmark for large-scale graph analysis on parallel and distributed platforms
Alexandru Iosup, Tim Hegeman, Wing Lung Ngai, Stijn Heldens, Arnau Prat-Pérez, Thomas Manhardto, Hassan Chafio, Mihai Capot˘a, Narayanan Sundaram, Michael Anderson, et al. Ldbc graphalytics: A benchmark for large-scale graph analysis on parallel and distributed platforms. volu...
2016
-
[20]
Understanding the behavior of in-memory computing workloads
Tao Jiang, Qianlong Zhang, Rui Hou, Lin Chai, Sally A Mckee, Zhen Jia, and Ninghui Sun. Understanding the behavior of in-memory computing workloads. In 2014 IEEE International Symposium on Workload Character- ization (IISWC), pages 22–30. IEEE, 2014
2014
-
[21]
Kolokasis, Anastasios Papagiannis, Polyvios Pratikakis, Angelos Bilas, Foivos Zakkak, Giannos Ev- dorou, Shoaib Akram, and Christos Kozanitis
Iacovos G. Kolokasis, Anastasios Papagiannis, Polyvios Pratikakis, Angelos Bilas, Foivos Zakkak, Giannos Ev- dorou, Shoaib Akram, and Christos Kozanitis. Teraheap: Reducing memory pressure in managed big data frame- works. In ASPLOS ’23, March 25-29, 2023, Vancouver, BC, Canad...
2023
-
[22]
Microsoft azure pricing calculator
Microsoft. Microsoft azure pricing calculator. https://azure.microsoft.com/en-us/pricing/ calculator/, 2023
2023
-
[23]
Spark-bench: A spark benchmarking suite characterizing large-scale in-memory data analytics
Yandong Wang Li Zhang Min Li, Jian Tan and Valentina Salapura. Spark-bench: A spark benchmarking suite characterizing large-scale in-memory data analytics. In Cluster Computing 20, 2575-2589
-
[24]
Java platform se 8
Oracle. Java platform se 8. https://github.com/ openjdk/jdk8, 2014
2014
-
[25]
Making sense of perfor- mance in data analytics frameworks
Kay Ousterhout, Ryan Rasti, Sylvia Ratnasamy, Scott Shenker, and Byung-Gon Chun. Making sense of perfor- mance in data analytics frameworks. In 12th {USENIX} symposium on networked systems design and implemen- tation ({NSDI} 15), pages 293–307, 2015
2015
-
[26]
Introduction to cgroups
RedHat. Introduction to cgroups. https: //access.redhat.com/documentation/en-us/ red_hat_enterprise_linux/6/html/resource_ management_guide/ch01
-
[27]
Setting the heap to 80% of to- tal dram in cgroup containers
RedHat. Setting the heap to 80% of to- tal dram in cgroup containers. https:// developers.redhat.com/articles/2023/03/07/ overhauling-memory-tuning-openjdk-containers-updates , 2023
2023
-
[28]
Large-scale graph processing using apache giraph (1st ed.)
Ibrahim Abdelaziz Sherif Sakr, Faisal Moeen Orakzai and Zuhair Khayyat. Large-scale graph processing using apache giraph (1st ed.). springer publishing company, incorporated
-
[29]
Kryo-serializer
Esoteric Software. Kryo-serializer. https://github. com/EsotericSoftware/kryo, 2013
2013
-
[30]
Twine: A unified cluster management system for shared infrastructure
Chunqiang Tang, Kenny Yu, Kaushik Veeraraghavan, Jonathan Kaldor, Scott Michelson, Thawan Kooburat, Aravind Anbudurai, Matthew Clark, Kabir Gogia, Long Cheng, et al. Twine: A unified cluster management system for shared infrastructure. In Proceedings of the 14th USENIX Confere...
2020
-
[31]
Tmo: Transparent memory offloading in datacenters
Johannes Weiner, Niket Agarwal, Dan Schatzberg, Leon Yang, Hao Wang, Blaise Sanouillet, Bikash Sharma, Tejun Heo, Mayank Jain, Chunqiang Tang, and Dim- itrios Skarlatos. Tmo: Transparent memory offloading in datacenters. In ASPLOS ’22, Lausanne, Switzerland. Association for Co...
2022
-
[32]
Xin, Patrick Wendell, Tatha- gata Das, Michael Armbrust, Ankur Dave, Xiangrui Meng, Josh Rosen, Shivaram Venkataraman, Michael J
Matei Zaharia, Reynold S. Xin, Patrick Wendell, Tatha- gata Das, Michael Armbrust, Ankur Dave, Xiangrui Meng, Josh Rosen, Shivaram Venkataraman, Michael J. 28 Franklin, Ali Ghodsi, Joseph Gonzalez, Scott Shenker, and Ion Stoica. Apache spark: A unified engine for big data proc...
2016
Reviewed August 7, 2026 · model on record in the stance chip above.
Discussion (0). Sign in to comment.