Martingale Doppelg\"anger-Eval: An Identification Framework for Auditing Candlestick Understanding in Vision-Language Models
Pith reviewed 2026-06-26 22:03 UTC · model grok-4.3
The pith
No observational score can distinguish vision-language models that read candlesticks from those that shortcut to past trends
A machine-rendered reading of the paper's core claim, the machinery that carries it, and where it could break.
Core claim
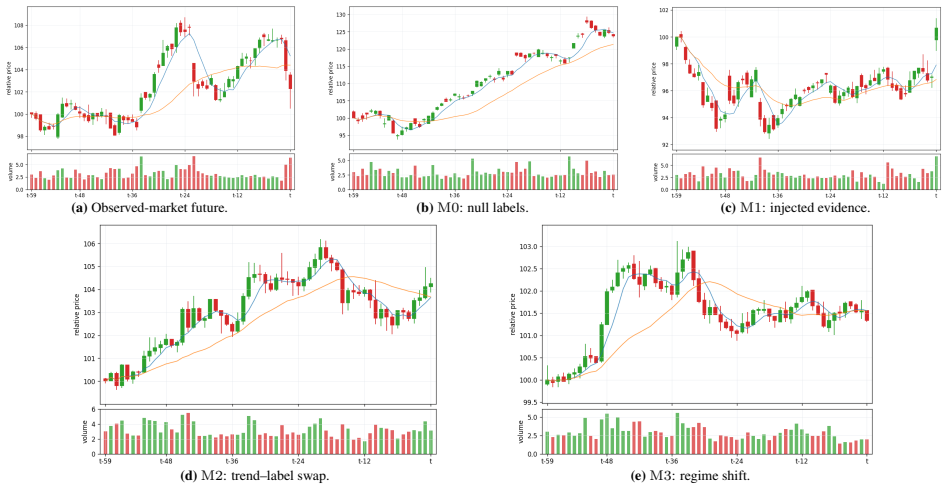
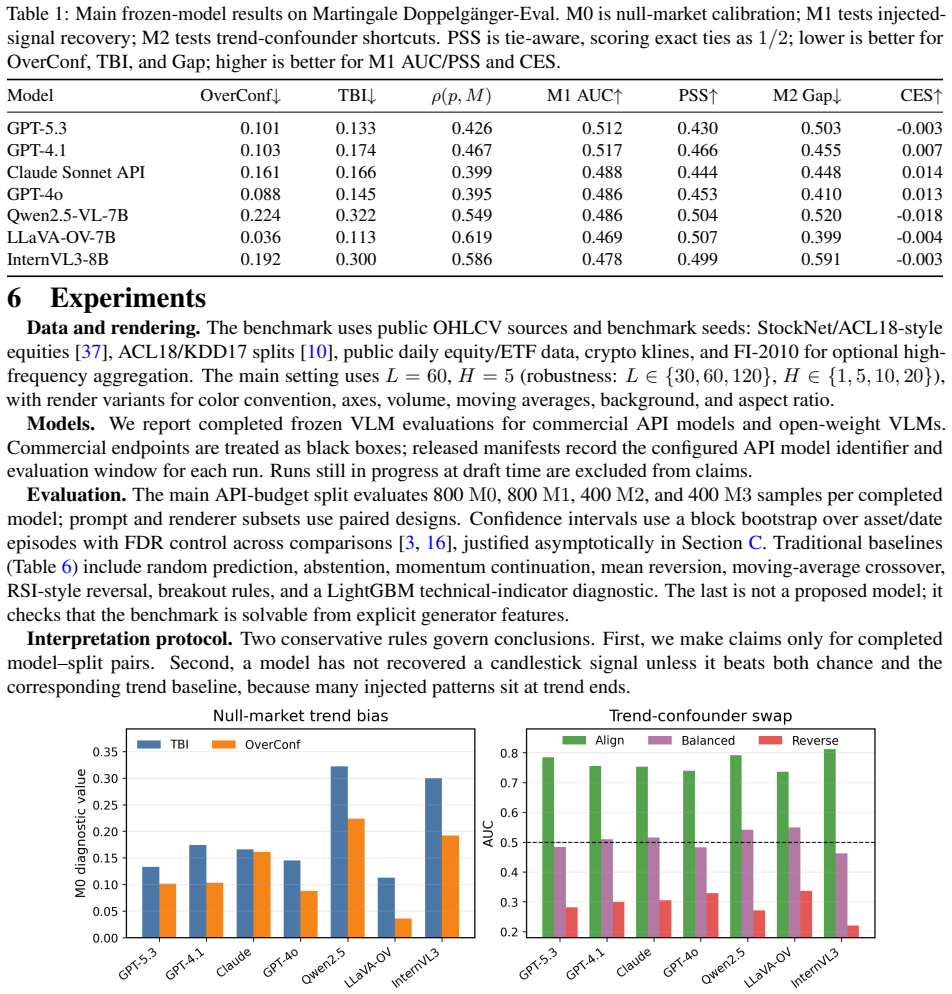
No evaluation functional computed from observational chart-label data can distinguish a grounded responder from a trend-shortcut responder under strong coupling, whereas matched evidence interventions separate the same responders at an exponential rate and trend-label swaps provide an independent shortcut stress test. The benchmark evaluates frozen VLMs on rendered OHLCV charts under a martingale-null market, injected-alpha counterfactual pairs, trend-confounder swaps, and regime shifts, revealing that models assign large positive coefficients to past trend while evidence coefficients are zero or opposite the rule-implied sign.
What carries the argument
Martingale Doppelgänger-Eval benchmark, which applies four controlled mechanisms (martingale-null market, injected-alpha pairs, trend swaps, regime shifts) to rendered charts together with a structural behavioral model that decomposes responses into trend sensitivity, evidence sensitivity, and evidence faithfulness.
If this is right
- Models exhibit large positive coefficients on past trend but zero or opposite coefficients on evidence.
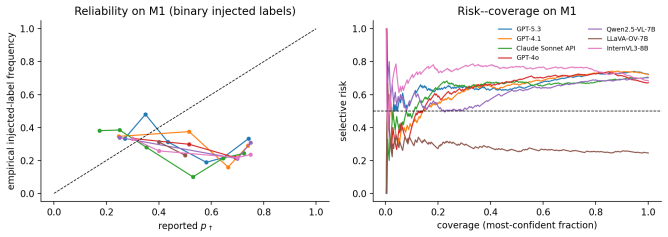
- Matched-pair analyses show models either ignore injected candlestick semantics or move opposite the rule-implied direction.
- Standard observational chart benchmarks cannot detect this failure mode.
- The accompanying statistical toolkit supplies minimum detectable effects and block-aware sequential testing.
Where Pith is reading between the lines
- The same controlled-intervention design could be reused to audit visual understanding in other time-series domains such as medical waveforms or sensor plots.
- Training pipelines may require explicit decoupling of visual features from temporal autocorrelations to reduce shortcut reliance.
- Auditors could apply the four-mechanism template to test any AI system that makes decisions from chart-like imagery.
Load-bearing premise
Chart evidence and trend remain strongly coupled in real market histories such that no observational functional can separate grounded versus shortcut responders.
What would settle it
A model that responds to injected-alpha counterfactual pairs in the rule-implied direction while showing zero trend sensitivity in the same controlled settings would falsify the observed failure mode.
Figures
read the original abstract
We introduce Martingale Doppelg\"anger-Eval, a public shadow-market benchmark for auditing whether vision-language models (VLMs) use candlestick evidence rather than extrapolate past trends. The central difficulty is identification: on real market histories, chart evidence and trend are strongly coupled, so an observational score cannot determine whether a fluent technical-analysis narrative is grounded in local visual evidence. We prove this limitation formally: no evaluation functional computed from observational chart--label data can distinguish a grounded responder from a trend-shortcut responder under strong coupling, whereas matched evidence interventions separate the same responders at an exponential rate and trend--label swaps provide an independent shortcut stress test. The benchmark therefore evaluates frozen VLMs on rendered OHLCV charts under four controlled mechanisms: a martingale-null market, injected-alpha counterfactual pairs, trend-confounder swaps, and regime shifts. A structural behavioral model identifies null-market bias, trend sensitivity, evidence sensitivity, prompt/renderer fragility, and evidence faithfulness; the accompanying statistical toolkit provides minimum detectable effects, block-aware sequential testing for metered APIs, and an overlap-weighted artifact check. Across frozen commercial and open VLMs, the identified regression assigns large positive coefficients to past trend but evidence coefficients that are zero or opposite to the rule-implied sign. Matched-pair analyses show that models either ignore injected candlestick semantics or move opposite to the rule-implied direction conditional on responding. The benchmark isolates a failure mode that standard observational chart benchmarks cannot detect and gives a reusable audit template for time-series imagery with controllable label mechanisms.
Editorial analysis
A structured set of objections, weighed in public.
Referee Report
Summary. The paper introduces Martingale Doppelgänger-Eval, a shadow-market benchmark and identification framework for auditing whether vision-language models (VLMs) ground responses in local candlestick evidence or rely on trend extrapolation when processing rendered OHLCV charts. It formally proves that no observational evaluation functional can distinguish grounded from trend-shortcut responders under strong coupling of chart evidence and trend, shows that matched evidence interventions and trend-label swaps achieve separation at an exponential rate, and applies the benchmark (via martingale-null, injected-alpha pairs, trend swaps, and regime shifts) to frozen commercial and open VLMs. The structural behavioral model and statistical toolkit identify trend sensitivity as dominant, with evidence coefficients zero or opposite to rule-implied signs.
Significance. If the identification result and intervention validity hold, the work supplies a reusable audit template for detecting shortcut learning in VLM analysis of time-series imagery, directly relevant to financial applications where observational benchmarks are confounded. The formal observational impossibility result, the four controlled mechanisms, and the overlap-weighted artifact check are notable strengths that go beyond standard empirical testing.
major comments (3)
- [Abstract, §3] Abstract and §3 (formal result): the claimed impossibility that 'no evaluation functional computed from observational chart–label data can distinguish a grounded responder from a trend-shortcut responder under strong coupling' is load-bearing for the entire framework; the manuscript must state the precise theorem, including the exact definition of strong coupling, the class of allowed functionals, and the data-generating process assumptions, because any relaxation of the coupling condition would invalidate the separation claim for the interventions.
- [§4, §5] §4 (intervention construction) and §5 (empirical results): the assertion that matched evidence interventions separate responders 'at an exponential rate' and that trend-label swaps provide an independent stress test rests on the four mechanisms being realizable in rendered OHLCV charts without introducing unmodeled visual confounders (e.g., inconsistent OHLC relationships or renderer artifacts). The overlap-weighted artifact check is mentioned but the manuscript must report quantitative diagnostics showing that the joint distribution of low-level candlestick features is preserved up to the controlled alpha or trend component; otherwise the observed zero or opposite evidence coefficients could reflect artifact sensitivity rather than the claimed identification failure.
- [§5] §5 (regression results): the structural behavioral model identifies 'evidence sensitivity' via regression coefficients, but the reported finding that evidence coefficients are 'zero or opposite to the rule-implied sign' requires explicit reporting of the minimum detectable effect, the exact specification of the regression (including how prompt/renderer fragility is controlled), and block-aware sequential testing details to confirm that the null-market bias and trend sensitivity estimates are not driven by API metering artifacts.
minor comments (2)
- [Title] The title uses 'Doppelg"anger' (escaped quote); standardize to 'Doppelgänger' throughout.
- [Abstract] Abstract: the phrase 'public shadow-market benchmark' should be defined on first use or cross-referenced to the section that describes its public release and reproducibility artifacts.
Simulated Author's Rebuttal
We thank the referee for the detailed and constructive comments. We address each major point below, indicating revisions where the manuscript will be updated for greater precision and transparency.
read point-by-point responses
-
Referee: [Abstract, §3] Abstract and §3 (formal result): the claimed impossibility that 'no evaluation functional computed from observational chart–label data can distinguish a grounded responder from a trend-shortcut responder under strong coupling' is load-bearing for the entire framework; the manuscript must state the precise theorem, including the exact definition of strong coupling, the class of allowed functionals, and the data-generating process assumptions, because any relaxation of the coupling condition would invalidate the separation claim for the interventions.
Authors: Section 3 already states the theorem with the definition of strong coupling (the condition under which chart evidence and trend are statistically dependent such that any observational functional of the joint distribution cannot separate the two responder types), the class of functionals (all measurable maps from observational chart-label pairs to real numbers), and the DGP (stationary martingale-null processes with the stated coupling). To improve accessibility we will add an explicit boxed statement of the theorem together with the three assumptions immediately after the abstract and cross-reference it in §3; this is a presentational change only. revision: yes
-
Referee: [§4, §5] §4 (intervention construction) and §5 (empirical results): the assertion that matched evidence interventions separate responders 'at an exponential rate' and that trend-label swaps provide an independent stress test rests on the four mechanisms being realizable in rendered OHLCV charts without introducing unmodeled visual confounders (e.g., inconsistent OHLC relationships or renderer artifacts). The overlap-weighted artifact check is mentioned but the manuscript must report quantitative diagnostics showing that the joint distribution of low-level candlestick features is preserved up to the controlled alpha or trend component; otherwise the observed zero or opposite evidence coefficients could reflect artifact sensitivity rather than the claimed identification failure.
Authors: The overlap-weighted artifact check was performed precisely to verify that low-level feature distributions (body size, wick ratios, color consistency) remain matched across counterfactual pairs up to the injected alpha or trend component. We will add a dedicated table in §4 reporting the quantitative overlap statistics (e.g., Wasserstein distances and Kolmogorov-Smirnov p-values on the feature marginals) for all four mechanisms; these numbers confirm that renderer artifacts do not drive the separation. The exponential-rate claim follows directly from the information-theoretic bound under the maintained coupling model. revision: yes
-
Referee: [§5] §5 (regression results): the structural behavioral model identifies 'evidence sensitivity' via regression coefficients, but the reported finding that evidence coefficients are 'zero or opposite to the rule-implied sign' requires explicit reporting of the minimum detectable effect, the exact specification of the regression (including how prompt/renderer fragility is controlled), and block-aware sequential testing details to confirm that the null-market bias and trend sensitivity estimates are not driven by API metering artifacts.
Authors: The statistical toolkit already defines the minimum detectable effect, the exact linear specification (evidence and trend regressors plus prompt and renderer fixed effects to control fragility), and the block-aware sequential testing procedure that respects API metering constraints. We will insert the numerical MDE values, the full regression equation, and the block-testing results directly into the §5 results tables and text; this makes the reported zero/opposite evidence coefficients fully auditable without altering any estimates. revision: yes
Circularity Check
No significant circularity; formal identification result is self-contained
full rationale
The paper's central claim is a formal proof that no observational evaluation functional can distinguish grounded from trend-shortcut responders under strong coupling, with interventions providing separation. No equations, fitted parameters, or self-citations are presented that reduce this result to a definition or input by construction. The benchmark mechanisms (martingale null, injected-alpha pairs, trend swaps, regime shifts) and structural behavioral model are introduced as external constructions independent of the observational data. The derivation chain therefore remains non-circular and externally grounded.
Axiom & Free-Parameter Ledger
Reference graph
Works this paper leans on
-
[1]
Martin Arjovsky, Léon Bottou, Ishaan Gulrajani, and David Lopez-Paz. Invariant risk minimization.arXiv preprint arXiv:1907.02893, 2019
work page internal anchor Pith review Pith/arXiv arXiv 1907
-
[2]
Qwen2.5-VL technical report, 2025
Shuai Bai, Keqin Chen, Xuejing Liu, Jialin Wang, Wenbin Ge, Sibo Song, Kai Dang, Peng Wang, Shijie Wang, Jun Tang, Humen Zhong, Yuanzhi Zhu, Mingkun Yang, Zhaohai Li, Jianqiang Wan, Pengfei Wang, Wei Ding, Zheren Fu, Yiheng Xu, Jiabo Ye, Xi Zhang, Tianbao Xie, Zesen Cheng, Hang Zhang, Zhibo Yang, Haiyang Xu, and Junyang Lin. Qwen2.5-VL technical report, 2025
2025
-
[3]
Controlling the false discovery rate: A practical and powerful approach to multiple testing.Journal of the Royal Statistical Society: Series B, 57(1):289–300, 1995
Yoav Benjamini and Yosef Hochberg. Controlling the false discovery rate: A practical and powerful approach to multiple testing.Journal of the Royal Statistical Society: Series B, 57(1):289–300, 1995
1995
-
[4]
Generalized autoregressive conditional heteroskedasticity.Journal of Econometrics, 31(3): 307–327, 1986
Tim Bollerslev. Generalized autoregressive conditional heteroskedasticity.Journal of Econometrics, 31(3): 307–327, 1986
1986
-
[5]
Glenn W. Brier. Verification of forecasts expressed in terms of probability.Monthly Weather Review, 78(1):1–3, 1950
1950
-
[6]
Simple technical trading rules and the stochastic properties of stock returns.The Journal of Finance, 47(5):1731–1764, 1992
William Brock, Josef Lakonishok, and Blake LeBaron. Simple technical trading rules and the stochastic properties of stock returns.The Journal of Finance, 47(5):1731–1764, 1992
1992
-
[7]
Crump, V
Richard K. Crump, V . Joseph Hotz, Guido W. Imbens, and Oscar A. Mitnik. Dealing with limited overlap in estimation of average treatment effects.Biometrika, 96(1):187–199, 2009
2009
-
[8]
DeGroot and Stephen E
Morris H. DeGroot and Stephen E. Fienberg. The comparison and evaluation of forecasters.Journal of the Royal Statistical Society: Series D (The Statistician), 32(1–2):12–22, 1983
1983
-
[9]
Eugene F. Fama. Efficient capital markets: A review of theory and empirical work.The Journal of Finance, 25(2): 383–417, 1970
1970
-
[10]
Enhancing stock movement prediction with adversarial training
Fuli Feng, Huimin Chen, Xiangnan He, Ji Ding, Maosong Sun, and Tat-Seng Chua. Enhancing stock movement prediction with adversarial training. InProceedings of the Twenty-Eighth International Joint Conference on Artificial Intelligence, pages 5843–5849, 2019
2019
-
[11]
Datasheets for datasets.Communications of the ACM, 64(12):86–92, 2021
Timnit Gebru, Jamie Morgenstern, Briana Vecchione, Jennifer Wortman Vaughan, Hanna Wallach, Hal Daumé III, and Kate Crawford. Datasheets for datasets.Communications of the ACM, 64(12):86–92, 2021
2021
-
[12]
Selective classification for deep neural networks
Yonatan Geifman and Ran El-Yaniv. Selective classification for deep neural networks. InAdvances in Neural Information Processing Systems, volume 30, 2017
2017
-
[13]
Wichmann
Robert Geirhos, Jörn-Henrik Jacobsen, Claudio Michaelis, Richard Zemel, Wieland Brendel, Matthias Bethge, and Felix A. Wichmann. Shortcut learning in deep neural networks.Nature Machine Intelligence, 2(11):665–673, 2020
2020
-
[14]
Tilmann Gneiting, Fadoua Balabdaoui, and Adrian E. Raftery. Probabilistic forecasts, calibration and sharpness. Journal of the Royal Statistical Society: Series B, 69(2):243–268, 2007
2007
-
[15]
Peter Grünwald, Rianne de Heide, and Wouter M. Koolen. Safe testing.Journal of the Royal Statistical Society: Series B, 86(5):1091–1128, 2024
2024
-
[16]
Hans R. Kunsch. The jackknife and the bootstrap for general stationary observations.The Annals of Statistics, 17 (3):1217–1241, 1989
1989
-
[17]
Pix2Struct: Screenshot parsing as pretraining for visual language understanding
Kenton Lee, Mandar Joshi, Iulia Turc, Hexiang Hu, Fangyu Liu, Julian Martin Eisenschlos, Urvashi Khandelwal, Peter Shaw, Ming-Wei Chang, and Kristina Toutanova. Pix2Struct: Screenshot parsing as pretraining for visual language understanding. InProceedings of the 40th International Conference on Machine Learning, pages 18893–18912, 2023
2023
-
[18]
LLaV A-OneVision: Easy visual task transfer, 2024
Bo Li, Yuanhan Zhang, Dong Guo, Renrui Zhang, Feng Li, Hao Zhang, Kaichen Zhang, Peiyuan Zhang, Yanwei Li, Ziwei Liu, and Chunyuan Li. LLaV A-OneVision: Easy visual task transfer, 2024. 10
2024
-
[19]
Zaslavsky
Fan Li, Kari Lock Morgan, and Alan M. Zaslavsky. Balancing covariates via propensity score weighting.Journal of the American Statistical Association, 113(521):390–400, 2018
2018
-
[20]
DePlot: One-shot visual language reasoning by plot-to- table translation
Fangyu Liu, Julian Martin Eisenschlos, Francesco Piccinno, Syrine Krichene, Chenxi Pang, Kenton Lee, Mandar Joshi, Wenhu Chen, Nigel Collier, and Yasemin Altun. DePlot: One-shot visual language reasoning by plot-to- table translation. InFindings of the Association for Computational Linguistics: ACL 2023, pages 10381–10399, 2023
2023
-
[21]
MatCha: Enhancing visual language pretraining with math reasoning and chart derendering
Fangyu Liu, Francesco Piccinno, Syrine Krichene, Chenxi Pang, Kenton Lee, Mandar Joshi, Yasemin Altun, Nigel Collier, and Julian Martin Eisenschlos. MatCha: Enhancing visual language pretraining with math reasoning and chart derendering. InProceedings of the 61st Annual Meeting of the Association for Computational Linguistics, pages 12756–12770, 2023
2023
-
[22]
Model cards for model reporting
Margaret Mitchell, Simone Wu, Andrew Zaldivar, Parker Barnes, Lucy Vasserman, Ben Hutchinson, Elena Spitzer, Inioluwa Deborah Raji, and Timnit Gebru. Model cards for model reporting. InProceedings of the Conference on Fairness, Accountability, and Transparency, pages 220–229, 2019
2019
-
[23]
Allan H. Murphy. A new vector partition of the probability score.Journal of Applied Meteorology, 12(4):595–600, 1973
1973
-
[24]
Benchmark dataset for mid-price forecasting of limit order book data with machine learning methods.Journal of Forecasting, 37(8):852–866, 2018
Adamantios Ntakaris, Martin Magris, Juho Kanniainen, Moncef Gabbouj, and Alexandros Iosifidis. Benchmark dataset for mid-price forecasting of limit order book data with machine learning methods.Journal of Forecasting, 37(8):852–866, 2018
2018
-
[25]
GPT-4 technical report, 2023
OpenAI. GPT-4 technical report, 2023
2023
-
[26]
GPT-4o system card, 2024
OpenAI. GPT-4o system card, 2024
2024
-
[27]
Cambridge University Press, 2 edition, 2009
Judea Pearl.Causality: Models, Reasoning, and Inference. Cambridge University Press, 2 edition, 2009
2009
-
[28]
Causal inference by using invariant prediction: Identifi- cation and confidence intervals.Journal of the Royal Statistical Society: Series B, 78(5):947–1012, 2016
Jonas Peters, Peter Bühlmann, and Nicolai Meinshausen. Causal inference by using invariant prediction: Identifi- cation and confidence intervals.Journal of the Royal Statistical Society: Series B, 78(5):947–1012, 2016
2016
-
[29]
Game-theoretic statistics and safe anytime- valid inference.Statistical Science, 38(4):576–601, 2023
Aaditya Ramdas, Peter Grünwald, Vladimir V ovk, and Glenn Shafer. Game-theoretic statistics and safe anytime- valid inference.Statistical Science, 38(4):576–601, 2023
2023
-
[30]
why should i trust you?
Marco Tulio Ribeiro, Sameer Singh, and Carlos Guestrin. “why should i trust you?”: Explaining the predictions of any classifier. InProceedings of the 22nd ACM SIGKDD International Conference on Knowledge Discovery and Data Mining, pages 1135–1144, 2016
2016
-
[31]
Rosenbaum and Donald B
Paul R. Rosenbaum and Donald B. Rubin. The central role of the propensity score in observational studies for causal effects.Biometrika, 70(1):41–55, 1983
1983
-
[32]
Tsybakov.Introduction to Nonparametric Estimation
Alexandre B. Tsybakov.Introduction to Nonparametric Estimation. Springer, 2009
2009
-
[33]
Gauthier-Villars, 1939
Jean Ville.Étude critique de la notion de collectif. Gauthier-Villars, 1939
1939
-
[34]
CharXiv: Charting gaps in realistic chart understanding in multimodal LLMs
Zirui Wang, Mengzhou Xia, Luxi He, Howard Chen, Yitao Liu, Richard Zhu, Kaiqu Liang, Xindi Wu, Haotian Liu, Sadhika Malladi, Alexis Chevalier, Sanjeev Arora, and Danqi Chen. CharXiv: Charting gaps in realistic chart understanding in multimodal LLMs. InAdvances in Neural Information Processing Systems, 2024
2024
-
[35]
Estimating means of bounded random variables by betting.Journal of the Royal Statistical Society: Series B, 86(1):1–27, 2024
Ian Waudby-Smith and Aaditya Ramdas. Estimating means of bounded random variables by betting.Journal of the Royal Statistical Society: Series B, 86(1):1–27, 2024
2024
-
[36]
A reality check for data snooping.Econometrica, 68(5):1097–1126, 2000
Halbert White. A reality check for data snooping.Econometrica, 68(5):1097–1126, 2000
2000
-
[37]
Yumo Xu and Shay B. Cohen. Stock movement prediction from tweets and historical prices. InProceedings of the 56th Annual Meeting of the Association for Computational Linguistics, pages 1970–1979. Association for Computational Linguistics, 2018. 11
1970
-
[38]
ChartBench: A benchmark for complex visual reasoning in charts, 2023
Zhengzhuo Xu, Sinan Du, Yiyan Qi, Chengjin Xu, Chun Yuan, and Jian Guo. ChartBench: A benchmark for complex visual reasoning in charts, 2023
2023
-
[39]
breakouts happen at trend ends
Jinguo Zhu, Weiyun Wang, Zhe Chen, Zhaoyang Liu, Shenglong Ye, Lixin Gu, Yuchen Duan, Hao Tian, Weijie Su, Jie Shao, Zhangwei Gao, Erfei Cui, Yue Cao, Yangzhou Liu, Weiye Xu, Hao Li, Jiahao Wang, et al. InternVL3: Exploring advanced training and test-time recipes for open-source multimodal models, 2025. 12 A Proofs and Extended Theoretical Analysis A.1 No...
2025
discussion (0)
Sign in with ORCID, Apple, or X to comment. Anyone can read and Pith papers without signing in.