REVIEW 3 major objections 4 minor 33 references
Dynamic Dependence Modeling in financial time series
T0 review · 3 major / 4 minor · reviewed 2026-08-14 · deepseek-v4-flash
Pith's one-line read A new bottom-up method detects copula changes in financial time series more reliably than three existing change-point detectors, and a dynamic copula model fitted with it captures more risk for S&P 500 and Nasdaq portfolios than a static…
desk verdict Two new copula change-detection heuristics worth knowing about, but the paper's central backtest claim is an in-sample artifact and the simulations are single-run. read the letter →
The pith
A machine-rendered reading of the paper's core claim, the machinery that carries it, and where it could break.
The reading
What carries the argument
The engine is the Huang-Prokhorov rank-based goodness-of-fit test statistic, a specification test derived from White's information-matrix equality; under correct copula specification it is asymptotically chi-square with degrees of freedom equal to the number of copula parameters (or three for the bivariate Student-t copula). This statistic is used inside four detection algorithms; the two new ones are (1) Accelerated Moving Window, which uses a warning limit line and a control limit line from the chi-square distribution to trigger window-shrinking checks, and (2) Bottom-up, which merges small contiguous segments layer by layer when their copula families agree and the pooled test statistic remains below the control limit. The Bottom-up method is the one ultimately applied to the real data.
What would settle it
A direct simulation study could falsify the central claim: generate a long bivariate series that switches between two known copulas with widely different dependence strengths, apply the Bottom-up method, and check whether it detects all change points. If the method misses a change point that a simple Binary Segmentation finds, or reports a change point where none exists, the claim that Bottom-up is the best performer would be contradicted. For the Accelerated Moving Window, one can numerically compute the test statistic as the window gradually includes observations from a second copula; a non-monotone path would falsify the monotonicity assumption.
Extended reading notes
Core claim
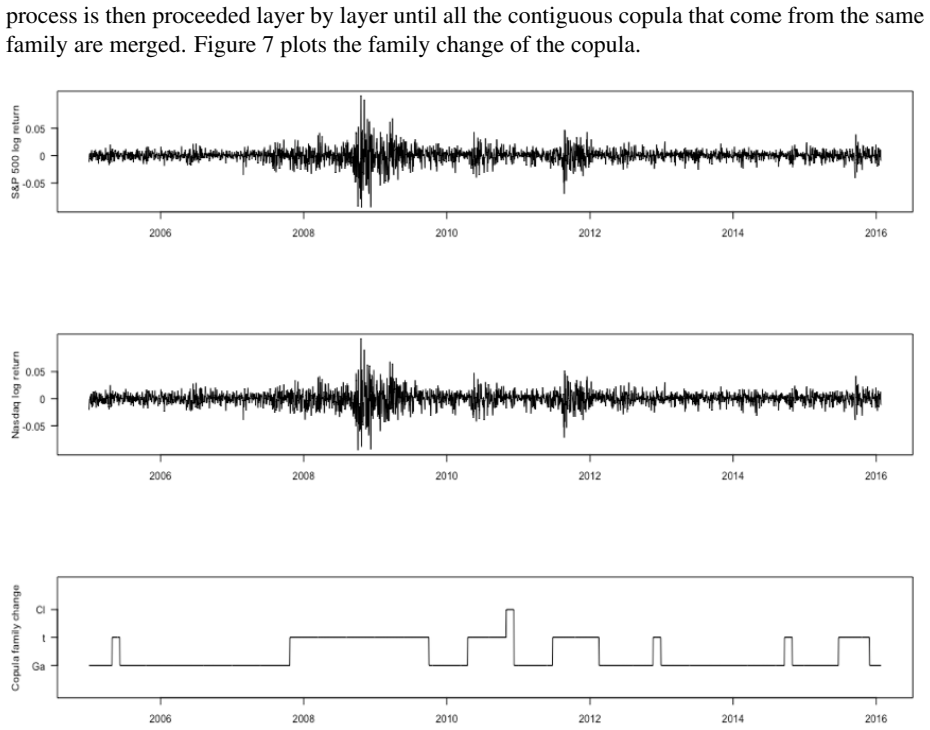
The central claim is that copula family and parameter changes in financial returns can be detected reliably using a rank-based goodness-of-fit test combined with carefully constructed change-point algorithms. The paper introduces two algorithms: Accelerated Moving Window, which watches the test statistic cross warning and control limits derived from chi-square critical values, and Bottom-up, which splits the data into small segments, fits a copula to each, and merges adjacent segments only when they share a copula family and the pooled goodness-of-fit statistic stays below the control limit. On simulated data with known change points, the Bottom-up method is reported to outperform Binary Segmentation and the two moving-window methods in accuracy. Applied to S&P 500 and Nasdaq from 2005 to 2015, the method finds many copula family changes (Gaussian, Student-t, Clayton) and parameter changes, mostly from Gaussian in calm periods to Student-t or Clayton in turbulent periods, and the resulting dynamic model produces larger VaR and ES figures than the static Student-t copula, especially during the 2008 crisis.
Load-bearing premise
The Accelerated Moving Window method assumes that the goodness-of-fit test statistic rises monotonically when observations from a different copula are added to the estimation window; the paper presents this as an observation without proof, and if the statistic is non-monotonic or noisy, the warning and control limit logic would produce false or missed change points.
Editorial extensions
If this is right
- If the Bottom-up method is as accurate as claimed, retrospective studies of dependence breakdowns can date copula changes more precisely, letting risk models switch families at the right time.
- Dynamic VaR and ES that exceed static-model values imply that using a constant copula underestimates tail risk during crises for portfolios of correlated equity indices.
- The Accelerated Moving Window method, even with its detection delay, offers a real-time warning system for dependence breakdowns that does not require knowing the change point in advance.
- Financial event timing can be cross-referenced with estimated copula change dates to test hypotheses about what drives dependence shifts.
Reading between the lines
- The monotonicity assumption behind the Accelerated Moving Window method could be tested directly: generate a window mixing data from two known copulas in varying proportions and check whether the goodness-of-fit statistic strictly increases; such a calibration study would tell practitioners how reliable the warning/control limit logic is.
- One could extend the Bottom-up method to higher dimensions or to copula families beyond Gaussian, Student-t, and Clayton; the paper says extension is straightforward, but the minimum segment size may need to scale with dimensionality.
- The finding that Gaussian copulas fit calm periods and Student-t/Clayton fit turbulent periods suggests a regime-switching extension where copula family is a hidden state; this would let the dynamic model be used for out-of-sample forecasting rather than only retrospective detection.
- Because the real-data analysis uses only two indices over one decade, a natural next test is to apply the Bottom-up method to other asset pairs and longer histories to see whether the detected change points consistently align with major economic events.
Signed reviews
Editorial analysis
A structured set of objections, weighed in public.
Referee Report
Summary. The paper proposes two new methods for detecting changes in the copula family and parameters of bivariate financial return series: an Accelerated Moving Window method based on warning/control limit lines for the Huang-Prokhorov goodness-of-fit statistic, and a Bottom-up segmentation method based on merging contiguous segments. It compares these with Binary Segmentation and a Moving Window method on simulated data with known change points, identifies the Bottom-up method as the best performer, and applies it to S&P 500 and Nasdaq daily returns from 4 January 2005 to 31 December 2015 after GARCH(2,1) marginal filtering. VaR and Expected Shortfall at the 5% level are computed from the dynamic segmented copula and from a static Student-t copula, and the paper claims that the dynamic copula captures risk better than the static model and that this is demonstrated through backtesting.
Significance. The paper addresses an important practical question—whether time-varying dependence matters for risk measurement—and brings a rank-based goodness-of-fit test with a chi-square asymptotic distribution to the copula change-point detection problem. The algorithms are described at an implementable level and the empirical tables are detailed. However, the central claims are not yet supported by the evidence: the simulation ranking rests on a single data set, the empirical risk comparison is an in-sample fit rather than a genuine backtest, and the monotonicity assumption underpinning the Accelerated Moving Window is unverified. If the authors provide replicated simulation results and a proper out-of-sample backtest with formal coverage tests, the contribution could be a useful applied paper for practitioners in financial risk management.
major comments (3)
- [Section 3.2.3] The VaR/ES comparison is not a backtest, despite the abstract and Section 4 claiming that it is. The change points and copula fits in Table 5 are obtained by applying the Bottom-up method to the full sample from 4 January 2005 to 31 December 2015, and the VaR/ES values in Figures 8 and 9 are then computed on that same sample. The dynamic model therefore uses full-sample information, including knowledge of the 2008 crisis, when it reports larger VaR and ES values; a static copula fitted once over the whole sample is not a fair benchmark. No out-of-sample period, no expanding or rolling estimation scheme, no violation ratios, and no Kupiec or Christoffersen coverage tests are reported. The conclusion that dynamic dependence modeling outperforms static modeling for risk measurement is not supported by this in-sample comparison. A genuine backtest with an out-of-sample evaluation protocol and formal backtest statistics is required.
- [Section 3.1.3] The simulation comparison that supports the claim that Bottom-up is the best-performing method is based on a single realization per scenario. Section 3.1.2 explicitly states that seed 626 is used, and the results in Tables 1 and 2 and Figure 5 do not report any replication, standard errors, detection probabilities, or distributions of detected change-point locations. For example, Table 2 reports distances such as -100, indicating detection before the true change point, but the text does not explain how such early detections arise or how they should be interpreted. Without averaging over many simulated data sets, the ranking of the four methods could easily be driven by noise. The authors should rerun the simulations many times and report the empirical distribution of detection errors and detection rates for each method.
- [Section 2.2.3] The Accelerated Moving Window method relies on the assertion in Section 2.2.3 that the Huang-Prokhorov test statistic 'monotonically increases when data that come from a different model start to be added to the window.' This is a load-bearing assumption: the warning-limit and control-limit logic will trigger false alarms or missed change points if the statistic is non-monotonic or noisy under local contamination. The paper provides no proof and only a single illustrative example (Figure 3) instead of a systematic empirical study. The authors should either prove monotonicity under appropriate regularity conditions or examine the behavior of the statistic on many simulated paths around the change point, reporting the frequency of false crossings of the warning and control limits.
minor comments (4)
- [Algorithm 2.4] Step (4) states 'While H0 is rejected (Test statistic<χ²...)' but under the White/Huang-Prokhorov test the null is rejected when the statistic exceeds the critical value, not when it is below. The inequality appears to be reversed and should be corrected.
- [Table 2] The negative distances to the true change point (e.g., -100) are not discussed. If the Bottom-up segmentation can report a change point before the actual change, the authors should explain the mechanism and clarify how such outcomes are counted as errors.
- [Section 2.1] The notation in the definition of the test statistic and its covariance matrix V_θ0 is dense and not fully defined (e.g., the dependence of d_t on unknown margins, the distinction between d_t and the empirical version, and the use of 'vech' are briefly stated but not systematically explained). Please proofread and clarify the notation.
- [Section 3.1.1] The text says 'To replicate the results, we generate 10000 random data' but does not state the seed used for Tables 1 and 2; only Section 3.1.2 mentions seed 626. Please state the seed and, more importantly, provide replication results as indicated in the major comments.
Circularity Check
Empirical VaR/ES comparison in §3.2.3 is an in-sample fit, not a backtest; the methodological simulation result is independently grounded.
-
fitted input called prediction
[Section 3.2.3 (Risk measurement strategy), with Table 5 and Figures 8–9; abstract's 'backtesting' claim.]
"We assign equal weight to S&P 500 and Nasdaq indices and then calculate Value-at-risk and Expected shortfall per 20 trading days based on static copula and dynamic respectively to consider the time evolution. ... Figure 9 presents the outcome that applies the dynamic copula obtained in Table 5 ... However, the dynamic copula forecast 0.35 and 0.55 for VaR and ES, which considers more loss than the static copula."
The dynamic copula 'obtained in Table 5' is produced by applying the Bottom-up change-point detector to the full 2768-day sample (Section 3.2.2). VaR/ES are then computed 'per 20 trading days' over that same full sample for both the dynamic and static models. No holdout period, expanding window, or violation-based backtest is used. The dynamic model therefore uses full-sample information, including the 2008 crisis, when constructing its Student-t/Clayton segments, so its larger VaR/ES values are in-sample fitted outputs rather than forecasts. The comparison reduces to contrasting fitted values of two models on their own estimation data, and calling this 'backtesting' in the abstract and 'forecast' in the text does not create an out-of-sample prediction.
full rationale
The paper's main methodological content—the four change-point-detection algorithms and their comparison on simulated data with known true change points—is externally grounded and not circular. In particular, Table 1 and Table 2 benchmark against known simulated change points, and there is no load-bearing self-citation chain: the cited works (Vostrikova, Guegan–Caillault, Fryzlewicz, Huang–Prokhorov, etc.) are not by the present authors. The Accelerated Moving Window monotonicity assumption is an unproved but non-circular modeling assumption. The one significant circularity is the empirical risk-measure demonstration in Section 3.2.3: the dynamic copula is fitted to the full sample, and VaR/ES are computed over the same sample, so the claimed superiority of dynamic over static modeling is an in-sample artifact of the change-point fit rather than a backtested prediction. This affects the paper's central empirical claim, although the simulation-based comparison of detection methods retains independent content; hence a partial-circularity score of 6 rather than a higher forced-by-definition score.
Assumptions & free parameters
free parameters (8)
- Moving window size N =
500
- Moving window skip K =
120
- Initial window size Nmin =
200
- Window increment D =
50
- Warning limit confidence alpha_w =
0.85
- Control limit confidence alpha_c =
0.95
- Bottom-up segment size (simulation) =
100
- Bottom-up segment size (empirical) =
27
assumptions (6)
- standard math Sklar's theorem guarantees a unique copula representation for continuous margins.
- standard math Information matrix equivalence holds for correctly specified copula models.
- standard math The test statistic F follows an asymptotic chi-squared distribution.
- domain assumption The log-copula density is three-times differentiable with computable expectations.
- ad hoc to paper The goodness-of-fit test statistic increases monotonically when data from a different copula are added.
- domain assumption GARCH(2,1) with Normal innovations adequately describes the marginal return series.
Cite this review
Pith. "Pith review of Dynamic Dependence Modeling in financial time series." pith.science (2026). https://pith.science/paper/3HBR6KBL
@misc{pith2026190805130,
  author       = {Pith},
  title        = {Pith review of: Dynamic Dependence Modeling in financial time series},
  year         = {2026},
  howpublished = {\url{https://pith.science/paper/3HBR6KBL}},
  note         = {Machine review of arXiv:1908.05130}
}
read the original abstract
This paper explores the dependence modeling of financial assets in a dynamic way and its critical role in measuring risk. Two new methods, called Accelerated Moving Window method and Bottom-up method are proposed to detect the change of copula. The performance of these two methods together with Binary Segmentation \cite{vostrikova1981detection} and Moving Window method \cite{guegan2009forecasting} is compared based on simulated data. The best-performing method is applied to Standard \& Poor 500 and Nasdaq indices. Value-at-Risk and Expected Shortfall are computed from the dynamic and the static model respectively to illustrate the effectiveness of the best method as well as the importance of dynamic dependence modeling through backtesting.
Figures


Figures from the paper (6 more)




Reference graph
Works this paper leans on
-
[1]
A new look at the statistical model identification
Hirotugu Akaike. A new look at the statistical model identification. IEEE transactions on automatic control, 19(6):716–723, 1974
work page 1974
-
[2]
Asymmetric correlations of equity portfolios
Andrew Ang and Joseph Chen. Asymmetric correlations of equity portfolios. Journal of financial Economics, 63(3):443–494, 2002
work page 2002
-
[3]
A new approach to measuring financial contagion
Kee-Hong Bae, G Andrew Karolyi, and Reneé M Stulz. A new approach to measuring financial contagion. The Review of Financial Studies, 16(3):717–763, 2003
work page 2003
-
[4]
The euro and european finan- cial market dependence
Söhnke M Bartram, Stephen J Taylor, and Yaw-Huei Wang. The euro and european finan- cial market dependence. Journal of Banking & Finance, 31(5):1461–1481, 2007
work page 2007
-
[5]
Empirical estimation of tail dependence using copulas: application to asian markets
Cyril Caillault and Dominique Guegan. Empirical estimation of tail dependence using copulas: application to asian markets. Quantitative Finance, 5(5):489–501, 2005
work page 2005
-
[6]
A new algorithm based on copulas for var valuation with empirical calculations
Gang Cheng, Ping Li, and Peng Shi. A new algorithm based on copulas for var valuation with empirical calculations. Theoretical computer science, 378(2):190–197, 2007
work page 2007
-
[7]
Change-point analysis for dependence struc- tures in finance and insurance
Alexandra Da Costa Dias and P Embrechts. Change-point analysis for dependence struc- tures in finance and insurance. 2004
work page 2004
-
[8]
Measuring financial risks with copulas
Beatriz Vaz de Melo Mendes and Rafael Martins de Souza. Measuring financial risks with copulas. International Review of Financial Analysis, 13(1):27–45, 2004
work page 2004
Show all 33 references
-
[9]
Modeling exchange rate dependence dynamics at different time horizons
Alexandra Dias and Paul Embrechts. Modeling exchange rate dependence dynamics at different time horizons. Journal of International Money and Finance , 29(8):1687–1705, 2010
2010
-
[10]
Copula-based risk management models for multivariable rmb exchange rate in the process of rmb internationalization
Jiangze Du and Kin Keung Lai. Copula-based risk management models for multivariable rmb exchange rate in the process of rmb internationalization. Journal of Systems Science and Complexity, 30(3):660–679, 2017
2017
-
[11]
Paul Embrechts, Filip Lindskog, and Er J. Mcneil. Modelling dependence with copulas and applications to risk management. 8, 10 2001
2001
-
[12]
Correlation and dependence in risk management: properties and pitfalls
Paul Embrechts, Alexander McNeil, and Daniel Straumann. Correlation and dependence in risk management: properties and pitfalls. Risk management: value at risk and beyond , 176223, 2002
2002
-
[13]
Autoregressive conditional heteroscedasticity with estimates of the vari- ance of united kingdom inflation
Robert F Engle. Autoregressive conditional heteroscedasticity with estimates of the vari- ance of united kingdom inflation. Econometrica: Journal of the Econometric Society, pages 987–1007, 1982
1982
-
[14]
Tail-greedy bottom-up data decompositions and fast multiple change- point detection, 2016
Piotr Fryzlewicz. Tail-greedy bottom-up data decompositions and fast multiple change- point detection, 2016. 25
2016
-
[15]
Goodness-of-fit tests for copulas: A review and a power study
Christian Genest, Bruno Rémillard, and David Beaudoin. Goodness-of-fit tests for copulas: A review and a power study. Insurance: Mathematics and economics , 44(2):199–213, 2009
2009
-
[16]
Forecasting var and expected shortfall using dy- namical systems: A risk management strategy
Dominique Guegan and Caillault Cyril. Forecasting var and expected shortfall using dy- namical systems: A risk management strategy. 2004
2004
-
[17]
Forecasting var and expected shortfall using dy- namical systems: A risk management strategy
Dominique Guegan and Caillault Cyril. Forecasting var and expected shortfall using dy- namical systems: A risk management strategy. 2009
2009
-
[18]
Change analysis of a dynamic copula for measuring dependence in multivariate financial data
Dominique Guegan and Jing Zhang. Change analysis of a dynamic copula for measuring dependence in multivariate financial data. Quantitative Finance, 10(4):421–430, 2010
2010
-
[19]
Essays in econometrics with applications in macroeconomic and financial mod- eling
Ling Hu. Essays in econometrics with applications in macroeconomic and financial mod- eling. 2003
2003
-
[20]
A goodness-of-fit test for copulas
Wanling Huang and Artem Prokhorov. A goodness-of-fit test for copulas. Econometric Reviews, 33(7):751–771, 2014
2014
-
[21]
Fitting bivariate cumulative returns with copulas.Computational statis- tics & data analysis, 45(2):355–372, 2004
Werner Hürlimann. Fitting bivariate cumulative returns with copulas.Computational statis- tics & data analysis, 45(2):355–372, 2004
2004
-
[22]
The copula-garch model of conditional dependencies: An international stock market application
Eric Jondeau and Michael Rockinger. The copula-garch model of conditional dependencies: An international stock market application. Journal of international money and finance , 25(5):827–853, 2006
2006
-
[23]
Li, David X. (2000). On Default Correlation: A Copula Function Approach. Journal of Fixed Income, 9 (4): 43?54
2000
-
[24]
Extreme correlation of international equity markets
Francois Longin and Bruno Solnik. Extreme correlation of international equity markets. The journal of finance, 56(2):649–676, 2001
2001
-
[25]
The variation of certain speculative prices
Benoit Mandelbrot. The variation of certain speculative prices. The journal of business , 36(4):394–419, 1963
1963
-
[26]
Quantitative risk management: Concepts, techniques and tools
Alexander J McNeil, Rüdiger Frey, and Paul Embrechts. Quantitative risk management: Concepts, techniques and tools. Princeton university press, 2015
2015
-
[27]
Statistical quality control, volume 7
Douglas C Montgomery. Statistical quality control, volume 7. Wiley New York, 2009
2009
-
[28]
Modelling time-varying exchange rate dependence using the conditional copula
Andrew J Patton. Modelling time-varying exchange rate dependence using the conditional copula. 2001
2001
-
[29]
On the out-of-sample importance of skewness and asymmetric depen- dence for asset allocation
Andrew J Patton. On the out-of-sample importance of skewness and asymmetric depen- dence for asset allocation. Journal of Financial Econometrics, 2(1):130–168, 2004
2004
-
[30]
Fonctions de repartition an dimensions et leurs marges
Abel Sklar. Fonctions de repartition an dimensions et leurs marges. Publ. inst. statist. univ. Paris, 8:229–231, 1959. 26
1959
-
[31]
Detection of the disorder in multidimensional random-processes
Lioudmila I V ostrikova. Detection of the disorder in multidimensional random-processes. Doklady Akademii Nauk SSSR, 259(2):270–274, 1981
1981
-
[32]
Maximum likelihood estimation of misspecified models
Halbert White. Maximum likelihood estimation of misspecified models. Econometrica: Journal of the Econometric Society, pages 1–25, 1982
1982
-
[33]
: Change analysis of dynamic copula for measuring dependence in multivariate financial data
Jing Zhang and Dominique Guégan. : Change analysis of dynamic copula for measuring dependence in multivariate financial data. 2006. 27
2006
Reviewed August 14, 2026 · model on record in the stance chip above.
Discussion (0). Continue with ORCID to comment.