REVIEW 4 major objections 6 minor 26 references
Detecting individual internal displacements following a sudden-onset disaster using time series analysis of call detail records
T0 review · 4 major / 6 minor · reviewed 2026-08-14 · deepseek-v4-flash
Pith's one-line read Internally displaced people can be identified from mobile phone records by detecting a level shift in each caller's daily distance-to-reference time series.
desk verdict A useful individual-level CDR displacement method, but the left-window rolling median delays every detected step by ~3 days and the seven-day threshold is post hoc, so validation is needed before the counts are trusted. read the letter →
The pith
A machine-rendered reading of the paper's core claim, the machinery that carries it, and where it could break.
The reading
What carries the argument
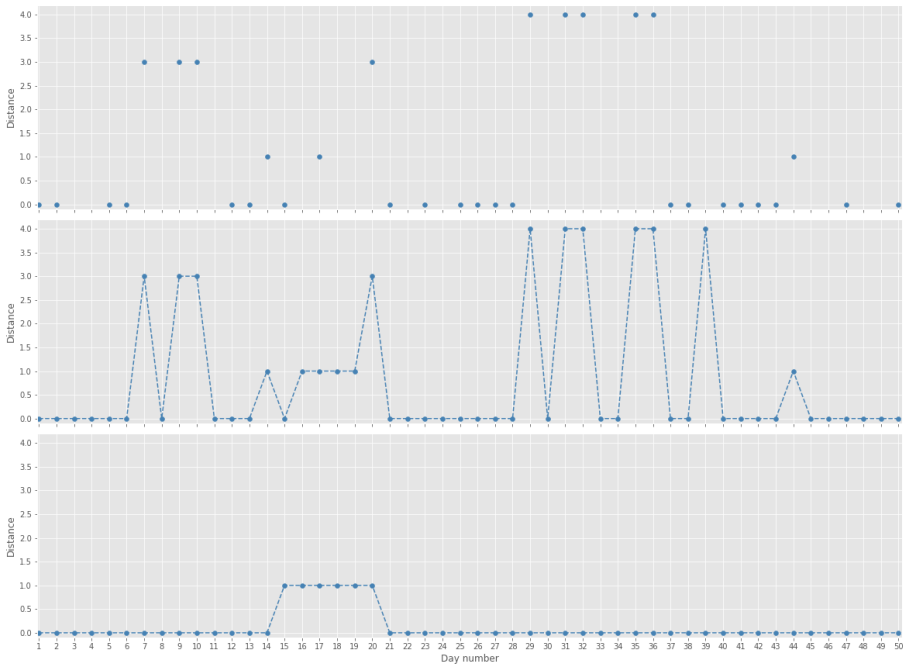
The central machinery is the distance curve: the daily geodesic distance from a subscriber's pre-disaster reference location, treated as a piecewise-constant signal. Spatial clustering of nearby cell towers removes oscillation noise, an iterative median filter with a seven-day window smooths the curve into constant pieces while preserving sharp edges, and the step detection rule that a level shift occurs when the first difference of the filtered curve moves from zero to nonzero extracts the times of stay-location changes. This reduction turns a messy two-dimensional trajectory into a one-dimensional signal in which displacement is a single detectable edge.
What would settle it
Run the identical filtering and step detection on a pre-disaster control period of equal length in the Haiti dataset and count how many subscribers show a step in a randomly chosen seven-day 'disaster' window; if that number is of the same order as the 37,839 flagged after the earthquake, the step rule is detecting ordinary mobility rather than displacement.
Extended reading notes
Core claim
The paper's central claim is that disaster-induced internal displacement appears as a level shift in a piecewise-constant time series of an individual's distance to their pre-disaster 'reference location.' After filtering to frequent callers, clustering nearby cell towers, imputing missing days with rolling medians, and applying an iterative median filter with a seven-day window, the distance curve becomes a piecewise-constant signal. A step is declared at time $t$ when $\mathrm{diff}(t-1)=0$ and $\mathrm{diff}(t)\neq 0$, meaning the distance changes abruptly from one constant level to another. Subscribers whose reference location lies in an affected region and who show such a step in the week after the disaster, with at least three days at the reference location in the prior week, are labeled internally displaced persons. The paper applies this to the 2010 Haiti earthquake, the 2015 Gorkha earthquake, and Hurricane Matthew in 2016, and finds the regional distribution of flagged IDPs aligns with reported severity.
Load-bearing premise
The whole pipeline rests on the assumption that after clustering, imputation, and median filtering, a level shift in the distance curve really represents a person physically changing their stay location, rather than an artifact of missing days, tower outages, or the filter itself.
Editorial extensions
If this is right
- Humanitarian responders can estimate the number and geographic origin of displaced people within weeks of a disaster, using data already collected for billing.
- Short-distance displacements, under a few kilometres, that vanish in aggregate origin-destination studies become visible at the individual level.
- Because no assumptions about destination or duration are needed, the method captures people who stay with relatives or in rented housing, not only those in formal camps.
- The flagged IDP subset can be linked back to sequences of stay locations, enabling longitudinal studies of onward and secondary displacement.
- The method transfers to other spatio-temporal datasets with a similar one-dimensional structure, a possibility the paper explicitly leaves open.
Reading between the lines
- If the step rule is valid, the same logic could date displacement onset more precisely than a one-week window, detecting secondary moves as repeated level shifts in the same subscriber's signal.
- The method could be stress-tested by applying it to a control period with no disaster: a similar rate of flagged 'displacement' steps would imply the rule is capturing ordinary mobility, not disaster response.
- The purity-focused filtering implies the flagged set is a censored sample, so any downstream estimate of total displacement would need adjustment for the known false-negative rate, a step the paper leaves to later work.
- Because the distance curve collapses two-dimensional space to a scalar distance, two different destinations at the same distance are indistinguishable; adding directional information could separate moves toward or away from an epicenter or coastline.
Signed reviews
Editorial analysis
A structured set of objections, weighed in public.
Referee Report
Summary. The paper proposes a method to identify internally displaced persons (IDPs) from call detail records after sudden-onset disasters. For each subscriber, the authors construct a daily 'distance curve' to a pre-disaster reference location, impute missing days, smooth the series with an iterative median filter, detect level shifts (steps) in the filtered signal, and then apply heuristic criteria to label individuals as IDPs. The method is applied to CDR data from the 2010 Haiti earthquake, the 2015 Nepal earthquake, and Hurricane Matthew in Haiti (2016). The paper reports the resulting IDP counts, spatiotemporal patterns of steps, regional distributions, and displacement distances, and it argues that the detected level shifts correspond to disaster-induced displacements.
Significance. The humanitarian application is important, and an individual-level trajectory method that can detect short-distance displacements would complement existing aggregate CDR studies and survey-based methods. The paper is clearly written and candid about several limitations, including the absence of false-positive/false-negative estimates and the post hoc choice of the seven-day post-disaster window. However, the central claim—that the detected level shifts actually mark disaster-induced displacements—is not validated against any ground-truth displacement data, and the signal-processing chain introduces a systematic timing error that biases the reported step dates. If the pipeline were corrected and externally validated, the method could be a valuable tool; as presented, the results in Tables 6 and 10 and Figures 3–5 cannot be interpreted as reliable IDP estimates.
major comments (4)
- [Section 3.7, step 1; Section 3.8; Section 3.9] The use of a left-window rolling median with n=7 shifts every level shift in the distance curve by approximately three days. For a jump from 0 to C at time t0, the rolling median remains 0 on t0, t0+1, and t0+2 and only becomes C at t0+3; the step rule in Section 3.9 then timestamps the event three days late. Consequently, the 'week after disaster' criterion in Section 3.10 is effectively a ten-day window for true displacements, and displacements lasting four days or fewer are erased before step detection. This delay propagates into the IDP counts in Table 6, the step-date curves in Figure 3, and the displacement distances in Figure 5, so the paper's central claim that detected level shifts mark disaster-induced displacement is not supported unless the lag is measured and corrected, for example with a synthetic benchmark or a centered window.
- [Section 3.10, criterion 1] The seven-day post-disaster window is chosen after examining the step-frequency figures in Section 4.1. Because the same data are used both to select the rule and to report the result, the observed concentration of IDP steps within the chosen window is partially an artifact of the selection. The text acknowledges this, but it remains a circularity. The lag described in the previous comment compounds the problem, since the 'anomalous week' visible in Figure 3 is itself shifted by the filter. The authors should justify the window independently, for instance from an out-of-sample disaster or from a pre-specified definition, or demonstrate that the qualitative conclusions are insensitive to the window length.
- [Section 4.2 (Tables 7–9, Figure 4); Section 6] The only empirical check of the IDP classification is a spatial correlation with reported affected regions. No ground-truth IDP data, survey-based displacement estimates, or independent IDP totals are used to compute precision, recall, or any error rate. The paper itself states in Section 6 that follow-up studies are needed to estimate true/false positive and negative rates. Without such validation, the counts in Tables 6 and 10 cannot be interpreted as estimates of displacement; at most they are the output of an unvalidated filter. The authors should add at least one external comparison, for example with IOM displacement-site records, survey estimates, or the earlier Haiti CDR study in reference [6], or explicitly reposition the paper as a method proposal with validation deferred to later work.
- [Footnote to Section 3.10, criterion 1] The acknowledged processing error—implementing 'at least two call days away from the reference location' as 'two calls'—means the criterion can be satisfied by two calls made on the same day, weakening the intended assurance that the individual was away for longer than a single day. The authors should either correct the implementation and rerun the pipeline or quantify how many identified IDPs depend on this distinction.
minor comments (6)
- [Abstract] The first sentence reads 'whom we believe to be have been internally displaced'; the phrase 'to be have been' is a typo and should read 'to have been'.
- [Table 2] The listed pre- and post-disaster durations do not appear to add up to the stated study periods; for Haiti, 42 plus 182 days is 224 days, while the start and end dates span only about 196 days. Please clarify whether the durations include the disaster day and how the end dates are determined.
- [Section 3.2.2] The threshold for the median number of call days per week is said to be 'determined by looking at the distribution', but the actual cut-off values used for each dataset are not reported; please state them for reproducibility.
- [Section 3.8] The statement that the iterative median filter removes trips of less than (n+1)/2 days means that with n=7, trips shorter than four days are removed; this should be reconciled with the three-day minimum stay criterion in Section 3.10, since the filter may erase exactly the short displacements the criterion is meant to retain.
- [Section 3.4] The random tie-breaking for the modal reference location is described as 'relatively unimportant', but for subscribers with near-equal time at two locations in the pre-disaster period, the choice could affect whether a post-disaster step is detected; a sensitivity check would strengthen the claim.
- [Figure 3] The explanation of the sharp drop followed by a peak in the Haiti panel refers to cell towers being out of service; marking the non-operational tower days directly on the plot would make the effect easier to verify.
Circularity Check
The IDP selection rule fixes the post-disaster detection window from the same step-count curves that are then reported as evidence, so the claimed disaster-week mobility peak is partly a restatement of the selection rule.
-
fitted input called prediction
[Section 3.10, criterion 1 (p. 14); Section 4.1, Figure 3]
"Individuals have a step in the week immediately following the disaster. This seven-day threshold was chosen after examining the figures in Section 4.1, which show that an anomalously high amount of movement (number of steps) occurs in roughly the week following the disaster, and then returns to normal."
The seven-day window is not fixed a priori; it is selected by inspecting the same step-count data that Section 4.1 then presents as the main behavioural result. Because an IDP is defined as someone with a step in exactly that window, the statement in Section 4.1 that there is a sharp and obvious increase in mobility during the disaster period for the IDP group is at least partly guaranteed by construction: every member of the IDP group was required to step within that week. The peak in the IDP curve in Figure 3 is inherited from the selection rule rather than being an independent finding about displaced persons, and the reported anomaly is a consequence of choosing the window after seeing the data.
-
self definitional
[Section 4.1, p. 16]
"As expected, there is a sharp and obvious increase in mobility during the disaster period for the IDP group, whereas there is a slight decrease for the non-IDP group."
The IDP group was defined in Section 3.10 criterion 1 as containing only individuals who have a step in the week immediately following the disaster. Therefore an increase in mobility during the disaster period for this group is substantially entailed by the definition of the group, independent of any actual IDP behaviour. The contrast with the non-IDP group is also partly built in, because the non-IDP group is the complement, consisting of subscribers without a qualifying step in that window.
full rationale
The paper is transparent about its processing chain and does not rely on load-bearing self-citations or imported uniqueness theorems; the step-detection rule and the distance-curve construction are operational definitions rather than hidden equivalences. The main circularity is the ex-post selection of the seven-day post-disaster window from the same data that is then used to characterize IDPs, combined with defining IDPs by exactly that window. Consequently, the headline behavioural result that IDPs move anomalously in the week after the disaster is at least partly a restatement of the selection rule. The regional verification and displacement-distance distributions provide some independent content, which prevents a higher score, but they do not remove the built-in nature of the weekly peak.
Assumptions & free parameters
free parameters (8)
- Spatial clustering threshold (Haiti/Matthew: 1 km; Nepal: 1.5 km) =
1 km / 1.5 km
- Median filter window length n =
7 days
- Post-disaster step detection window =
7 days
- Minimum stay duration after a step =
3 days
- Minimum call days at reference location in pre-disaster week =
3 days
- Minimum fraction of pre-disaster time at reference location =
>0.5
- Median call days per week threshold =
Not reported
- At least two call days away from reference during disaster week =
Implemented as two calls due to processing error
assumptions (5)
- domain assumption One SIM card corresponds to one individual.
- domain assumption The modal location in the pre-disaster period is a stable and meaningful 'normal' reference location.
- domain assumption The daily minimum distance to the reference location, imputed with rolling medians and forward filling, and then iteratively median filtered, preserves genuine level shifts while removing noise.
- domain assumption Cell tower location is a reasonable proxy for subscriber location, and for the Haiti dataset the first-call-of-day location is a good indicator of home location.
- standard math Standard algorithms (agglomerative hierarchical clustering, median filter convergence, step detection) work as documented in scipy and the cited reference [26].
Cite this review
Pith. "Pith review of Detecting individual internal displacements following a sudden-onset disaster using time series analysis of call detail records." pith.science (2026). https://pith.science/paper/3WTPC4ZK
@misc{pith2026190802377,
  author       = {Pith},
  title        = {Pith review of: Detecting individual internal displacements following a sudden-onset disaster using time series analysis of call detail records},
  year         = {2026},
  howpublished = {\url{https://pith.science/paper/3WTPC4ZK}},
  note         = {Machine review of arXiv:1908.02377}
}
read the original abstract
We present a method for analysing mobile phone call detail records to identify individuals whom we believe to be have been internally displaced as a result of a sudden-onset disaster. We model each anonymous individual's movements trajectory as a piecewise-constant time series signal, assume that a disaster-induced displacement is exhibited as a level shift from an individual's 'normal' location, and then apply a step detection algorithm to identify level shifts in the signal. In contrast to typical methods that are used to analyse mobility patterns from call detail records, where the aggregate movements of large groups of individuals are analysed, our method offers the advantage that no assumptions regarding the destination or duration of an individual's displacement are necessary. We have applied the method to the datasets from three disasters - the 2010 earthquake in Haiti, the 2015 Gorkha earthquake in Nepal, and Hurricane Matthew in Haiti in 2016. Our results demonstrate that this method can facilitate improvements in the analysis and modelling of the mobility of internally displaced persons in post-disaster scenarios, using call detail records. Such analyses can be used to complement traditional survey methods to assess the scale and characteristics of disaster-induced displacements in a timely manner.
Figures


Figures from the paper (2 more)


Reference graph
Works this paper leans on
-
[6]
Predictability of population displacement after the 2010 haiti earthquake
Xin Lu, Linus Bengtsson, and Petter Holme. Predictability of population displacement after the 2010 haiti earthquake. Proceedings of the National Academy of Sciences, 109(29):11576–11581, 2012
2010
-
[1]
https://www.unhcr.org/uk/figures-at-a-glance.html
UNHCR website, 2019. https://www.unhcr.org/uk/figures-at-a-glance.html
2019
-
[2]
Iom framework for addressing internal displacement, 2017
International Organization for Migration. Iom framework for addressing internal displacement, 2017. https://tinyurl.com/y4pfag74
work page 2017
-
[3]
Global protection cluster retreat - idps outside of camps, Feb 2012
UNHCR Yemen Erin Mooney. Global protection cluster retreat - idps outside of camps, Feb 2012. https://www.refworld.org/pdfid/4f4f42f92.pdf
2012
-
[4]
Global report on internal displacement, 2017
Internal Displacement Monitoring Centre. Global report on internal displacement, 2017. http://www.internal- displacement.org/global-report/grid2017/
work page 2017
-
[5]
Improved response to disasters and outbreaks by tracking population movements with mobile phone network data: a post-earthquake geospatial study in haiti
Linus Bengtsson, Xin Lu, Anna Thorson, Richard Garfield, and Johan V on Schreeb. Improved response to disasters and outbreaks by tracking population movements with mobile phone network data: a post-earthquake geospatial study in haiti. PLoS medicine, 8(8):e1001083, 2011
2011
-
[7]
Robin Wilson, Elisabeth zu Erbach-Schoenberg, Maximilian Albert, Daniel Power, Simon Tudge, Miguel Gonzalez, Sam Guthrie, Heather Chamberlain, Christopher Brooks, Christopher Hughes, et al. Rapid and near real-time assessments of population displacement using mobile phone data following disasters: the 2015 nepal earthquake. PLoS currents, 8, 2016
work page 2015
-
[8]
The mobile economy 2017, 2017
GSM Association. The mobile economy 2017, 2017. https://tinyurl.com/y8txral8
2017
Show all 26 references
-
[9]
Collective response of human populations to large-scale emergencies
James P Bagrow, Dashun Wang, and Albert-Laszlo Barabasi. Collective response of human populations to large-scale emergencies. PloS one, 6(3):e17680, 2011
2011
-
[10]
Understanding individual human mobility patterns
Marta C Gonzalez, Cesar A Hidalgo, and Albert-Laszlo Barabasi. Understanding individual human mobility patterns. nature, 453(7196):779, 2008
2008
-
[11]
Limits of predictability in human mobility
Chaoming Song, Zehui Qu, Nicholas Blumm, and Albert-László Barabási. Limits of predictability in human mobility. Science, 327(5968):1018–1021, 2010
2010
-
[12]
Preliminary earthquake report, 2010
United States Geological Survey. Preliminary earthquake report, 2010. https://tinyurl.com/yydp4gxe
2010
-
[13]
Mortality, crime and access to basic needs before and after the haiti earthquake: a random survey of port-au-prince households
Athena R Kolbe, Royce A Hutson, Harry Shannon, Eileen Trzcinski, Bart Miles, Naomi Levitz, Marie Puccio, Leah James, Jean Roger Noel, and Robert Muggah. Mortality, crime and access to basic needs before and after the haiti earthquake: a random survey of port-au-prince househol...
2010
-
[14]
Preliminary earthquake hazards program, 2015
United States Geological Survey. Preliminary earthquake hazards program, 2015. https://earthquake.usgs.gov/earthquakes/eventpage/us20002926/executive. 23
2015
-
[15]
Nepal: Earthquake 2015 situation report no.20 (as of 3 june 2015), May 2015
UN Resident UN Office for the Coordination of Humanitarian Affairs and Humanitarian Coordina- tor for Nepal. Nepal: Earthquake 2015 situation report no.20 (as of 3 june 2015), May 2015. https://reliefweb.int/report/nepal/nepal-earthquake-2015-situation-report-no20-3-june-2015
2015
-
[16]
Nepal earthquakes: Devastation in maps and images, May 2015
BBC. Nepal earthquakes: Devastation in maps and images, May 2015. https://www.bbc.co.uk/news/world-asia- 32479909
2015
-
[17]
Haiti situation report 4, Oct 2016
UNICEF. Haiti situation report 4, Oct 2016. https://tinyurl.com/y5mlw77j
2016
-
[18]
Haiti - situation report - 18 october 2016, Oct 2016
Food and Agriculture Organization of the United Nations. Haiti - situation report - 18 october 2016, Oct 2016. https://reliefweb.int/report/haiti/haiti-situation-report-18-october-2016
2016
-
[19]
Trajectory data mining: an overview
Yu Zheng. Trajectory data mining: an overview. ACM Transactions on Intelligent Systems and Technology (TIST), 6(3):29, 2015
2015
-
[20]
Novelty detection in time series data using ideas from immunology
Dipankar Dasgupta and Stephanie Forrest. Novelty detection in time series data using ideas from immunology. In Proceedings of the international conference on intelligent systems, pages 82–87, 1996
1996
-
[21]
Event detection from time series data
Valery Guralnik and Jaideep Srivastava. Event detection from time series data. In Proceedings of the fifth ACM SIGKDD international conference on Knowledge discovery and data mining, pages 33–42. ACM, 1999
1999
-
[22]
Change-point detection in time-series data by relative density-ratio estimation
Song Liu, Makoto Yamada, Nigel Collier, and Masashi Sugiyama. Change-point detection in time-series data by relative density-ratio estimation. Neural Networks, 43:72–83, 2013
2013
-
[23]
Internal document
Statistics Netherlands, 2018. Internal document
2018
-
[24]
Uncovering individual and collective human dynamics from mobile phone records
Julián Candia, Marta C González, Pu Wang, Timothy Schoenharl, Greg Madey, and Albert-László Barabási. Uncovering individual and collective human dynamics from mobile phone records. Journal of physics A: mathematical and theoretical, 41(22):224015, 2008
2008
-
[25]
Understanding individual mobility patterns from urban sensing data: A mobile phone trace example
Francesco Calabrese, Mi Diao, Giusy Di Lorenzo, Joseph Ferreira Jr, and Carlo Ratti. Understanding individual mobility patterns from urban sensing data: A mobile phone trace example. Transportation research part C: emerging technologies, 26:301–313, 2013
2013
-
[26]
Generalized methods and solvers for noise removal from piecewise constant signals
Max A Little and Nick S Jones. Generalized methods and solvers for noise removal from piecewise constant signals. i. background theory. Proceedings of the Royal Society A: Mathematical, Physical and Engineering Sciences, 467(2135):3088–3114, 2011. A Iterative median filter The ...
2011
Reviewed August 14, 2026 · model on record in the stance chip above.
Discussion (0). Continue with ORCID to comment.