REVIEW 4 major objections 10 minor 56 references
A Statistical Study of Solar Filament Eruptions That Forms High-Speed Coronal Mass Ejections
T0 review · 4 major / 10 minor · reviewed 2026-08-14 · deepseek-v4-flash
Pith's one-line read Fast coronal mass ejections from active-region filaments are usually triggered by magnetic reconnection, while quiet-Sun ones are triggered by ideal-MHD instabilities.
desk verdict A useful but statistically soft survey of fast filament-CME triggers; the type–mechanism correlations are plausible, but the classification needs robustness testing before the percentages are trusted. read the letter →
The pith
A machine-rendered reading of the paper's core claim, the machinery that carries it, and where it could break.
The reading
What carries the argument
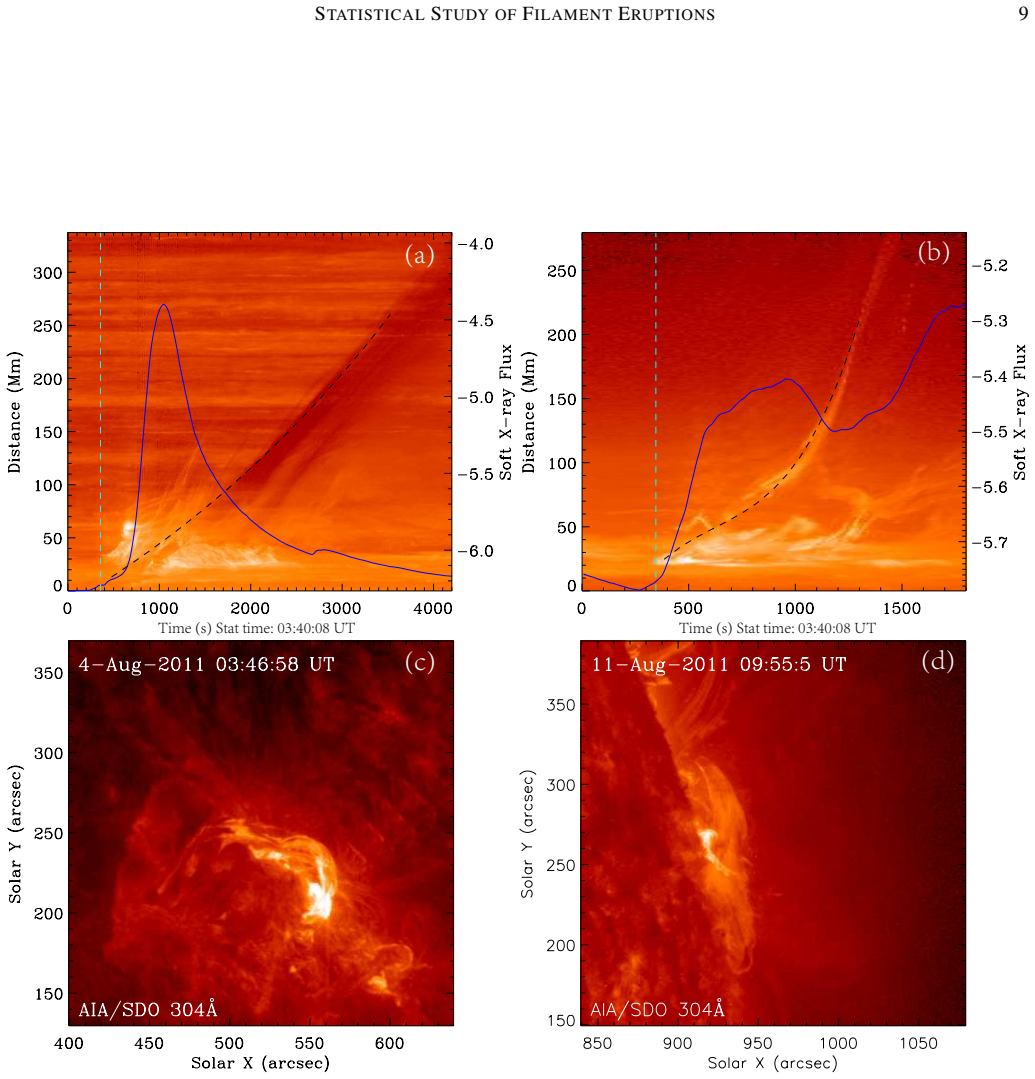
The central diagnostic is the temporal order of three observables: the onset of the filament's fast-rise phase, the rise of GOES soft X-ray flux, and the appearance of flare ribbons. The fast-rise onset is defined by fitting the height-time profile to the two-phase curve $h(t) = c_0 e^{(t-t_0)/\tau} + c_1(t-t_0) + c_2$; reconnection-triggered events show X-ray rise and ribbons before or at that onset, while ideal-MHD events show them after. Ambiguous events are then adjudicated by computing the decay index $n = -\mathrm{d}\ln B/\mathrm{d}\ln h$ of the overlying magnetic field at the onset height, from PFSS extrapolations, and comparing it with the torus-instability threshold.
What would settle it
Recalculate the decay index at each measured onset height from vector magnetic field extrapolations instead of the potential-field model: if most quiet-Sun events classified as ideal-MHD-triggered sit below the torus-instability threshold, or if an independent blinded classification of the same movies assigns different trigger types to more than a few events, the paper's central correlation would be refuted.
Extended reading notes
Core claim
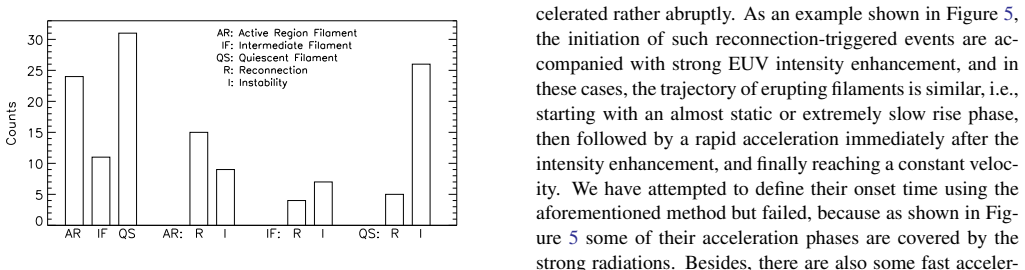
The paper's central claim is that the trigger mechanism of a fast CME's filament eruption is not uniform across the solar surface: 62.5% of active-region filament eruptions that produce CMEs above 800 km/s begin with reconnection signatures, namely a soft X-ray rise and newly formed flare ribbons before the fast-rise phase, whereas only 16.1% of quiet-Sun filaments do so, with most quiet-Sun and intermediate filaments following ideal-MHD paths. The trigger type does not govern final speed: average speeds are statistically similar for reconnection- versus ideal-MHD-triggered events within the active-region and intermediate sets once outliers are excluded, but quiet-Sun ideal-MHD events average 932 km/s versus 844 km/s for reconnection-triggered ones. The survey also reports that active-region and intermediate filaments erupt at decay indices closer to the theoretical torus-instability threshold than earlier statistics suggested, while quiet-Sun eruptions start higher in the corona.
Load-bearing premise
The classifications assume that when a filament's sudden acceleration is preceded by an X-ray brightening and newly formed flare ribbons, the brightening is what triggers the eruption; in reality the brightening often coincides with onset and could be a side effect or merely the process that built the unstable structure.
Editorial extensions
If this is right
- Space-weather forecasting of active-region filament eruptions should prioritize reconnection precursors such as emerging flux and pre-eruptive brightenings, since most fast CMEs from active-region filaments begin that way.
- For quiet-Sun and intermediate filaments, the overlying magnetic-field environment and its instability threshold matter more than reconnection precursors, because those eruptions are mostly ideal-MHD-triggered.
- Trigger mechanism alone cannot predict whether a filament eruption will produce a very fast CME: within active-region and intermediate filaments, reconnection- and ideal-MHD-triggered events reach similar average speeds.
- Quiet-Sun regions cannot be ignored in fast-CME forecasting: roughly half of the fast CMEs in the sample came from quiet-Sun filaments, and ideal-MHD-triggered quiet-Sun events are on average faster than reconnection-triggered ones.
- The absence of polar-crown filaments among the 66 fast CMEs suggests that high-latitude weak-field regions are unlikely to produce fast CMEs, so forecasting attention can concentrate on lower latitudes.
Reading between the lines
- Extension: applying the same trigger dichotomy to slower CMEs would test whether the 800 km/s cutoff is meaningful; if trigger type truly does not set final speed, the distribution of trigger types should be similar in slower filament eruptions.
- Extension: the five quiet-Sun reconnection-triggered events cluster near small poles or are driven by a distant X-class flare, suggesting that an unusually strong external driver is needed for reconnection to produce a fast CME in a weak-field environment; this could be tested with a larger sample.
- Extension: because the decay index is computed from a potential-field extrapolation, recalculating it with non-potential extrapolations would test whether the active-region and intermediate decay indices stay above the torus threshold; if they drop below it, the comparison to torus-instability theory would need revision.
Signed reviews
Editorial analysis
A structured set of objections, weighed in public.
Referee Report
Summary. This paper presents a statistical analysis of 66 filament-associated coronal mass ejections (CMEs) with speeds above 800 km/s, drawn from HEK and observed with SDO, GONG, STEREO, and GOES between 2011 and 2017. The authors classify events by filament type (active-region, intermediate, quiet-Sun; no polar-crown events satisfied the speed threshold) and by trigger mechanism (magnetic reconnection versus ideal MHD instability), using the timing of the soft X-ray rise and the appearance of flare ribbons relative to the eruption onset time. Time-distance fits to the filament rise provide onset times, from which onset heights and PFSS-derived decay indices are obtained. The main claims are that AR filament eruptions are preferentially reconnection-triggered (62.5%) whereas quiet-Sun and intermediate filaments are mostly triggered by ideal MHD processes; that the trigger mechanism does not significantly affect the CME speed except for quiet-Sun events, where ideal MHD gives faster CMEs; and that onset heights and decay indices differ from previous work (McCauley et al. 2015).
Significance. If the type–mechanism correlations are correct, the paper would provide one of the first systematic links between filament type, eruption trigger, and the speed of the resulting CME, with direct relevance for space-weather forecasting. The compilation of 66 events with onset heights and decay indices is a useful observational resource, and the paper is careful to state several caveats, including the large uncertainties in onset heights and decay indices. The main quantitative results, however, depend on a subjective and partially circular trigger classification and on very small subgroups, so the strength of the conclusions currently exceeds what the data can support.
major comments (4)
- [§2.4; Table 1] The trigger classification is not a reproducible rule. The text states that for reconnection-triggered events the soft X-ray flux rise should appear 'just ahead' of the eruption onset, but Table 1 contains events that violate this temporal rule: 2012-01-27 (FOT 17:37 precedes OT 17:44, classified NR) and 2012-01-23 (OT 03:37:56 precedes FOT 03:38, classified R). The footnotes explain each exception, but the existence of exceptions shows that the actual decision rule is more complex and unstated, involving also kink motion, ribbon observations, and subjective judgment. Please provide an explicit decision tree or quantitative criteria, and demonstrate the sensitivity of the headline percentages (62.5% AR/R, 16.1% QS/R) to plausible variations of the rule. As a related point, the event 2014-04-18 is classified R despite footnote f stating that it is unclear whether the soft X-ray rise is from this eruption or a previous flare, further illustrating the manual character of the decision.
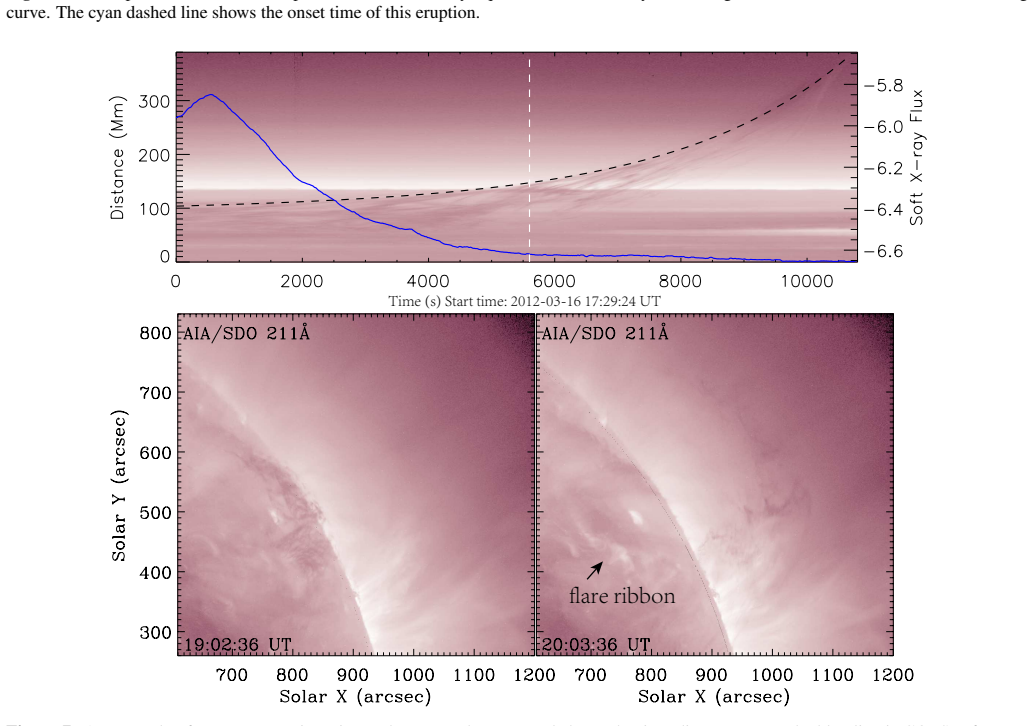
- [§2.2 and §2.4] For roughly one third of the events, Eq. (1) cannot be fitted and the eruption onset time is set equal to the beginning of the intensity enhancement, i.e., the onset time of the associated flare reconnection. For these events the criterion 'soft X-ray rise before or at onset' is not an independent test of the trigger mechanism; the classification is built into the definition of the onset time. The paper does not report how many of the 66 events fall into this category, nor how they are distributed across filament types and mechanisms. This omission is load-bearing because it affects the central type–mechanism correlations. Please report these numbers and re-run the statistics with these events excluded or with an independent onset-time definition.
- [§2.4 and Table 4] The decay index is used in §2.4 as a tie-breaker for ambiguous events ('the events for which the onset heights are far below the torus instability threshold are not likely triggered by torus instability'), and the same decay index is later analysed in Table 4, where the authors report that reconnection-triggered events have lower minimum decay indices than non-reconnection events (0.4 versus >1). If the decay index influenced the classification, this pattern is to some degree manufactured. The analysis should separate the classification evidence from the quantity under study: classify ambiguous events using only timing and ribbon information, and then compute decay indices without using them in the classification, or alternatively present the Table 4 results after excluding all events for which the decay index was consulted in the classification.
- [Table 3 and §3] The quantitative claims are not supported by significance tests. The statement that QS filaments triggered by ideal MHD produce faster CMEs (932.04 versus 843.60 km/s) rests on n=26 versus n=5 with standard errors of 26.83 and 21.15; without a test (e.g., two-sample t-test or Mann-Whitney) the difference may be within sampling variation. The percentages for trigger mechanisms (62.5% of AR, 16.1% of QS) are also quoted without binomial confidence intervals. Please add formal tests and confidence intervals to Table 3 and to the percentages reported in §3, and adjust the wording of the conclusions (including the word 'obviously' on the QS speed difference) to match the statistical support.
minor comments (10)
- [Title] The title should read '... That Form High-Speed Coronal Mass Ejections' rather than '... That Forms High-Speed ...'.
- [Section 1] There are typographical errors: 'rougly' should be 'roughly', and 'idea MHD' should be 'ideal MHD'.
- [Section 2.4] The word 'magetic' should be 'magnetic'.
- [Table 2] The table header 'Continued of Table 1' should be 'Continued from Table 1'.
- [Section 3] The text reports average CME velocities of 1046.42 km/s for C-class flares and 956.08 km/s for B-class and below, but Table 3 lists 1057.65 and 955.18; these numbers should be reconciled.
- [Section 3] The statement 'the probability of polar crown filament eruptions is zero in our statistic' should be rephrased; the absence of PC events in 66 selected fast CMEs does not measure the probability of PC filaments producing fast CMEs.
- [Figures] Several figure captions appear garbled (e.g., Figure 3 top panel shows '5JNF' and 'T'; Figure 7 top panel shows 'GMBSF SJCCPO'), indicating a PDF conversion or font problem; the production files should be checked.
- [Section 2.3] The decay index is computed from GONG magnetograms taken days before or after the eruption; the authors mention this uncertainty in §3 but it could be stated in §2.3 alongside the method.
- [References] The citation 'Tsurutani et al. 1988' in the Introduction does not match the reference list entry 'Tsurutani et al. 2014'; similarly, 'Gonzalez et al. 1999' is listed as 'Gonzalez et al. 1992'. Please correct the citations.
- [Equation (1)] Consider defining the units and sign conventions for the free parameters c0, c1, c2, t0, and τ, and state explicitly that h(t) is the filament height as a function of time.
Circularity Check
No significant circularity: the survey's classifications rest on external data and standard fitting, with acknowledged trigger-diagnostic caveats that are robustness concerns rather than built-in reductions.
full rationale
The paper is an observational statistical survey of 66 filament-associated fast CMEs. The quantities that drive the results—filament type from HEK, CME speed from external CME catalogs, GOES X-ray timing, SDO/AIA and STEREO morphology, GONG PFSS decay indices—are external to the conclusions, and no load-bearing argument rests on a self-citation by the present authors. The one internal fitting step, Eq. (1)-(2), defines the operational onset time from the two-phase height evolution; it feeds only the secondary quantities onset height and decay index, which are then compared with the independent McCauley et al. (2015) statistics, so no headline correlation is a renamed fit of its own input. The trigger classification in Sec. 2.4 uses the relative timing of the GOES soft X-ray rise and ribbon formation with respect to the fast-rise onset, supplemented by magnetic-environment checks, and the paper explicitly concedes the diagnostic's uncertainty ('it is still hard to say which mechanism is the trigger as the signatures of reconnection often coincides very closely to the onset of fast rising phase') and the special definition of onset for unfittable events in Sec. 2.2. Those concessions are robustness caveats, not circular reductions: the type–mechanism and speed correlations are not entailed by the definitions, and no fitted parameter is repackaged as a prediction. Therefore the appropriate circularity score is 0.
Assumptions & free parameters
free parameters (1)
- Per-event time-distance fit parameters c0, c1, c2, t0, tau in Eq. (1) =
Not reported in paper
assumptions (5)
- domain assumption A filament eruption can be classified as reconnection-triggered if GOES soft X-ray flux increases and flare ribbons appear just before the fast-rise onset.
- domain assumption PFSS extrapolation from GONG photospheric magnetograms adequately represents the coronal field for computing the decay index.
- ad hoc to paper For events without a two-phase trajectory, the eruption onset time can be set equal to the flare reconnection onset.
- domain assumption The torus instability threshold (decay index near 1.5) from Kliem and Török (2006) applies to these observed flux ropes.
- domain assumption The 66-event sample restricted to visible-disk fast CMEs is representative for type-frequency and mechanism-frequency statements.
Cite this review
Pith. "Pith review of A Statistical Study of Solar Filament Eruptions That Forms High-Speed Coronal Mass Ejections." pith.science (2026). https://pith.science/paper/3XA2KFVJ
@misc{pith2026190808650,
  author       = {Pith},
  title        = {Pith review of: A Statistical Study of Solar Filament Eruptions That Forms High-Speed Coronal Mass Ejections},
  year         = {2026},
  howpublished = {\url{https://pith.science/paper/3XA2KFVJ}},
  note         = {Machine review of arXiv:1908.08650}
}
abstract
Coronal mass ejections (CMEs) play a decisive role in driving space weather, especially, the fast ones (e.g., with speeds above $800$~km~s$^{-1}$). Understanding the trigger mechanisms of fast CMEs can help us gaining important information in forecasting them. The filament eruptions accompanied with CMEs provide a good tracer in studying the early evolution of CMEs. Here we surveyed 66 filament-accompanied fast CMEs to analyse the correlation between the trigger mechanisms, namely either magnetic reconnection or ideal MHD process, associated flares, and CME speeds. Based on the data gathering from SDO, GONG and STEREO, we find that: (1) Active region (AR) filament and intermediate filaments (IFs) eruptions show a higher probability for producing fast CMEs than quiet Sun (QS) filaments, while the probability of polar crown (PC) filament eruptions is zero in our statistic; (2) AR filament eruptions that produce fast CMEs are more likely triggered by magnetic reconnection, while QS and IFs are more likely triggered by ideal MHD process; (3) For AR filaments and IFs, it seems that the specific trigger mechanism does not have a significant influence on the resulted CME speeds, while for the QS filaments, the ideal MHD mechanism can more likely generate a faster CME; (4) Comparing with previous statistic study, the onset heights of filament eruptions and the decay indexes of the overlying field show some differences: for AR filaments and IFs, the decay indexes are larger and much closer to the theoretical threshold, while for QS filaments, the onset heights are higher than those obtained in previous results.
Figures


Figures from the paper (6 more)




Reference graph
Works this paper leans on
-
[1]
Antiochos, S. K., DeV ore, C. R. & Klimchuk, J. A. 1999, ApJ, 510, 485
work page 1999
-
[2]
Aulanier, G., To¨rök, T., Demoulin, P. & DeLuca, E. E. 2010, ApJ, 708, 314
work page 2010
- [3]
-
[4]
Chen, P. F. & Shibata, K. 2000, ApJ, 545, 524
work page 2000
-
[5]
Cheng, X., Zhang, J., Ding, M. D., Olmedo, O., Sun, X. D., Guo, Y . & Liu, Y . 2013, ApJL, 769, L25
work page 2013
-
[6]
2015, Description and classification of prominences
Engvold, O. 2015, Description and classification of prominences. In: Vial, J.-C., Engvold, O. (eds.) Solar Prominences, Astrophys. Space Sci. Lib., 415, 31
work page 2015
- [7]
-
[8]
P., van Driel-Gesztelyi, L., Harra, L
Goff, C. P., van Driel-Gesztelyi, L., Harra, L. K., Matthews, S. A. & Mandrini, C. H. 2005, A&A, 434, 761
work page 2005
Show all 56 references
-
[9]
D., Tsurutani, B
Gonzalez, W. D., Tsurutani, B. T. & Clua de Gonzalez, A. L. 1992, Space Sci. Rev., 88, 529
1992
-
[10]
& Kundu, M
Gopalswamy, N. & Kundu, M. R. 1992, ApJL, 390, 37
1992
-
[11]
& Howard, R
Gopalswamy, N., Lara, A., Yashiro, S., Nunes, S. & Howard, R. A. 2003, in Solar V ariability as an Input to the Earth’s
2003
-
[12]
Harrison, R. A. 1995, A&A, 304, 585
1995
-
[13]
W., Bolding, J., Clark, R., et al
Harvey, J. W., Bolding, J., Clark, R., et al. 2011, BAAS, 42, 17.45
2011
-
[14]
A., Moses, J
Howard, R. A., Moses, J. D., V ourlidas, A., et al. 2008, Space Sci. Rev., 136, 67
2008
-
[15]
S., Acton, L
Hudson, H. S., Acton, L. W. & Freeland, S. L. 1996, ApJ, 470, 629
1996
-
[16]
2012, SoPh, 275, 67
Hurlburt, N., Cheung, M., Schrijver, C., et al. 2012, SoPh, 275, 67
2012
-
[17]
Huttunen, K. E. J., Koskinen, H. E. J., Schwenn, R. & Dal Lago, A. 2002, in Solar V ariability: From Core to Outer Frontiers, Eds
2002
-
[18]
Huttunen, K. E. J., Schwenn, R., Bothmer, V . & Koskinen, H. E. J. 2005, Ann. Geophys., 23, 625
2005
-
[19]
Hundhausen, A. J. 1997, in Cosmic Winds and the Heliosphere, (Eds.) Jokipii, J.R., Sonett, C.P., Giampapa, M.S., Space Science Series, pp. 259–296, Arizona University Press, Tucson
1997
-
[20]
Jackson, B. V . 1985, Sol. Phys., 100, 563
1985
-
[21]
B., Yang, G., Xu, Y
Jing, J., Yurchyshyn, V . B., Yang, G., Xu, Y . & Wang, H. 2004, ApJ, 614, 1054
2004
-
[22]
& Wang, H
Jing, J., Liu, C., Lee, J., Ji, H., Liu, N., Xu, Y . & Wang, H. 2018, ApJ, 864, 138
2018
-
[23]
1957, ZA, 43, 36
Kippenhahn, R., & Schluter, A. 1957, ZA, 43, 36
1957
-
[24]
& To¨rök, T
Kliem, B. & To¨rök, T. 2006, Phys. Rev. Lett., 96, 255002
2006
-
[25]
Kuperus, M., & Raadu, M. A. 1974, A&A, 31, 189
1974
-
[26]
1996, ApJ, 462, 547
Driel-Gesztelyi, L. 1996, ApJ, 462, 547
1996
-
[27]
R., Title, A
Lemen, J. R., Title, A. M., Akin, D. J., et al. 2012, SoPh, 275, 17
2012
-
[28]
W., 2012, Sol
Liu, Y , Zhao, J., Schuck, P. W., 2012, Sol. Phys., 287, 279
2012
-
[29]
D., Luhmann, J
Liu, Y . D., Luhmann, J. G., Kajdic, P., et al. 2014, Nat. Commun., 5, 3481
2014
-
[30]
J., Antiochos, S
Lynch, B. J., Antiochos, S. K., MacNeice, P. J., et al. 2004, ApJ, 617, 589
2004
-
[31]
I., Su, Y
McCauley, P. I., Su, Y . N., Schanche, N. et al. 2015, SoPh, 290, 1703
2015
-
[32]
L., Sterling, A
Moore, R. L., Sterling, A. C., Hudson, H. S. & Lemen, J. R. 2001, ApJ, 552, 833
2001
-
[33]
Moore, R. L. & Sterling, A. C., 2006, Initiation of Coronal Mass Ejections, in Washington DC American Geophysical Union Geophysical Monograph Series, 165, 43
2006
-
[34]
D.,Thompson, B
Pesnell, W. D.,Thompson, B. J. & Chamberlin, P. C. 2012, Sol. Phys., 275, 3
2012
-
[35]
& Yurchyshyn, V
Qiu, J. & Yurchyshyn, V . B. 2005, ApJL, 634, L121
2005
-
[36]
1976, Publ
Sakurai, T. 1976, Publ. Astron. Soc. Japan, 28, 177
1976
-
[37]
J., Heckman, G
Singer, H. J., Heckman, G. R. & Hirman, J. W. 2001, in Space
2001
-
[38]
& Gonzalez, W
Schwenn, R., dal Lago, A., Huttunen, E. & Gonzalez, W. D. 2005, Ann. Geophys., 23, 1033
2005
-
[39]
W., & Bamba, Y
Shimizu, T., Lites, B. W., & Bamba, Y . 2014, PASJ, 66, 14
2014
-
[40]
Sterling, A. C. & Moore, R. L. 2001, ApJ, 560, 1045
2001
-
[41]
Sterling, A. C. & Moore, R. L. 2001, ApJ, 561, 219
2001
-
[42]
Sterling, A. C. & Moore, R. L. 2005, ApJ, 630, 1148
2005
-
[43]
C., Chifor, C., Mason, H
Sterling, A. C., Chifor, C., Mason, H. E., Moore, R. L., & Young, P. R. 2010, A&A, 521, A49
2010
-
[44]
2015, ApJ, 807, 144 To¨rök, T
Su, Y ., van Ballegooijen, A., MacCauley, P., et al. 2015, ApJ, 807, 144 To¨rök, T. & Kliem, B. 2005, ApJL, 630, L97
2015
-
[45]
Akasofu, S. I. 2014, J. Geophys. Res., 93, 8519 van Ballegooijen, A. A. & Martens, P. C. H. 1989, ApJ, 343, 971
2014
-
[46]
1990, Sol
Vrsnak, B. 1990, Sol. Phys., 129, 295
1990
-
[47]
2008, Annales Geophysicae, 26, 3089
Vrsnak, B. 2008, Annales Geophysicae, 26, 3089
2008
-
[48]
& Ruzdjak, D
Vrsnak, B., Sudar, D. & Ruzdjak, D. 2005, A&A, 435, 1149
2005
-
[49]
2005, ApJ, 627, 1031
Wang, H., Liu, C., Deng, Y ., & Zhang, H. 2005, ApJ, 627, 1031
2005
-
[50]
& Zhang, J
Wang, Y . & Zhang, J. 2007, ApJ, 665, 1428
2007
-
[51]
2005, ApJL, 628, L163
Kliem, B. 2005, ApJL, 628, L163
2005
-
[52]
& Howard, R
Yashiro, S., Gopalswamy, N., Michalek, G. & Howard, R. A. 2002, Bull. Am. Astron. Soc., 34, 695
2002
-
[53]
Howard, R. A. 2005, J. Geophys. Res., 110, A12S05
2005
-
[54]
& Song, Q
Yang, S., Zhang, J., Zhu, X. & Song, Q. 2017, ApJ, 849, 21
2017
-
[55]
P., Wang, J
Zhou, G. P., Wang, J. X., Zhang, J. et al. 2006, ApJ, 651, 1238
2006
-
[56]
P., Zhang, J., Wang, J
Zhou, G. P., Zhang, J., Wang, J. X. & Wheatland, M. S. 2017, ApJL, 851, L1
2017
Reviewed August 14, 2026 · model on record in the stance chip above.
Discussion (0). Continue with ORCID to comment.