REVIEW 4 major objections 7 minor 4 references
Visualizing and forecasting subnational life-table death counts: Gap forecasting methods
T0 review · 4 major / 7 minor · reviewed 2026-07-09 · glm-5.2
Pith's one-line read Forecasting subnational mortality by modeling gaps from national data
desk verdict Solid, useful gap-forecasting framework for subnational mortality; the headline comparison result is real but partly mechanical, and the paper should own that. read the letter →
The pith
A machine-rendered reading of the paper's core claim, the machinery that carries it, and where it could break.
The reading
What carries the argument
Cumulative distribution function transformation of life-table death counts; Fisher Z transformation of gaps; principal component decomposition of gap surfaces; univariate time-series forecasting of component scores; sequential conformal prediction for interval construction.
What would settle it
If one were to apply this framework to a country where subnational data quality equals or exceeds national data quality, the regional gap advantage should disappear or reverse.
Extended reading notes
Core claim
The regional gap approach produces the most accurate forecasts of subnational life-table death counts because the difference between subnational and national CDFs is more stable and predictable than the difference between male and female CDFs. By transforming death counts into CDFs, the framework eliminates non-negativity and summability constraints, enabling a clean additive decomposition where a high-quality national forecast anchors a lower-quality subnational forecast through a modeled gap.
Load-bearing premise
The framework assumes that national data and female data are of sufficiently higher quality to serve as reliable anchors for subnational and male forecasts, respectively. If national data contains systematic biases, or if the female series does not structurally lead the male series, the gap forecasts inherit and amplify those errors.
Editorial extensions
If this is right
- Policymakers can produce more accurate subnational mortality forecasts by leveraging national-level data as an anchor rather than forecasting each region independently.
- The gap framework is extensible to any hierarchical data structure where a higher-aggregation series is of higher quality than a lower-aggregation series, such as industry-level versus firm-level data.
- The CDF transformation provides a general solution for forecasting compositional data (non-negative, sum-constrained) beyond mortality, applicable to fertility, migration, or cause-of-death distributions.
- The finding that regional gaps are more forecastable than gender gaps suggests that geographic mortality convergence within a country is a more regular process than gender-specific mortality convergence.
Editorial analysis
A structured set of objections, weighed in public.
Referee Report
Summary. The manuscript proposes a gap-modeling framework for forecasting subnational life-table death counts. The core idea is to apply a cumulative distribution function (CDF) transformation to normalized life-table death counts, which enforces non-negativity and summability constraints. The authors then model and forecast three types of gaps: the gender gap (male minus female), the regional gap (subnational minus national), and a double gap (combining both). Using Japanese data from 1947 to 2023 across 47 prefectures, they evaluate point and interval forecast accuracy using functional time-series methods (ARIMA/ETS on principal component scores) and sequential conformal prediction. The central empirical finding is that the regional gap approach yields the highest forecast accuracy.
Significance. The paper addresses a relevant problem in demographic and actuarial forecasting. The CDF transformation is a principled way to handle the constraints of life-table death counts, and the gap-modeling framework offers a flexible approach to multi-population forecasting. The empirical evaluation is thorough, employing an expanding-window forecast scheme and multiple density-based evaluation metrics (KLD, JSD). The inclusion of sequential conformal prediction for interval construction is a modern and computationally efficient choice. The authors provide reproducible code, which is a significant strength.
major comments (4)
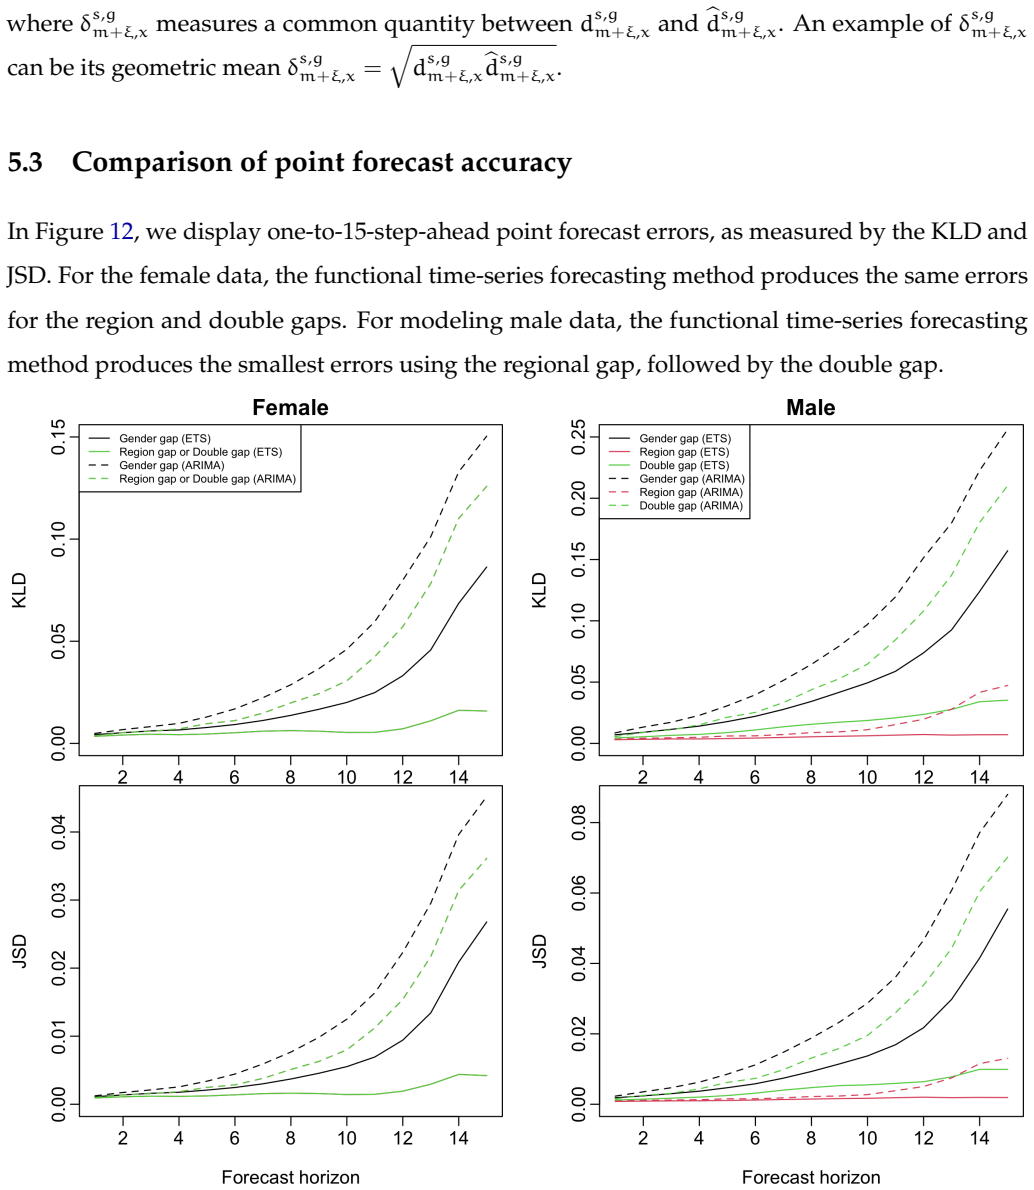
- Section 5.3, Table 1: The central claim is that the regional gap approach outperforms the gender gap and double gap methods. However, the comparison appears structurally confounded by the choice of anchor series. For male forecasts, the regional gap uses the male national CDF as an anchor (same gender, and the national aggregate includes the target prefecture), while the gender gap uses the female subnational CDF (different gender, same prefecture). The regional gap's advantage could be mechanical: same-gender national data is structurally closer to the target than cross-gender subnational data, making the gap smaller and more stable regardless of its forecastability. The paper attributes the result to data quality (Section 5.3: 'Regional gaps... tend to have higher data quality than gender gaps'), but does not test this explanation against the mechanical-closeness alternative. The same-
- pattern holds for females: the regional gap (anchored on same-gender national data) beats the gender gap (anchored on male data). The consistency of same-gender-national-anchor winning across both genders suggests a structural advantage rather than a substantive finding about gap types. The double gap's worse performance is also confounded: it uses two gaps (two error sources) versus one, so its underperformance doesn't cleanly isolate anchor quality from error accumulation. The authors should explicitly acknowledge this structural confounding and discuss whether the comparison is meant to evaluate gap forecastability or anchor suitability.
- Section 4.1, Eq. (1): The Fisher Z transformation is applied to the gender gap G^{N,M-F}_{t,x} = D^{N,M}_{t,x} - D^{N,F}_{t,x}. The text states this is done because the gap 'often lies between -1 and 1 behaved like correlation'. However, the gap is a difference of two CDFs, not a correlation coefficient. The Fisher Z transformation (arctanh) is designed for variables in (-1, 1) that are correlations, as it stabilizes variance and improves normality. Applying it to an arbitrary bounded variable does not guarantee these properties and may distort the scale of the gap. The authors should justify this transformation more rigorously or consider an alternative like a logit transformation (which is mentioned in Appendix B but not in the main text).
- Section 4.1: The number of principal components K is set to 6, following Hyndman et al. (2013). The text states that 'overestimating K leads to a smaller loss in accuracy than underestimating it', but provides no sensitivity analysis for this choice. Given that the gap series may have different dynamic structures than the raw mortality data, the optimal K could differ. A brief sensitivity analysis showing the robustness of the forecast accuracy to the choice of K (e.g., K=4, 6, 8) would strengthen the empirical claims.
minor comments (7)
- Section 2: The notation d^{s,g}_{t,x} is introduced for life-table death counts, but the normalization to a probability by dividing by the radix l_0 = 10^5 is described in the text without a formal equation. Adding an equation for the normalized quantity would improve clarity.
- Figure 2: The caption states 'We present their empirical CDFs, denoted by D^g_{t,x}', but the figure only shows national data. The caption should clarify that these are national-level CDFs, or the notation should include the superscript N.
- Section 4.4, Algorithm 1: The algorithm uses the notation q^{s,g}_{alpha,(m+ell)+h,x} for the predicted quantile, but the text later refers to it as q^{s,g}_{alpha,(m+ell)+h,x} in the prediction interval formula. The notation is consistent, but the algorithm description could be clearer about how the AR(p) model is used to forecast the quantile (is the quantile regression fit on the residuals, and then the AR model is fit on the quantile series, or is the AR model fit on the residuals and then the quantile is taken?).
- Table 1: The row labels 'ETS' and 'ARIMA' are placed in the middle of the table, which is slightly confusing. It would be clearer to have them as column headers or to separate the two methods with a horizontal line.
- Section 5.3: The text states 'Between ARIMA and ETS, it is advantageous to use ETS for producing point forecasts, as it not only produces smaller errors but is also computationally faster.' This is a strong claim. While Table 1 supports the smaller errors, no timing data is provided to support the computational speed claim. Either provide timing data or soften the claim.
- Appendix B: The age-period benchmark is described as using the logit transformation for the national female CDF, but the main text uses the Fisher Z transformation for the gaps. The reason for using different transformations in the main text and the benchmark is not explained.
- References: The citation for 'Japanese Mortality Database (2025)' lists the download date as November 19, 2025. Given the paper's date of July 2026, this is plausible, but the authors should ensure the data version is stable and citable.
Circularity Check
No circularity found: gap forecasts are produced by standard time-series methods and evaluated out-of-sample against holdout data
full rationale
The paper's derivation chain is self-contained and non-circular. (1) The CDF transformation (Section 2) is a one-to-one cumulative sum — a parameter-free, reversible mathematical operation, not a fitting step. (2) The gender gap, regional gap, and double gap are computed as differences of observed CDFs (Sections 4.1–4.3), then forecast using standard functional time-series methods (PCA decomposition + ETS/ARIMA on component scores). The forecasts are not constructed to equal any fitted quantity. (3) The central empirical claim — that the regional gap outperforms the gender gap and double gap — is validated via an expanding-window out-of-sample evaluation against holdout data (Section 5), using KLD, JSD, ECP, and mean interval score. No prediction reduces to its inputs by construction. The self-citation to Shang & Haberman (2025) for the CDF transformation is not load-bearing in the circularity sense: it introduces a standard mathematical transformation (cumulative sum of normalized death counts), not a uniqueness theorem that forbids alternatives, and the transformation is parameter-free and externally verifiable. The skeptic's concern about structural confounding of anchor choice (same-gender national data being mechanically closer to the target) is a legitimate interpretation/correctness concern, but it does not constitute circularity — the forecasts are genuinely out-of-sample and the evaluation metric compares against actual holdout observations not used in fitting.
Assumptions & free parameters
free parameters (2)
- K (number of principal components) =
6
- ARIMA/ETS model orders =
auto-selected by AICc
assumptions (2)
- domain assumption National mortality data and female mortality data are of higher quality than subnational and male data, respectively.
- domain assumption Fisher Z transformation is appropriate for gap values that behave like correlations.
Cite this review
Pith. "Pith review of Visualizing and forecasting subnational life-table death counts: Gap forecasting methods." pith.science (2026). https://pith.science/paper/45VCCCAU
@misc{pith2026260707284,
  author       = {Pith},
  title        = {Pith review of: Visualizing and forecasting subnational life-table death counts: Gap forecasting methods},
  year         = {2026},
  howpublished = {\url{https://pith.science/paper/45VCCCAU}},
  note         = {Machine review of arXiv:2607.07284}
}
read the original abstract
Subnational life-table death counts are highly correlated across time and space and differ by gender. While these associations are helpful in improving forecasts through joint modeling, less attention has been paid to identifying and understanding mortality disparities in gender and regional gaps. We propose a forecasting framework to model and forecast female life-table death counts at the national or subnational level, and to model and forecast the associated gender gap. For either females or males, we could forecast national life-table death counts and the regional gap relative to national data. By combining gender and regional gaps, we also explore the double gap by prioritizing national data and female data. Life-table death counts are unique due to their non-negativity and summability constraints. To address the constraints, we apply a one-to-one transformation, termed cumulative distribution function transformation, to obtain one- to 15-step-ahead forecasts. Using Japanese age-specific life-table death counts between ages 0 and 110+ from 1947 to 2023, we evaluate and compare point and interval forecast accuracy across gender, region, and double gaps. By focusing on these gaps, we can deepen our understanding of the possible factors driving gender and regional mortality variations.
Figures


Figures from the paper (11 more)




Reference graph
Works this paper leans on
-
[1]
Angelopoulos, A., Candes, E. & Tibshirani, R. J. (2023), Conformal PID control for time series prediction,in‘Advances in Neural Information Processing Systems 36 (NeurIPS 2023)’. URL:https://dl.acm.org/doi/10.5555/3666122.3667122 Austad, S. N. (2006), ‘Why women live longer than men: Sex differences in longevity’,Gender Medicine3(2), 79–92. Baum, F., Muso...
-
[2]
Beltr´an-S´anchez, H., Finch, C. E. & Crimmins, E. M. (2015), ‘Twentieth century surge of excess adult male mortality’,Proceedings of the National Academy of Sciences112(29), 8993–8998. Bonnet, F. & d’Albis, H. (2020), ‘Spatial inequality in mortality in France over the past two centuries’, Population and Development Review46(1), 145–168. 28 Booth, H., Hy...
work page 2015
-
[3]
(2007),Population Decline and Ageing in Japan – the Social Consequences, Routledge, New York
Coulmas, F. (2007),Population Decline and Ageing in Japan – the Social Consequences, Routledge, New York. Fontana, M., Zeni, G. & Vantini, S. (2023), ‘Conformal prediction: A unified review of theory and new challenges’,Bernoulli29(1), 1–23. Gammerman, A., Vovk, V . & Vapnik, V . (1998), Learning by transduction,in‘UAI’98: Proceedings of the Fourteenth co...
work page 2007
-
[4]
Gneiting, T. & Raftery, A. E. (2007), ‘Strictly proper scoring rules, prediction and estimation’,Journal of the American Statistical Association: Review Article102(477), 359–378. Hyndman, R., Athanasopoulos, G., Bergmeir, C., Caceres, G., Chhay, L., O’Hara-Wild, M., Petropou- los, F., Razbash, S., Wang, E. & Yasmeen, F. (2026),forecast: Forecasting functi...
work page 2007
Reviewed July 9, 2026 · model on record in the stance chip above.
Discussion (0). Sign in to comment.