REVIEW 4 major objections 6 minor 53 references
Knowledge-based model validation using a custom metric
T0 review · 4 major / 6 minor · reviewed 2026-08-11 · deepseek-v4-flash
Pith's one-line read A regression model trained on expert ratings predicts when a simulation is good enough.
desk verdict A careful, honest methods paper on learning validation metrics from expert ratings, with a real gap in how the reported prediction intervals account for feature selection. read the letter →
The pith
A machine-rendered reading of the paper's core claim, the machinery that carries it, and where it could break.
The reading
What carries the argument
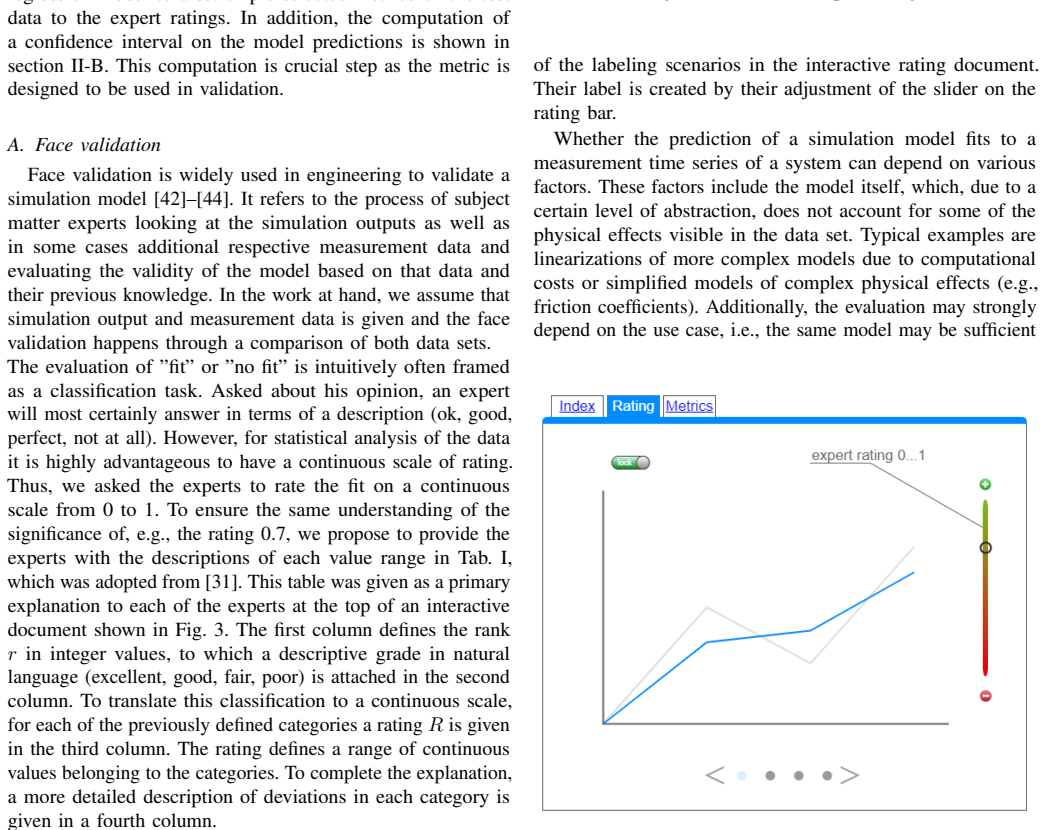
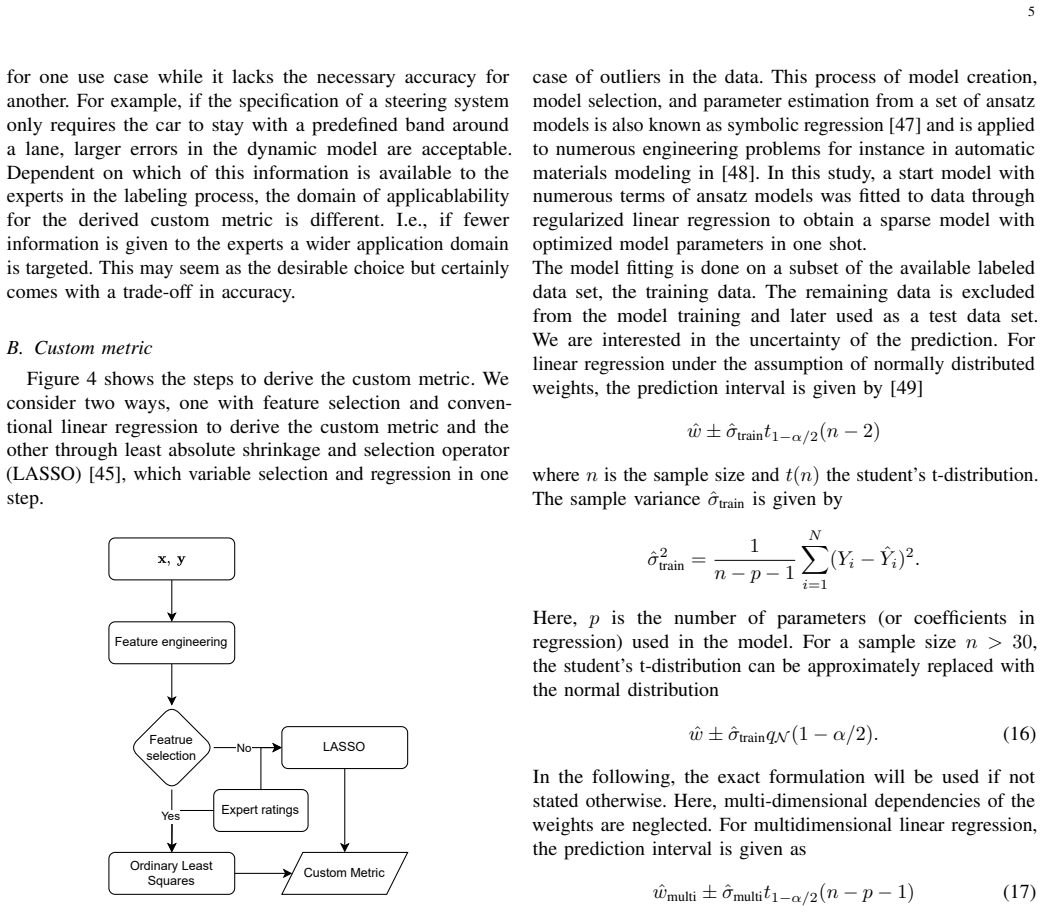
The load-bearing object is the custom metric itself: a linear regression model $R = \sum_i w_i f_i(x,y) + \epsilon$ in which the features are established time-series validation metrics computed on the measurement-simulation pair. It is built on a formalized face-validation step: experts rate curve pairs on a continuous 0-to-1 slider anchored to the ISO18571 grade table (excellent, good, fair, poor), so the labels carry a shared meaning. The regression machinery then selects a sparse set of base metrics (correlation threshold plus OLS or LASSO) and returns both a point prediction of the expert rating and a prediction interval from the residual variance, which is the component the paper argues is missing from existing validation metrics.
What would settle it
Collect expert ratings on curve pairs engineered so that all base metric features (MAE, Sprague–Geers components, ISO18571, corridor score, EEARTH) are identical while the pairs differ in ways experts can see in the plots, such as which physical regime the deviation occurs in or whether the mismatch is a phase lag versus a spike. If experts systematically assign different sufficiency ratings to these feature-identical pairs, then no linear combination of the listed features can reproduce expert judgment, and the paper's central claim fails.
Extended reading notes
Core claim
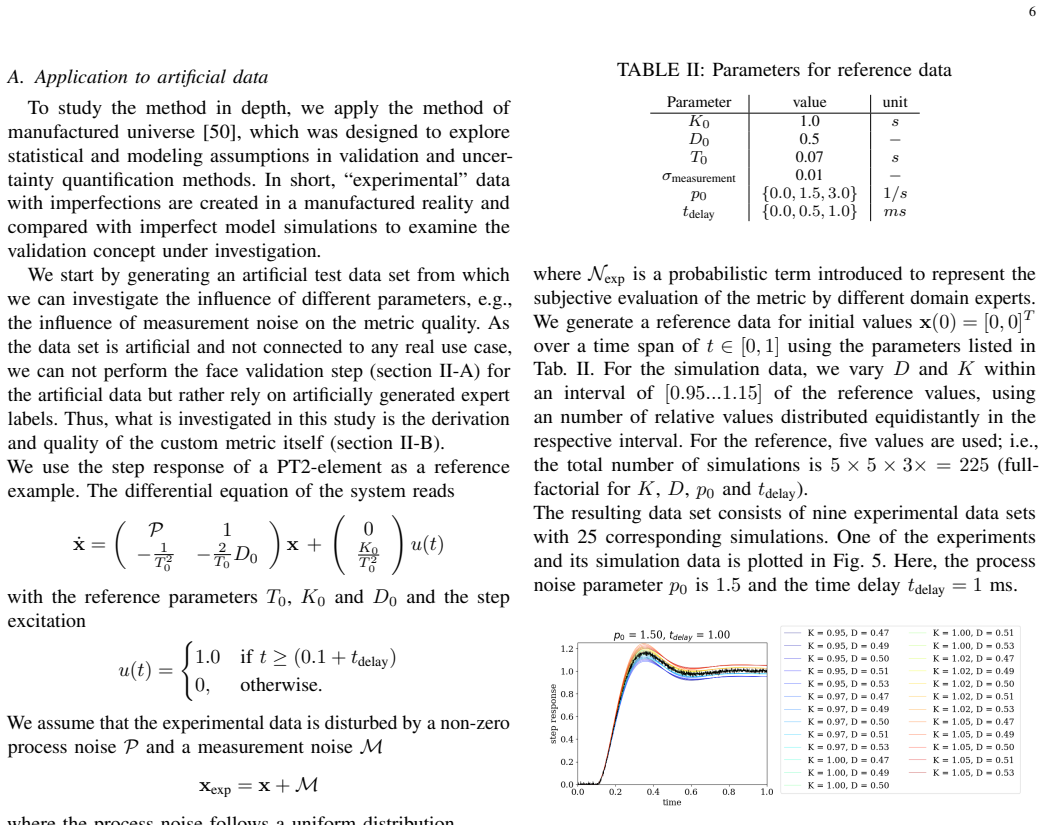
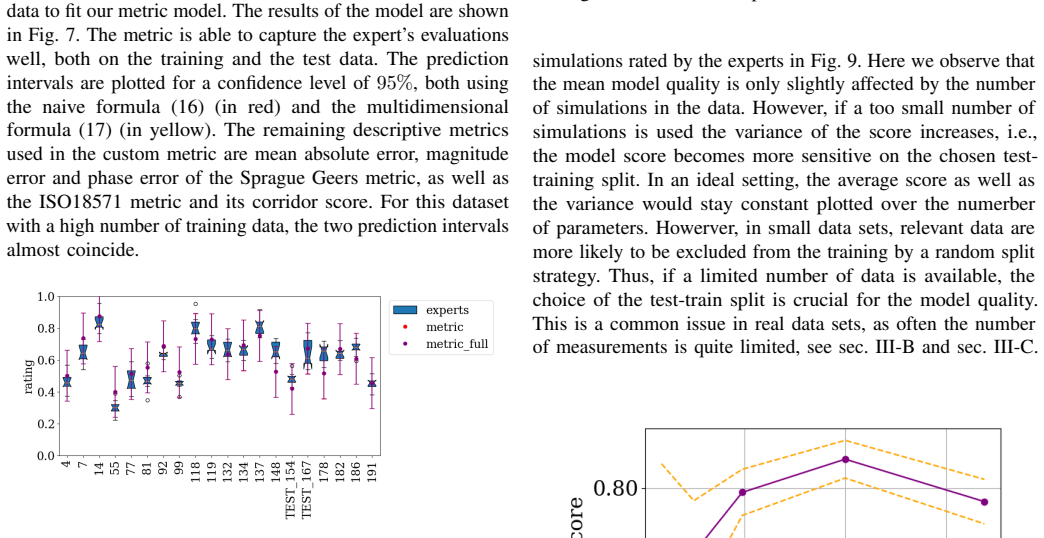
The central claim is that an expert judgment of 'sufficient model quality' can be approximated by a weighted linear combination of ordinary curve-comparison metrics, with the weights learned from labeled examples. Concretely, the paper models the rating as $R = \sum_{i=1}^N w_i f_i(x,y) + \epsilon$, where the features $f_i$ are standard quantities like mean absolute error, Sprague–Geers magnitude and phase errors, the ISO18571 combined score, its corridor score, and the EEARTH score. The weights come from ordinary least squares or LASSO after dropping strongly correlated features, and the prediction interval is derived from the standard linear-regression variance formula. The authors show on synthetic PT2 step-response data that the fitted metric tracks artificially generated expert labels well, remains stable as measurement noise increases when experts ignore that noise, and degrades predictably as expert disagreement grows; on the real datasets it reproduces expert rankings where data permit and produces wide prediction intervals that expose when labeling is too sparse to trust the fit.
Load-bearing premise
The method assumes that an expert's 'is this good enough?' judgment is fully captured by a linear combination of the listed curve-metric features; if experts rely on something not in those numbers—physical meaning of the deviation, excitation type, or intended use—the trained metric cannot reproduce their ratings no matter how many labels are collected.
Editorial extensions
If this is right
- An engineer can score a new simulation-versus-measurement pair with a single number that answers 'is this good enough?' rather than a bare discrepancy value.
- The attached prediction interval tells the user when the metric itself is too uncertain to trust, preventing overconfident validation on small labeled datasets.
- The metric is transparent: its weights reveal which standard error components (magnitude, phase, slope, corridor, etc.) drive expert opinion in a given use case.
- Because the metric inherits the expert panel's context, the same data labeled by a different panel or with different instructions yields a different custom metric targeted to that application.
- Within the paper's evidence, even five labeled curve pairs can give a fair prediction, though the interval makes clear that more labels are needed for reliable use.
Reading between the lines
- The linear-separability premise is testable outside the paper: if experts systematically rate two pairs with identical values across all base metrics differently because of context they notice in the curves, no linear combination of these features can reproduce their judgments, and the method would need features that encode physical meaning or excitation type.
- The prediction interval could be used as an active-learning acquisition function: label only the pairs where the interval is widest, which is a concrete extension the authors do not explore.
- The same recipe—expert ratings regressed onto standard discrepancy features—could transfer to other subjective quality judgments beyond vehicle models, such as audio, image, or human-performance model validation, whenever a shared rating scale can be anchored.
- In the synthetic study the expert labels are generated from a linear formula in the parameters, so the strong agreement there primarily demonstrates that a linear model can recover a linear labeling rule; it says little about how experts form judgments in real settings.
Signed reviews
Editorial analysis
A structured set of objections, weighed in public.
Referee Report
Summary. The paper proposes a method for constructing a use-case-specific validation metric by collecting expert ratings of whether simulation and measurement time series agree, computing a set of 16 standard time-series comparison metrics for each pair, and fitting a linear regression from the metrics to the expert ratings. The authors argue that the resulting regression model, called the custom metric, can predict the sufficiency of a new simulation result and provide a confidence interval for that prediction. The method is demonstrated on a synthetic manufactured-universe example with labels generated from a known parametric formula, a literature example involving five radial-velocity curve pairs rated by eleven experts, and a steering-system rack-position example with five curve pairs rated by fourteen experts.
Significance. If the statistical concerns were resolved, the proposed approach would be practically valuable because it offers a systematic way to translate subjective expert judgment into an objective, reproducible validation score with a stated uncertainty, which is often missing in engineering validation metrics. The paper is transparent about the small size of the real datasets and includes a synthetic experiment that allows controlled probing of hyperparameter effects. However, the central claim of predicting sufficiency with a reliable confidence is not currently supported by the evidence, because the prediction intervals are computed in a way that ignores feature selection and the clustering of expert ratings, and the real use cases contain only five distinct curves per domain.
major comments (4)
- [II-B, Eq. (17)] The prediction interval in Eq. (17) is a standard OLS interval for a fixed, pre-specified linear model, but the model is selected on the same data via the correlation threshold in Sec. III-A and the retained-feature choices in Secs. III-B and III-C. After feature selection, the interval does not have the nominal 1-alpha coverage because the selection procedure is ignored; the paper neither mentions post-selection inference nor uses sample splitting. This directly affects the claimed 'confidence on this prediction' and is therefore a load-bearing issue for the central claim.
- [III-B and III-C] In both real applications, each time-series pair is rated by multiple experts, all of whom see the same features for that pair. The regression treats these ratings as independent observations, but the errors for a given curve are correlated because the curve features are shared. The effective sample size is therefore the number of distinct curves (five), not the number of ratings (e.g., 55 or 70). The prediction interval formula in Eq. (17) assumes independent errors, so the intervals shown in Figs. 13 and 16 understate the uncertainty. The paper should either model the clustering (e.g., with a mixed-effects model) or explicitly treat the five curves as the sample size and adjust the degrees of freedom accordingly.
- [III-B and III-C] With only five distinct curves in each real use case, a single train/test split with one held-out curve provides almost no evidence that the custom metric generalizes to new simulation results. The paper acknowledges that 'only five labeled data points were available' and that this is 'not sufficient for usage in a real validation strategy,' yet still concludes that 'a fair prediction is possible.' That conclusion is not supported by the empirical evidence; at best, the real examples are illustrative, and the synthetic experiment cannot validate the representation of expert judgment because its labels are generated by the linear formula in Eq. (18), which is not a realistic model of expert cognition.
- [II-B and III-A] The method section describes LASSO as an alternative for combined feature selection and regression, but the applications only use correlation-threshold selection followed by ordinary least squares. No LASSO results are reported anywhere in the paper. If LASSO is meant to be part of the proposed approach, its behavior and inference (which would require additional adjustments for selection and shrinkage bias) should be demonstrated; otherwise, the LASSO path should be removed from the method description or clearly marked as future work.
minor comments (6)
- [Throughout] There are numerous typos and spelling errors, including 'Featrue selection' in Fig. 4, 'can than predict' in the Abstract, 'actatuator' in Sec. III-C, 'valdiation' in Ref. [43], 'numerber' and 'Howerver' in Sec. III-A, 'disucssed' in Sec. I-D, and 'rater just a metric' in Sec. III-B.
- [II-B] In Eq. (16), the notation is unclear: it appears to give an interval for a single weight rather than for a new observation, and the use of sqrt(N) is not defined. The text should distinguish between intervals for the mean response and intervals for a new observation.
- [II-B] The sentence 'under the assumption of normally distributed weights' should read 'under the assumption of normally distributed errors'; the distributional assumption concerns the noise term, not the regression weights.
- [III-B] The phrase 'the EEARTH score of ISO18751' is incorrect: EEARTH is due to Sarin et al. [19] and ISO18571 is a different standard metric; please correct the terminology.
- [III-B] The quotation attributed to reference [52] appears to originate from Schwer [29] rather than from Oberkampf and Trucano; please verify the source of the quoted text.
- [III-A] In Fig. 7, the caption mentions 95% confidence intervals but does not explain the difference between the red and yellow intervals; a short note in the caption would help readers understand the two formulas.
Circularity Check
No significant circularity: the regression target (expert ratings) is external to the feature set, and the synthetic test constructs labels from parameter deviations rather than from the metric features.
full rationale
The central derivation is supervised regression of expert sufficiency ratings R onto a fixed list of standard time-series metrics (Eq. 15). The labels are not re-encoded features: in the synthetic experiment, ratings are generated by Eq. (18) from relative parameter deviations (K-K0)/(K+K0) and (D-D0)/(D+D0) plus Gaussian noise, not from MAE, Sprague-Geers, ISO18571, or any of the predictor features. Thus the out-of-sample test in Sec. III-A is a genuine check that the metric features can explain independently constructed labels. In the two real examples, expert ratings are collected via a slider and colorbar (Sec. II-A), again external to the computed metric set. The prediction interval in Eq. (17) is the standard OLS interval for the fitted linear model; although the paper combines it with feature selection and does not address post-selection inference, that is a statistical-coverage concern, not a circular-equivalence between input and output. The two self-citations [27] and [38] appear only in survey lists of existing validation and uncertainty methods and are not load-bearing for the custom-metric derivation. The paper also candidly limits its own claim where only five labeled points are available (Sec. IV), which is a data-availability limitation rather than a circular step. No equation or fitted quantity reduces to its own input by construction.
Assumptions & free parameters
free parameters (4)
- Regression weights w_i =
not reported for real use cases
- Correlation threshold for feature dropping =
0.9
- LASSO regularization strength =
not reported
- Synthetic expert weights wK, wD, sigma_exp =
0.7, 0.7, 0.05
assumptions (4)
- domain assumption Expert sufficiency judgments are linearly separable in the chosen feature space (Eq. 15).
- domain assumption The listed standard metrics capture all information experts use when rating fit (Sec. III-A).
- domain assumption Expert ratings are independent and identically distributed samples (Sec. II-A).
- standard math Prediction interval formulas assume normally distributed regression errors (Sec. II-B).
Cite this review
Pith. "Pith review of Knowledge-based model validation using a custom metric." pith.science (2026). https://pith.science/paper/4A4LSTH6
@misc{pith2026241207521,
  author       = {Pith},
  title        = {Pith review of: Knowledge-based model validation using a custom metric},
  year         = {2026},
  howpublished = {\url{https://pith.science/paper/4A4LSTH6}},
  note         = {Machine review of arXiv:2412.07521}
}
read the original abstract
Vehicle models have a long history of research and as of today are able to model the involved physics in a reasonable manner. However, each new vehicle has its new characteristics or parameters. The identification of these is the main task of an engineer. To validate whether the correct parameter set has been chosen is a tedious task and often can only be performed by experts. Metrics known commonly used in literature are able to compare different results under certain aspects. However, they fail to answer the question: Are the models accurate enough? In this article, we propose the usage of a custom metric trained on the knowledge of experts to tackle this problem. Our approach involves three main steps: first, the formalized collection of subject matter experts' opinion on the question: Having seen the measurement and simulation time series in comparison, is the model quality sufficient? From this step, we obtain a data set that is able to quantify the sufficiency of a simulation result based on a comparison to corresponding experimental data. In a second step, we compute common model metrics on the measurement and simulation time series and use these model metrics as features to a regression model. Third, we fit a regression model to the experts' opinions. This regression model, i.e., our custom metric, can than predict the sufficiency of a new simulation result and gives a confidence on this prediction.
Figures


Figures from the paper (10 more)




Reference graph
Works this paper leans on
-
[1]
N. Kalra and S. M. Paddock, “Driving to safety: How many miles of driving would it take to demonstrate autonomous vehicle reliability?” IEEE Transportation Research Part A , vol. 94, pp. 182–193, 2016
work page 2016
-
[2]
Use of simulation for the homologation of automated driving functions,
H. Abdellatif and C. Gnandt, “Use of simulation for the homologation of automated driving functions,” ATZelectronics worldwide, vol. 14, pp. 68–71, 2019
work page 2019
-
[3]
Simulation methods supporting homologation of electronic stability control in vehicle variants,
A. Lutz, B. Schick, H. Holzmann, M. Kochem, H. Meyer-Tuve, O. Lange, Y . Mao, and G. Tosolin, “Simulation methods supporting homologation of electronic stability control in vehicle variants,” Vehicle System Dynamics, vol. 55, no. 10, pp. 1432–1497, 2017
work page 2017
-
[4]
Model validation and scenario selection for virtual-based homologation of automated vehicles,
S. Riedmaier, D. Schneider, D. Watzenig, F. Diermeyer, and B. Schick, “Model validation and scenario selection for virtual-based homologation of automated vehicles,” Applied Sciences, vol. 11, no. 1, 2021
work page 2021
-
[5]
Virtual testing of automated driving systems. a survey on validation methods,
R. Don `a and B. Ciuffo, “Virtual testing of automated driving systems. a survey on validation methods,” IEEE Access, vol. 10, pp. 24 349–24 367, 2022
2022
-
[6]
Research methodology for a new validation concept in vehicle dynamics,
M. Viehof and H. Winner, “Research methodology for a new validation concept in vehicle dynamics,” Automotive and Engine Technology , pp. 21–27, 2018
work page 2018
-
[7]
Determining the validity of simulation models for the verification of automated driving systems,
B. Neurohr, T. Koopmann, E. M ¨ohlmann, and M. Fr ¨anzle, “Determining the validity of simulation models for the verification of automated driving systems,” IEEE Access, vol. 11, pp. 102 949–102 960, 2023
work page 2023
-
[8]
Statistical model verification and validation concept in automotive vehicle design,
B. Danquah, S. Riedmaier, J. R ¨uhm, S. Kalt, and M. Lienkamp, “Statistical model verification and validation concept in automotive vehicle design,” Procedia CIRP, vol. 91, pp. 261–270, 2020
work page 2020
Show all 53 references
-
[9]
W. G. Vincenti, What Engineers Know and How They Know It: Analytical Studies from Aeronautical History. Johns Hopkins University Press, 1990. [Online]. Available: https://api.semanticscholar.org/CorpusID:110214831
1990
-
[10]
Control system performance measures: Past, present, and future,
V . C. R. W. C. Schultz, “Control system performance measures: Past, present, and future,” IRE Trans. Autom. Control. , vol. AC-6, no. 1, 02 1961
1961
-
[11]
W. L. Oberkampf and C. J. Roy, Verification and Validation in Scientific Computing. Cambridge University Press, 2010
2010
-
[12]
Review of statistical model calibration and validation—from the perspective of uncertainty structures,
G. Lee, W. Kim, H. Oh, B. D. Youn, and N. Kim, “Review of statistical model calibration and validation—from the perspective of uncertainty structures,” Structural and Multidisciplinary Optimization , 05 2019
2019
-
[13]
Verification and validation of simulation models,
R. G. Sargent, “Verification and validation of simulation models,” in Proceedings of the 2010 Winter Simulation Conference , 2010, pp. 166– 183
2010
-
[14]
Measures of agreement between computation and experiment: Validation metrics,
W. L. Oberkampf and M. F. Barone, “Measures of agreement between computation and experiment: Validation metrics,” Journal of Computa- tional Physics, vol. 217, no. 1, pp. 5 – 36, 2006, uncertainty Quantification in Simulation Science
2006
-
[15]
Formulation of the thermal problem,
K. J. Dowding, M. Pilch, and R. G. Hills, “Formulation of the thermal problem,” Computer Methods in Applied Mechanics and Engineering , vol. 197, no. 29, pp. 2385–2389, 2008, validation Challenge Workshop. [Online]. Available: https://www.sciencedirect.com/science/article/pii/...
2008
-
[16]
Model validation and predictive capability for the thermal challenge problem,
S. Ferson, W. L. Oberkampf, and L. Ginzburg, “Model validation and predictive capability for the thermal challenge problem,” Computer Methods in Applied Mechanics and Engineering , vol. 197, no. 29, pp. 2408 – 2430, 2008, validation Challenge Workshop
2008
-
[17]
Objective error measure for the comparison of calculated and measured transient response histories,
T. L. Geers, “Objective error measure for the comparison of calculated and measured transient response histories,” Shock and Vibration Bulletin , vol. 54, p. 99–107, 1984
1984
-
[18]
A time- domain approach to model validation,
K. Poolla, P. Khargonekar, A. Tikku, J. Krause, and K. Nagpal, “A time- domain approach to model validation,” IEEE Transactions on Automatic Control, vol. 39, no. 5, pp. 951–959, 1994
1994
-
[19]
A comprehensive metric for comparing time histories in validation of simulation models with emphasiis on vehicle safety applications,
H. Sarin, M. Kokkolaras, G. Hulbert, P. Papalambros, S. Barbat, and R.-J. Yang, “A comprehensive metric for comparing time histories in validation of simulation models with emphasiis on vehicle safety applications,” ASME 2008 International Design Engineering Technical Conferen...
2008
-
[20]
Dynamics model validation using time-domain metrics,
D. Ao, Z. Hu, and S. Mahadevan, “Dynamics model validation using time-domain metrics,” Journal of Verification, Validation and Uncertainty Quantification, vol. 2, no. 1, p. 011004, 03 2017. [Online]. Available: https://doi.org/10.1115/1.4036182
2017 doi
-
[21]
Frequency domain model validation in wasserstein metric,
A. Halder and R. Bhattacharya, “Frequency domain model validation in wasserstein metric,” in 2013 American Control Conference , 2013, pp. 5845–5850
2013
-
[22]
Statistical validation of simulation models,
R. Rebba, S. Huang, Y . Liu, and S. Mahadevan, “Statistical validation of simulation models,” International Journal of Materials and Product Technology, vol. 25, no. 1-3, pp. 164–181, 2006
2006
-
[23]
Toward a Better Understanding of Model Validation Metrics,
Y . Liu, W. Chen, P. Arendt, and H.-Z. Huang, “Toward a Better Understanding of Model Validation Metrics,” Journal of Mechanical Design, vol. 133, no. 7, p. 071005, 07 2011. [Online]. Available: https://doi.org/10.1115/1.4004223
2011 doi
-
[24]
Statistical validation,
D. Mayer and D. Butler, “Statistical validation,” Ecological Modelling, vol. 68, no. 1, pp. 21–32, 1993, theoretical Modelling Aspects. [Online]. Available: https://www.sciencedirect.com/science/article/pii/ 0304380093901052
1993
-
[25]
Statistical validation of simulation models,
J. P. Kleijnen, “Statistical validation of simulation models,” European Journal of Operational Research , vol. 87, no. 1, pp. 21–34, 1995. [Online]. Available: https://www.sciencedirect.com/science/article/pii/ 037722179500132A
1995
-
[26]
Further results on probabilistic model validation in wasserstein metric,
A. Halder and R. Bhattacharya, “Further results on probabilistic model validation in wasserstein metric,” in 2012 IEEE 51st IEEE Conference on Decision and Control (CDC) , 2012, pp. 5542–5547. 11
2012
-
[27]
Online validity monitor for vehicle dynamics models,
S. Rhode and J. V on Keler, “Online validity monitor for vehicle dynamics models,” in 2019 IEEE International Conference on Connected Vehicles and Expo (ICCVE) , 2019, pp. 1–6
2019
-
[28]
A spectral-element method for modelling cavitation in transient fluid-structure interaction,
M. Sprague and T. Geers, “A spectral-element method for modelling cavitation in transient fluid-structure interaction,” International Journal for Numerical Methods in Engineering , vol. 60, pp. 2467 – 2499, 08 2004
2004
-
[29]
Validation metrics for response histories: perspectives and case studies,
L. E. Schwer, “Validation metrics for response histories: perspectives and case studies,” Engineering with Computers , pp. 295–309, 2007
2007
-
[30]
Error measures for comparing transient data : Part i : Development of a comprehensive error measure part ii : Error measures case study,
D. M. Russell, “Error measures for comparing transient data : Part i : Development of a comprehensive error measure part ii : Error measures case study,” in Proceedings of the 68th shock and vibration symposium . Hunt Valley, MD, 1997
1997
-
[31]
Road vehicles - objective rating metric for non-ambiguous signals,
ISO-TC 22, “Road vehicles - objective rating metric for non-ambiguous signals,” ISO/TS 18571:2014, 2014
2014
-
[32]
Durability, repeatability and reproducibility of the nhtsa side impact dummy,
B. R. Donnelly, R. M. Morgan, and R. H. Eppinger, “Durability, repeatability and reproducibility of the nhtsa side impact dummy,” in 27th Stapp Car Crash Conference with IRCOBI and Child Injury and Restraint Conference with IRCOBI (1983) . SAE International, oct 1983
1983
-
[33]
Validation of a two-wheel vehicle model using genetic algorithm,
A. Widner, B. Varga, D. Medgyesi, and T. Tettamanti, “Validation of a two-wheel vehicle model using genetic algorithm,” in 2022 IEEE 22nd International Symposium on Computational Intelligence and Informatics and 8th IEEE International Conference on Recent Achievements in Mecha...
2022
-
[34]
Validation metric for dynamic system responses under uncertainty,
Z. Xi, H. Pan, Y . Fu, and R.-J. Yang, “Validation metric for dynamic system responses under uncertainty,” SAE International Journal of Materials and Manufacturing , vol. 8, pp. 309–314, 2015
2015
-
[35]
New metrics for validation of data-driven random process models in uncertainty quantification,
H. Xu, Z. Jiang, D. W. Apley, and W. Chen, “New metrics for validation of data-driven random process models in uncertainty quantification,” Journal of Verification, Validation and Uncertainty Quantification , vol. 1, p. 021002, 2016
2016
-
[36]
A comprehensive framework for verifi- cation, validation, and uncertainty quantification in scientific computing,
C. J. Roy and W. L. Oberkampf, “A comprehensive framework for verifi- cation, validation, and uncertainty quantification in scientific computing,” Computer Methods in Applied Mechanics and Engineering , vol. 200, no. 25, pp. 2131–2144, 2011
2011
-
[37]
Unified framework and survey for model verification, validation and uncertainty quantification,
S. Riedmaier, B. Danquah, B. Schick, and F. Diermeyer, “Unified framework and survey for model verification, validation and uncertainty quantification,” Arch Computat Methods Eng 28 , 2021
2021
-
[38]
Non-stationary gaussian process regression applied in validation of vehicle dynamics models,
S. Rhode, “Non-stationary gaussian process regression applied in validation of vehicle dynamics models,” Engineering Applications of Artificial Intelligence, vol. 93, p. 103716, 2020
2020
-
[39]
Bendersen, A student’s guide to data and error analysis
H. Bendersen, A student’s guide to data and error analysis . Cambridge University Press, 2011
2011
-
[40]
Measurement Uncer- tainty Analysis Principles and Methods – NASA Measurement Quality Assurance Handbook – ANNEX 3,
National Aeronautics and Space Administration, “Measurement Uncer- tainty Analysis Principles and Methods – NASA Measurement Quality Assurance Handbook – ANNEX 3,” NASA Handbook, 2010
2010
-
[41]
Stand der Technik und der Wissenschaft: Modellvalidierung im Anwendungsbereich der Fahrdynamiksimulation,
M. Viehof and H. Winner, “Stand der Technik und der Wissenschaft: Modellvalidierung im Anwendungsbereich der Fahrdynamiksimulation,” Forschungsbericht (Technische Universit¨at Darmstadt), 2017
2017
-
[42]
Model verification and validation,
J. S. Carson, “Model verification and validation,” in Proceedings of the 2002 Winter Simulation Conference . WSC 2002, San Diego, California, 2002
2002
-
[43]
A framework for the testing and valdiation of simulated environments in experimentation and training,
D. J. Harris, J. M. Bird, P. A. Smart, M. R. Wislon, and S. J. Vine, “A framework for the testing and valdiation of simulated environments in experimentation and training,” frontiers in Psychology, 2020
2020
-
[44]
A formal framework for model verification in System Engineering: UPSL,
V . Chapurlat, “A formal framework for model verification in System Engineering: UPSL,” HAL open science , 2010
2010
-
[45]
Regression shrinkage and selection via the lasso,
R. Tibshirani, “Regression shrinkage and selection via the lasso,” Journal of the Royal Statistical Society. Series B (Methodological) , vol. 58, no. 1, pp. 267–288, 1996. [Online]. Available: http: //www.jstor.org/stable/2346178
1996
-
[46]
P. J. Rousseeuw and A. M. Leroy, Robust regression and outlier detection. John wiley & sons, 2005
2005
-
[47]
Contemporary symbolic regression methods and their relative performance,
W. La Cava, P. Orzechowski, B. Burlacu, F. O. de Fran c ¸a, M. Virgolin, Y . Jin, M. Kommenda, and J. H. Moore, “Contemporary symbolic regression methods and their relative performance,” arXiv preprint arXiv:2107.14351, 2021
2021 arXiv
-
[48]
Unsupervised discovery of interpretable hyperelastic constitutive laws,
M. Flaschel, S. Kumar, and L. De Lorenzis, “Unsupervised discovery of interpretable hyperelastic constitutive laws,” Computer Methods in Applied Mechanics and Engineering , vol. 381, p. 113852, 2021
2021
-
[49]
Fahrmeier, C
L. Fahrmeier, C. Heumann, R. K ¨unstler, I. Pigeot, and G. Tutz, Statistik - Der Weg zur Datenanalyse . Springer, 2016
2016
-
[50]
The method of manufactured universes for validating uncertainty quantification methods,
H. Stripling, M. Adams, R. McClarren, and B. Mallick, “The method of manufactured universes for validating uncertainty quantification methods,” Reliability Engineering & System Safety , vol. 96, no. 9, pp. 1242–1256, 2011, quantification of Margins and Uncertainties
2011
-
[51]
Spectral elements and field separation for an acoustic fluid subject to cavitation,
M. A. Sprague and T. Geers, “Spectral elements and field separation for an acoustic fluid subject to cavitation,” Journal of Computational Physics, vol. 184, p. 149–162, 2003
2003
-
[52]
Measurement uncertainty analysis principles and methods,
W. L. Oberkampf and T. G. Trucano, “Measurement uncertainty analysis principles and methods,” SANDIA Report (Sandia National Laboratories), 2002
2002
-
[53]
Bosch mobility: Steer-by-wire,
“Bosch mobility: Steer-by-wire,” https://www.bosch-mobility.com/de/ loesungen/lenkung/steer-by-wire/, accessed: 2024-08-21
2024
Reviewed August 11, 2026 · model on record in the stance chip above.
Discussion (0). Continue with ORCID to comment.