REVIEW 3 major objections 5 minor 41 references
State of health prediction of lithium-ion batteries for driving conditions based on full parameter domain sparrow search algorithm and dual-module bidirectional gated recurrent unit
T0 review · 3 major / 5 minor · reviewed 2026-08-07 · deepseek-v4-flash
Pith's one-line read A sparrow-optimized bidirectional GRU, using one incremental-capacity feature, predicts battery state of health better than six rival models and reaches RMSE under 0.003 on real EV data.
desk verdict A plausible incremental engineering combination whose reported accuracy is likely inflated by bidirectional look-ahead in the test protocol; needs a causal re-evaluation before the numbers can be believed. read the letter →
The pith
A machine-rendered reading of the paper's core claim, the machinery that carries it, and where it could break.
The reading
What carries the argument
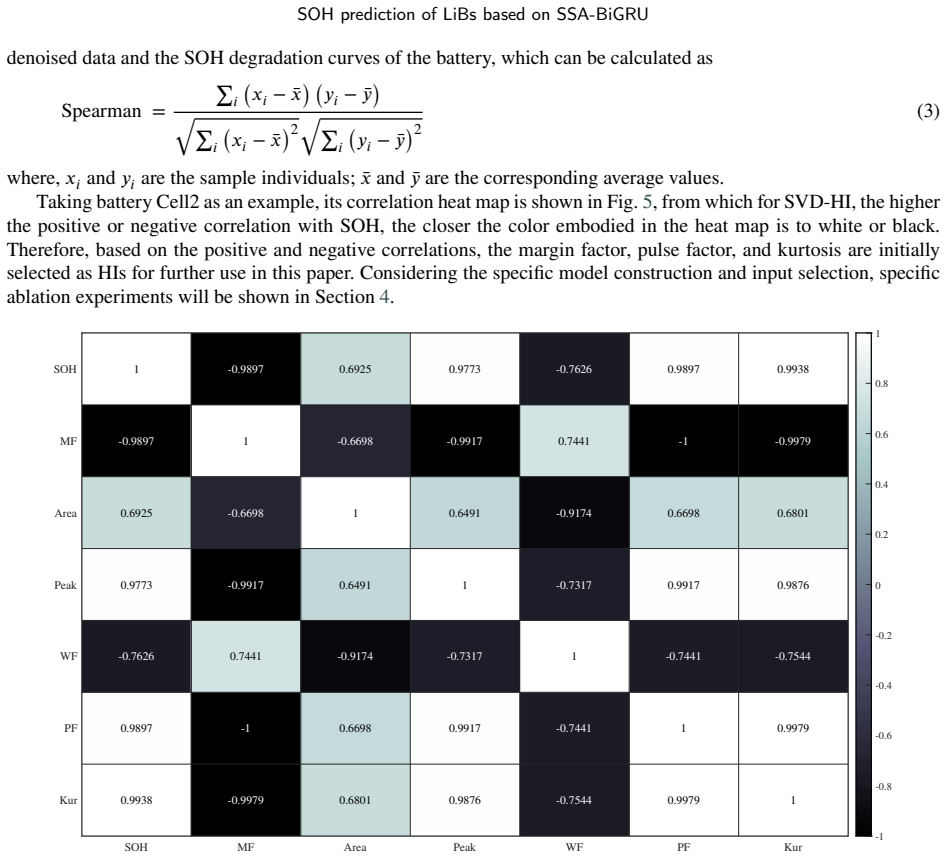
The load-bearing object is the one-dimensional health indicator: the margin factor of the incremental capacity curve, normalized to [0,1], denoised with singular value decomposition, and chosen by Spearman correlation and ablation. The predictor is a dual-module BiGRU, a serial stack of two bidirectional gated recurrent units in which each module reads the sequence forward and backward (the backward path uses Flip layers around a GRU), giving every output access to past and future context. The optimizer is the sparrow search algorithm, a swarm method that models producers, scroungers, and warners moving through the search space; here it independently sets the number of GRU cells in each of four layers, the four dropout rates, learning rate, max epochs, and minibatch size, which the authors call full-parameter-domain optimization. The argument runs through these three components: the health indicator condenses degradation into a scalar trace, the bidirectional stack propagates trend information across the whole sequence, and the optimizer removes manual hyperparameter choice.
What would settle it
Run the same SSA-BiGRU model in a strictly causal evaluation on the same laboratory cells: at each cycle, supply only health-indicator values up to that cycle (via masking or recursive one-step-ahead feeding) and recompute RMSE at the 25% starting point. If the causal RMSE stays near the reported 0.0027, the claim survives; if it rises to the level of the runner-up models or above, the reported superiority is an artifact of the bidirectional network seeing future data.
Extended reading notes
Core claim
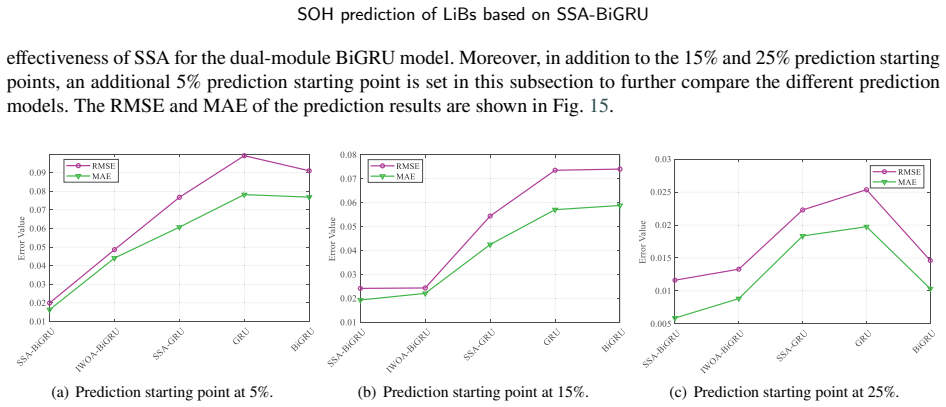
On its own terms, the paper shows that one denoised dimensionless feature of the incremental capacity curve contains enough degradation information to drive an accurate SOH predictor. The chosen feature, the margin factor after SVD denoising, is selected by Spearman correlation and ablation experiments, and it is used as the sole input to a dual-module BiGRU. The network stacks two bidirectional GRU modules; each module has a forward GRU and a backward GRU (implemented with Flip layers), so the output at every cycle is conditioned on both earlier and later values of the input sequence. The sparrow search algorithm then optimizes the four GRU layer sizes, four dropout rates, learning rate, maximum epochs, and minibatch size independently, rather than sharing parameters symmetrically as in a conventional BiGRU. The reported evidence is numerical: across four cells and three prediction starting points, SSA-BiGRU has the lowest RMSE in 11 of 12 comparisons, and on real EV charging data its RMSE stays below 0.003 for all 20 vehicles when the model is trained on the complete history of a single other vehicle. The paper also reports a sharp benefit from more training data, with RMSE dropping by nearly two orders of magnitude when the prediction starting point moves from 5% to 25% of the sequence.
Load-bearing premise
The reported test accuracy assumes the model sees the entire test sequence at once, so each SOH prediction can draw on future health-indicator values, and the paper gives no causal masking or recursive one-step-ahead evaluation; if the intended use is true forecasting with only past data, the stated errors are optimistic and the advantage over causal models may shrink or disappear.
Editorial extensions
If this is right
- A battery management system could flag replacement timing from charging-curve features alone, without capacity measurements or physical models, using the reported error ranges as a guide.
- The chosen margin-factor health indicator, after SVD denoising, is sufficient as a single input feature; the paper's ablation shows it reduces RMSE by 70% and 86.76% compared with the raw margin factor at the two prediction starting points.
- Full-parameter-domain SSA optimization matters most when training data reaches 25% of the sequence, where RMSE falls by almost two orders of magnitude relative to 5% starting-point experiments; the optimized model also outperforms an IWOA-optimized BiGRU in most settings.
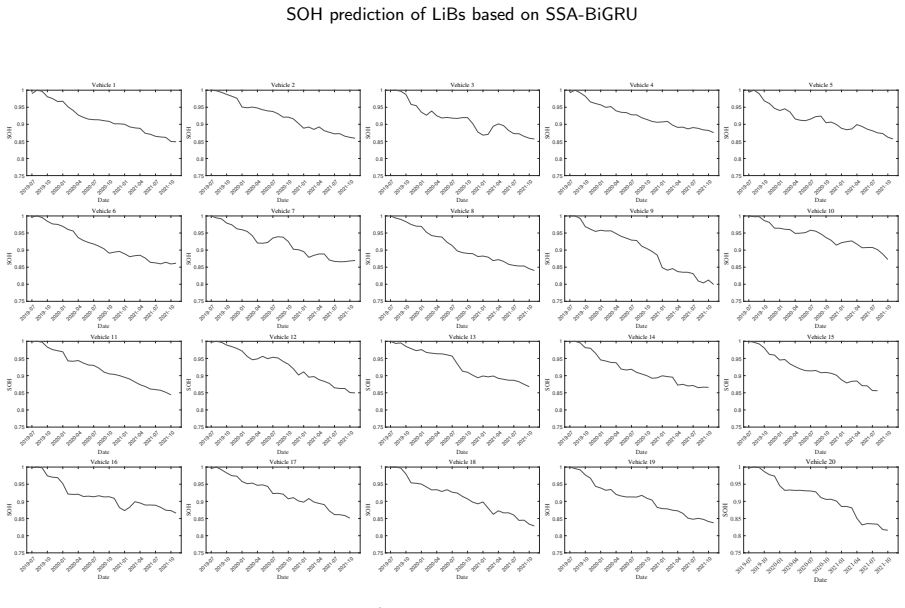
- On real EV data, the model generalizes across vehicles of the same model when trained on one vehicle's complete degradation history, and it is better suited to early degradation prediction (e.g., second month) than to later stages.
- The method transfers from a simulated-driving laboratory dataset to lower-resolution on-road charging data, suggesting the health indicator survives measurement noise and reduced sampling rates.
Reading between the lines
- If the reported accuracy is confirmed under a causal protocol (no future data at prediction time), the practical deployment case becomes much stronger: an onboard estimator could produce a replacement warning from real-time charging data. The current protocol, which feeds the full test sequence through the bidirectional network, leaves this deployment claim untested.
- The real-fleet experiment is a same-model transfer task; a natural extension is cross-batch or cross-chemistry testing to see whether the full-parameter-domain optimization, which re-tunes hyperparameters to each training set, preserves the margin over simpler baselines.
- Reporting point errors without uncertainty bounds leaves end-of-life decisions exposed; adding prediction intervals or quantile outputs would let a battery management system trade off false alarms against missed replacements, a direct testable extension of the same architecture.
Editorial analysis
A structured set of objections, weighed in public.
Referee Report
Summary. The manuscript proposes a fusion model (SSA-BiGRU) for lithium-ion battery state-of-health (SOH) prediction, combining a dual-module bidirectional GRU with sparrow search algorithm (SSA) hyperparameter optimization and an incremental-capacity (IC)-curve-derived health indicator (HI). The authors first extract candidate HIs from IC curves, use Spearman correlation and ablation on battery Cell2 to select the best one, then optimize the BiGRU hyperparameters with SSA. They evaluate the model on the Oxford battery dataset (Cell1, Cell3, Cell7, Cell8) at three prediction starting points and on a real-road EV charging dataset of 20 vehicles, reporting very low RMSE/MAE/MAPE values and claiming superior accuracy, robustness, and generalization compared with six alternative fusion models.
Significance. If the reported accuracy were obtained under a causally valid forecasting protocol, the paper would offer a useful engineering contribution: the HI extraction via IC curves with correlation/ablation screening is methodologically reasonable, the dual-module BiGRU architecture is clearly specified, and the real-EV validation on 20 vehicles is valuable for practical deployment. However, the central claim is currently undermined by a bidirectional look-ahead in the test protocol, which makes the predictions appear artificially accurate, and by a self-normalized SOH definition in the real-EV experiment that makes errors trivially small. The paper does not release code or provide machine-checked proofs; its value rests entirely on the experimental comparison, so the validity of that comparison is decisive.
major comments (3)
- [3.1.1, Eq. (8); 4.3; 4.4] Section 3.1.1, Eq. (8) defines the BiGRU output as the concatenation of forward and reverse hidden-state sequences, so that at every test time step the model has access to future test-sequence HI values. The experimental protocols in Sections 4.3 and 4.4 feed the complete test sequence (or the full SOH curve from month 2 onward) through this model, and the paper describes no causal masking, no recursive one-step-ahead strategy, and no statement that future test data are excluded. The reported RMSE values (e.g., 0.0026961 for Cell8 at 25% starting point in Table 4, and 0.00037008 for V15 in Table 5) may therefore reflect interpolation of the full SOH curve rather than forecasting, and the margin over unidirectional baselines could be an artifact of the evaluation protocol. The authors must re-run the evaluation with a causally valid protocol, such as one-step-ahead recursive prediction or masked future inputs, and report the resulting errors.
- [4.1, 4.2, 4.3] Sections 4.1 and 4.2 select the health indicator (MF-SVD) and tune the SSA-optimized hyperparameters using battery Cell2, and Section 4.3 then evaluates the same model on Cell1, Cell3, Cell7, and Cell8. The manuscript does not state whether SSA is re-run on each test cell or whether the Cell2-optimized parameters are transferred unchanged. If the parameters are transferred, the 'full parameter domain' claim in Section 3.2 (Table 2) applies only to Cell2, and the cross-cell results are a transfer-learning test rather than a demonstration of the optimization method's generality; if SSA is re-run per cell, the comparison with baselines that are not similarly re-tuned is not fair. The protocol must be clarified, and the authors should specify exactly which parameters were optimized, on which data, and how the comparison models were tuned.
- [4.4; Conclusions] In Section 4.4, the SOH for each real EV is computed with the maximum of that vehicle's own monthly median as the denominator, so every vehicle's SOH curve starts at 1 by construction. The reported RMSE values are therefore normalized relative to each vehicle's own starting capacity and cannot be meaningfully compared across vehicles or against the Oxford results; the Conclusions' statement that 'the highest is not more than 0.0025' is expressed in this self-referential unit. The authors should report errors in absolute capacity (Ah) or against a common denominator, and should state the corresponding absolute errors so the practical significance of the prediction accuracy can be assessed.
minor comments (5)
- [Throughout] The manuscript contains numerous typos and language errors, including 'Sigmod' in Section 3.1.1, 'Filp layer' in Section 3.2 and Figure 12, and 'pre- and post-textual information' in the abstract.
- [Figure 10] Figure 10 contains embedded Chinese text, which is not appropriate for an English-language journal and should be replaced with an English-language schematic.
- [Eq. (2)] Equation (2) is poorly formatted, and the definitions of the crest factor, pulse factor, margin factor, and kurtosis are not fully consistent with the surrounding text; please rewrite these formulas with clear variable definitions.
- [2.2; [28]] The HI extraction procedure refers to the authors' previous work [28] for technical details, but the current manuscript should be self-contained; please provide a complete description of the extraction and SVD denoising steps.
- [4.3, qualitative analysis] The text states that FM1 is below the average error 'in all cases except for battery Cell1 at 5% prediction starting point,' but Table 4 shows FM1's RMSE for Cell1 at 5% (0.032169) is below the average (0.0759); this sentence appears to be inaccurate and should be corrected.
Circularity Check
The BiGRU test protocol feeds full future HI sequences, so the reported 'predictions' are non-causal interpolations; HI extraction is delegated to a self-cited preprint, and Cell2 is used for both tuning and ablation, making several results circular by construction.
-
fitted input called prediction
[Section 3.1.1 (Eq. 8) and Section 4.1 prediction starting point protocol]
"The BiGRU consists of two layers of GRUs that can use both past and future information... processing the sequences in forward and reverse direction respectively, and finally generates the output Y_t of the whole network from the forward and reverse outputs... Since both the HI sequence and the actual SOH sequence are one-dimensional and of equal length, the first 15% and 25% of the sequential data of the HI sequence are selected as the training set, and the experiments are performed on the data after 15% and 25% of the SOH sequence, respectively."
At test time the model receives the entire post-cut HI sequence and, because it is bidirectional, each output depends on the reverse hidden state computed from future test HIs. Thus the 'prediction' at every test cycle is a function of future health-indicator values from the same battery, so the reported RMSE measures non-causal interpolation rather than forecasting. The advantage over unidirectional baselines, which cannot see the future, is therefore built into the evaluation protocol and not a genuine predictive improvement.
-
self citation load bearing
[Section 2.2, sentence after Eq. (2)]
"The more technical details of extracting HI based on ICA used in this paper can be found in our previous work [28]."
The paper's key input feature, the HI selected from the IC curve, is defined by a method whose technical details are relegated to a self-cited preprint by overlapping authors (Jia et al., arXiv:2503.23858). The present paper does not independently specify how Boundary1/Boundary2 are chosen or how the HI is computed, so the claimed 'first-principles' HI extraction is imported via a self-citation rather than from an externally verified independent source. This makes the feature-construction step load-bearing on the authors' own prior work.
1 more flagged steps
-
fitted input called prediction
[Section 3.3 Step 2 and Section 4.2 model ablation first paragraph]
"taking Cell2 cell as an example, one can take these three HIs and the margin factor without SVD treatment as training data respectively, and performs SOH prediction through the dual-module BiGRU model, and the best HI is screened out according to the prediction error... we sets up a model ablation experiment on SSA-BiGRU based on the data of battery Cell2 and the HI selection strategy derived in subsection 4.1."
The same Cell2 data are used to select the HI, to tune SSA hyperparameters, and then to demonstrate SSA-BiGRU superiority in the ablation experiments. The model and feature are chosen to minimize error on Cell2's test portion, so the Cell2 ablation results are in-sample and cannot independently support the generalization claim. The later Cell1/3/7/8 and real-EV experiments provide some outside evidence, but the Cell2-based conclusions are circular.
full rationale
The paper's headline accuracy claim for SSA-BiGRU is supported primarily by the Oxford-battery experiments (Table 4) and the real-EV experiments (Tables 5-6). The most serious circularity is the bidirectional test protocol: Eq. (8) defines each BiGRU output as a function of both forward and reverse hidden sequences, and the experiments feed the full post-training-cut HI sequence into the model. Each test output therefore uses future HI values from the same battery, making the reported RMSE a measure of non-causal interpolation rather than forecasting. This affects every reported experiment and inflates the comparison with unidirectional baselines by construction. A second circular element is the HI extraction, whose technical details are delegated to the authors' own prior work [28], so the central input feature is imported via self-citation. Third, Cell2 is used both to select the HI and to tune SSA hyperparameters and then to demonstrate SSA-BiGRU superiority in the ablation; those Cell2 numbers are in-sample. The later held-out results on Cell1/3/7/8 and V2-V20 provide some independent content, so the paper does not reduce entirely to a fitted constant, but the non-causal protocol means the claimed 'predictions' reduce in part to interpolating the test sequence. Score 6 reflects partial circularity in the central prediction claim.
Assumptions & free parameters
free parameters (5)
- SSA-tuned hyperparameters of dual-module BiGRU =
not reported (search ranges in Table 2)
- Health indicator selection (MF-SVD) =
margin factor after SVD denoising
- SVD denoising truncation =
not specified
- IC curve integration boundaries =
Boundary1, Boundary2, Position1 from prior work [28]
- Real-EV SOH denominator =
each vehicle's maximum monthly median capacity
assumptions (7)
- standard math GRU and BiGRU update equations (Section 3.1.1)
- standard math Sparrow search algorithm update rules (Section 3.1.2)
- domain assumption IC curves computed from constant-current charging data capture degradation
- domain assumption The Oxford dataset's drive-cycle protocol approximates real driving conditions
- domain assumption Monthly median charging capacity represents SOH for real EVs
- domain assumption Training on one EV (V1) generalizes to other EVs of the same model
- ad hoc to paper SVD denoising removes noise without removing degradation signal
Cite this review
Pith. "Pith review of State of health prediction of lithium-ion batteries for driving conditions based on full parameter domain sparrow search algorithm and dual-module bidirectional gated recurrent unit." pith.science (2026). https://pith.science/paper/4CCED5M4
@misc{pith2026250517405,
  author       = {Pith},
  title        = {Pith review of: State of health prediction of lithium-ion batteries for driving conditions based on full parameter domain sparrow search algorithm and dual-module bidirectional gated recurrent unit},
  year         = {2026},
  howpublished = {\url{https://pith.science/paper/4CCED5M4}},
  note         = {Machine review of arXiv:2505.17405}
}
read the original abstract
Aiming at the state of health (SOH) prediction of lithium-ion batteries (LiBs) for electric vehicles (EVs), this paper proposes a fusion model of a dual-module bidirectional gated recurrent unit (BiGRU) and sparrow search algorithm (SSA) with full parameter domain optimization. With the help of Spearman correlation analysis and ablation experiments, the indirect health indicator (HI) that can characterize the battery degradation is extracted first based on the incremental capacity (IC) curves of the Oxford battery dataset, which simulates the driving conditions. On this basis, the filtered one-dimensional HI is inputted into the dual-module BiGRU for learning the pre- and post-textual information of the input sequence and extracting the sequence features. In order to combine the different hyperparameters in the dual-module BiGRU, SSA is used to optimize the hyperparameters in the full parameter domain. The proposed SSA-BiGRU model combines the advantages and structures of SSA and BiGRU to achieve the highly accurate SOH prediction of LiBs. Studies based on the Oxford battery dataset have shown that the SSA-BiGRU model has higher accuracy, better robustness and generalization ability. Moreover, the proposed SSA-BiGRU model is tested on a real road-driven EV charging dataset and accurate SOH prediction are obtained.
Figures


Figures from the paper (16 more)







Reference graph
Works this paper leans on
-
[1]
ZhengyiBao,JiahaoNie,HuipinLin,JiahaoJiang,ZhiweiHe,andMingyuGao. Aglobal–localcontextembeddinglearningbasedsequence- free framework for state of health estimation of lithium-ion battery.Energy, 282:128306, 2023
work page 2023
-
[2]
Xiaosong Hu, Zhongwei Deng, Xianke Lin, Yi Xie, and Remus Teodorescu. Research directions for next-generation battery management solutions in automotive applications.Renewable and Sustainable Energy Reviews, 152:111695, 2021
work page 2021
-
[3]
Junyi Xia, Qionglin Shi, Haomiao Li, Min Zhou, Wei Wang, Kangli Wang, and Kai Jiang. Historical data-independent remaining useful life prediction method based on dual-input deep learning neural network.Journal of Energy Storage, 72:108427, 2023
work page 2023
-
[4]
YujieWang,JiaqiangTian,ZhendongSun,LiWang,RuilongXu,MinceLi,andZonghaiChen. Acomprehensivereviewofbatterymodeling and state estimation approaches for advanced battery management systems.Renewable and Sustainable Energy Reviews, 131:110015, 2020
work page 2020
-
[5]
Electrical energy storage for the grid: a battery of choices.Science, 334(6058):928– 935, 2011
Bruce Dunn, Haresh Kamath, and Jean-Marie Tarascon. Electrical energy storage for the grid: a battery of choices.Science, 334(6058):928– 935, 2011
work page 2011
-
[6]
Dongsheng Ren,Hungjen Hsu,Ruihe Li, XuningFeng, DongxuGuo, Xuebing Han,Languang Lu,Xiangming He, ShangGao, Junxian Hou, et al. A comparative investigation of aging effects on thermal runaway behavior of lithium-ion batteries.ETransportation, 2:100034, 2019
work page 2019
-
[7]
AnthonyBarré,BenjaminDeguilhem,SébastienGrolleau,MathiasGérard,FrédéricSuard,andDelphineRiu. Areviewonlithium-ionbattery ageing mechanisms and estimations for automotive applications.Journal of Power Sources, 241:680–689, 2013
work page 2013
-
[8]
Healthprognosticsforlithium-ionbatteries:mechanisms,methods, and prospects
YunhongChe,XiaosongHu,XiankeLin,JiaGuo,andRemusTeodorescu. Healthprognosticsforlithium-ionbatteries:mechanisms,methods, and prospects. Energy & Environmental Science, 16(2):338–371, 2023
work page 2023
Show all 41 references
-
[9]
Energy, 262:125497, 2023
ZhelinHuang,FanXu,andFangfangYang.Stateofhealthpredictionoflithium-ionbatteriesbasedonautoregressionwithexogenousvariables model. Energy, 262:125497, 2023
2023
-
[10]
Battery lifetime prognostics.Joule, 4(2):310–346, 2020
Xiaosong Hu, Le Xu, Xianke Lin, and Michael Pecht. Battery lifetime prognostics.Joule, 4(2):310–346, 2020
2020
-
[11]
Stateofhealthpredictionoflithium-ion batteries based on machine learning: advances and perspectives.iScience, 24(11):103265, 2021
XingShu,ShiquanShen,JiangweiShen,YuanjianZhang,GuangLi,ZhengChen,andYonggangLiu. Stateofhealthpredictionoflithium-ion batteries based on machine learning: advances and perspectives.iScience, 24(11):103265, 2021
2021
-
[12]
A single particle model with chemical/mechanical degradation physics for lithium ion battery state of health (soh) estimation.Applied Energy, 212:1178–1190, 2018
Jie Li, Kasim Adewuyi, Nima Lotfi, Robert G Landers, and Jonghyun Park. A single particle model with chemical/mechanical degradation physics for lithium ion battery state of health (soh) estimation.Applied Energy, 212:1178–1190, 2018
2018
-
[13]
State-of-health estimation of lithium-ion batteries for electrified vehicles using a reduced-order electrochemical model.Journal of Energy Storage, 52:104684, 2022
Seyedmehdi Hosseininasab, Changwei Lin, Stefan Pischinger, Michael Stapelbroek, and Giovanni Vagnoni. State-of-health estimation of lithium-ion batteries for electrified vehicles using a reduced-order electrochemical model.Journal of Energy Storage, 52:104684, 2022
2022
-
[14]
DatongLiu,JianbaoZhou,HaitaoLiao,YuPeng,andXiyuanPeng. Ahealthindicatorextractionandoptimizationframeworkforlithium-ion battery degradation modeling and prognostics.IEEE Transactions on Systems, Man, and Cybernetics: Systems, 45(6):915–928, 2015
2015
-
[15]
SynchronousstateofhealthestimationandremainingusefullifetimepredictionofLi-Ionbattery through optimized relevance vector machine framework.Energy, 251:123852, 2022
ZhiqiangLyu,GengWang,andRenjingGao. SynchronousstateofhealthestimationandremainingusefullifetimepredictionofLi-Ionbattery through optimized relevance vector machine framework.Energy, 251:123852, 2022
2022
-
[16]
A novel multistage support vector machine based approach for Li-ion battery remaining useful life estimation.Applied Energy, 159:285–297, 2015
Meru A Patil, Piyush Tagade, Krishnan S Hariharan, Subramanya M Kolake, Taewon Song, Taejung Yeo, and Seokgwang Doo. A novel multistage support vector machine based approach for Li-ion battery remaining useful life estimation.Applied Energy, 159:285–297, 2015
2015
-
[17]
Lithium-ion batteries health prognosis via differential thermal capacity with simulated annealing and support vector regression.Energy, 250:123829, 2022
Mingqiang Lin, Chenhao Yan, Jinhao Meng, Wei Wang, and Ji Wu. Lithium-ion batteries health prognosis via differential thermal capacity with simulated annealing and support vector regression.Energy, 250:123829, 2022
2022
-
[18]
State of health estimation of lithium-ion battery based on improved ant lion optimization and support vector regression.Journal of Energy Storage, 50:104215, 2022
Qianglong Li, Dezhi Li, Kun Zhao, Licheng Wang, and Kai Wang. State of health estimation of lithium-ion battery based on improved ant lion optimization and support vector regression.Journal of Energy Storage, 50:104215, 2022
2022
-
[19]
Jingwen Wei, Guangzhong Dong, and Zonghai Chen. Remaining useful life prediction and state of health diagnosis for lithium-ion batteries using particle filter and support vector regression.IEEE Transactions on Industrial Electronics, 65(7):5634–5643, 2017. J. Wen: Preprint sub...
2017
-
[20]
Capacity degradation prediction of lithium-ion battery based on artificial bee colony and multi-kernel support vector regression.Journal of Energy Storage, 72:108160, 2023
Kui Chen, Qiang Liao, Kai Liu, Yan Yang, Guoqiang Gao, and Guangning Wu. Capacity degradation prediction of lithium-ion battery based on artificial bee colony and multi-kernel support vector regression.Journal of Energy Storage, 72:108160, 2023
2023
-
[21]
ShuzhiZhang,BaoyuZhai,XuGuo,KaikeWang,NianPeng,andXiongwenZhang. Synchronousestimationofstateofhealthandremaining useful lifetime for lithium-ion battery using the incremental capacity and artificial neural networks.Journal of Energy Storage, 26:100951, 2019
2019
-
[22]
An indirect remaining useful life prognosis for Li-ion batteries based on health indicator and novel artificial neural network.Journal of Energy Storage, 52:104701, 2022
Ting Tang and Huimei Yuan. An indirect remaining useful life prognosis for Li-ion batteries based on health indicator and novel artificial neural network.Journal of Energy Storage, 52:104701, 2022
2022
-
[23]
Health and lifespan prediction considering degradation patterns of lithium-ion batteries based on transferable attention neural network.Energy, 279:128137, 2023
Aihua Tang, Yihan Jiang, Yuwei Nie, Quanqing Yu, Weixiang Shen, and Michael G Pecht. Health and lifespan prediction considering degradation patterns of lithium-ion batteries based on transferable attention neural network.Energy, 279:128137, 2023
2023
-
[24]
A machine-learning prediction method of lithium-ion battery life based on charge process for different applications.Applied Energy, 292:116897, 2021
Yixin Yang. A machine-learning prediction method of lithium-ion battery life based on charge process for different applications.Applied Energy, 292:116897, 2021
2021
-
[25]
Akram Eddahech, Olivier Briat, Nicolas Bertrand, Jean-Yves Delétage, and Jean-Michel Vinassa. Behavior and state-of-health monitoring of Li-ion batteries using impedance spectroscopy and recurrent neural networks.International Journal of Electrical Power & Energy Systems , 42(...
2012
-
[26]
TianyiLuo,MingLiu,PengShi,GuangrenDuan,andXibinCao. Ahybriddatapreprocessing-basedhierarchicalattentionBiLSTMnetwork for remaining useful life prediction of spacecraft lithium-ion batteries.IEEE Transactions on Neural Networks and Learning Systems, 2023
2023
-
[27]
Convolutional autoencoder- based SOH estimation of lithium-ion batteries using electrochemical impedance spectroscopy.Journal of Energy Storage, 60:106680, 2023
Josue Obregon, Yu-Ri Han, Chang Won Ho, Devanadane Mouraliraman, Chang Woo Lee, and Jae-Yoon Jung. Convolutional autoencoder- based SOH estimation of lithium-ion batteries using electrochemical impedance spectroscopy.Journal of Energy Storage, 60:106680, 2023
2023
-
[28]
Incremental capacity-based multi-feature fusion model for predicting state-of-health of lithium-ion batteries.arXiv preprint arXiv:2503.23858, 2025
Chenyu Jia, Guangshu Xia, Yuanhao Shi, Jianfang Jia, Jie Wen, and Jianchao Zeng. Incremental capacity-based multi-feature fusion model for predicting state-of-health of lithium-ion batteries.arXiv preprint arXiv:2503.23858, 2025
2025 arXiv
-
[29]
Aparametricopencircuitvoltagemodelforlithiumionbatteries
ChristopheRBirkl,EuanMcTurk,MRRoberts,PGBruce,andDAHowey. Aparametricopencircuitvoltagemodelforlithiumionbatteries. Journal of The Electrochemical Society, 162(12):A2271, 2015
2015
-
[30]
Diagnosis and prognosis of degradation in lithium-ion batteries.Department of Engineering Science, University of Oxford , 2017
RB Christoph. Diagnosis and prognosis of degradation in lithium-ion batteries.Department of Engineering Science, University of Oxford , 2017
2017
-
[31]
Ming Zhao and Xiaodong Jia. A novel strategy for signal denoising using reweighted SVD and its applications to weak fault feature enhancement of rotating machinery.Mechanical Systems and Signal Processing, 94:129–147, 2017
2017
-
[32]
Prognostics of battery capacity based on charging data and data-driven methods for on-road vehicles.Applied Energy, 339:120954, 2023
Zhongwei Deng, Le Xu, Hongao Liu, Xiaosong Hu, Zhixuan Duan, and Yu Xu. Prognostics of battery capacity based on charging data and data-driven methods for on-road vehicles.Applied Energy, 339:120954, 2023
2023
-
[33]
Learningrepresentationsbyback-propagatingerrors
DavidERumelhart,GeoffreyEHinton,andRonaldJWilliams. Learningrepresentationsbyback-propagatingerrors. Nature,323(6088):533– 536, 1986
1986
-
[34]
Long short-term memory networks for accurate state-of-charge estimation of Li-ion batteries.IEEE Transactions on Industrial Electronics, 65(8):6730–6739, 2017
Ephrem Chemali, Phillip J Kollmeyer, Matthias Preindl, Ryan Ahmed, and Ali Emadi. Long short-term memory networks for accurate state-of-charge estimation of Li-ion batteries.IEEE Transactions on Industrial Electronics, 65(8):6730–6739, 2017
2017
-
[35]
Long short-term memory.Neural Computation, 9(8):1735–1780, 1997
Sepp Hochreiter and Jürgen Schmidhuber. Long short-term memory.Neural Computation, 9(8):1735–1780, 1997
1997
-
[36]
KyunghyunCho,BartVanMerriënboer,CaglarGulcehre,DzmitryBahdanau,FethiBougares,HolgerSchwenk,andYoshuaBengio.Learning phrase representations using RNN encoder-decoder for statistical machine translation.arXiv preprint arXiv:1406.1078, 2014
2014 arXiv
-
[37]
A novel swarm intelligence optimization approach: sparrow search algorithm.Systems Science & Control Engineering, 8(1):22–34, 2020
Jiankai Xue and Bo Shen. A novel swarm intelligence optimization approach: sparrow search algorithm.Systems Science & Control Engineering, 8(1):22–34, 2020
2020
-
[38]
Improved whale optimization algorithm.Application Research of Computers, 37(12):3618–3621, 2020
Zequan Wu and Yongmin Mu. Improved whale optimization algorithm.Application Research of Computers, 37(12):3618–3621, 2020
2020
-
[39]
Squeeze-and-excitation networks.IEEE Transactions on Pattern Analysis and Machine Intelligence, 42(8):2011–2023, 2020
Jie Hu, Li Shen, Samuel Albanie, Gang Sun, and Enhua Wu. Squeeze-and-excitation networks.IEEE Transactions on Pattern Analysis and Machine Intelligence, 42(8):2011–2023, 2020
2011
-
[40]
Cloud computing beckons scientists.Nature, 509(7502):543–544, 2014
Nadia Drake et al. Cloud computing beckons scientists.Nature, 509(7502):543–544, 2014
2014
-
[41]
The internet of things comes to the lab.Nature, 542(7639):125–126, 2017
Jeffrey M Perkel. The internet of things comes to the lab.Nature, 542(7639):125–126, 2017. J. Wen: Preprint submitted to Elsevier Page 25 of 25
2017
Reviewed August 7, 2026 · model on record in the stance chip above.
Discussion (0). Sign in to comment.