REVIEW 4 major objections 5 minor 84 references
DataWink: Reusing and Adapting SVG-based Visualization Examples with Large Multimodal Models
T0 review · 4 major / 5 minor · reviewed 2026-08-15 · deepseek-v4-flash
Pith's one-line read DataWink claims that a chain of large multimodal models can turn an existing SVG-based visualization—even one with heavy decoration and non-standard encodings—into a reusable, parameterized template, so that non-experts can swap in new…
desk verdict A genuinely useful systems paper that turns decorated SVG charts into adaptable templates via an LMM pipeline, with an honest user study whose evidence is narrower than the conclusion claims. read the letter →
The pith
A machine-rendered reading of the paper's core claim, the machinery that carries it, and where it could break.
The reading
What carries the argument
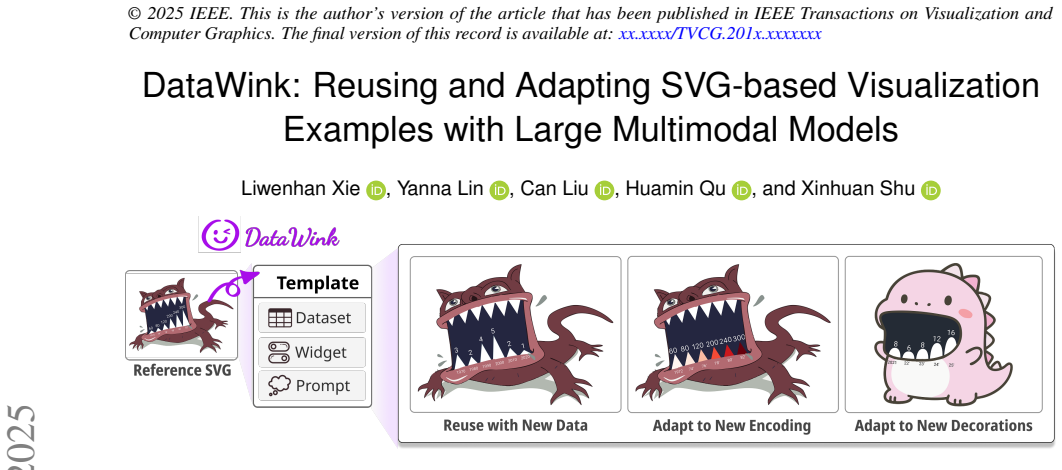
The load-bearing object is the intermediate representation of a visualization: a layered abstraction that splits an SVG into data-driven layers (marks, axes, legends), text layers, decorative layers, and configuration layers, with per-layer properties such as mark types, data-encoded attributes, origin, and bounding box. It is produced by a three-step LMM chain—role identification and data extraction, semantic enrichment with natural-language descriptions, and final representation generation—and it is what lets the pipeline regenerate a D3 template rather than merely re-skin the original file. The second mechanism is dynamic refinement: user requests are converted into minimal edits to the template and into on-demand widgets (sliders, color pickers, inputs), whose parameters are linked back to the program, so fine-tuning happens through direct manipulation rather than repeated prompting.
What would settle it
Give the pipeline a set of decorated SVG charts with known ground-truth data and check whether the recovered numbers match the originals and whether, after swapping in new data, decorative dependencies such as shadow lengths and contact points still track their parent marks; a substantial failure rate on either check would refute the central claim.
Extended reading notes
Core claim
The paper proposes a two-phase pipeline. In the decomposition phase, an SVG reference is preprocessed—each visual element gets an identity and redundant markup is stripped—and then a chained LMM reads the simplified SVG plus a downscaled raster rendering to group elements into four layers: data-driven, text, decorative, and configuration. The chain also extracts the underlying dataset and enriches element groups with natural-language descriptions, producing an intermediate representation that stands between raw SVG and a visualization program. In the construction phase, another LMM synthesizes a D3 program that regenerates the data-driven layers from parameters, preserving the original design including dependencies such as shadow shapes tied to parent bars. The DataWink interface wraps this template in a data table, a template inspector, direct canvas manipulation, and a chat agent that turns user requests into live widgets. The paper's claim is that this combination makes reuse and adaptation faster and more effective than conventional editing or generic LMM prompting.
Load-bearing premise
The load-bearing premise is that the large multimodal model chain can reliably read the structure and data values out of a simplified SVG picture and write an editable template that keeps the decorative relationships intact; if that works only for simple or regular charts, the central claim about general reuse and democratization is not established.
Editorial extensions
If this is right
- A user with no D3 experience can load a decorated SVG, upload a CSV with the right column types, and get a chart that keeps the reference's graphical design, because data binding is handled by the generated template.
- Adaptation requests expressed in natural language do not require the user to know SVG internals: the system creates widgets for new parameters, letting the user steer values directly.
- Non-standard decorative dependencies—such as shadow parallelograms whose angles and contact points must track their parent bars—can survive a data swap, which the user study showed is the step where conventional tools fail.
- Because the template exposes the intermediate representation and generated program, advanced users can inspect or patch the mapping, making the AI's understanding auditable rather than a black box.
- By-example authoring of this kind can lower the barrier to personalized, aesthetically rich visualization, since the 'design' step is reduced to choosing and adapting an existing high-quality example.
Reading between the lines
- A testable extension is whether the same role-labeled intermediate representation could also feed accessibility tools, chart search, or automated style transfer, since the paper already makes those roles explicit.
- The pipeline's reliability is likely to degrade as SVG structure becomes less regular; the paper itself sets hand-drawn sketches and bitmap infographics out of scope, so a stress test on icon-heavy or pictorial charts with shared masks would reveal how much of the claim generalizes.
- Because the paper identifies propagated errors in early LMM chain steps as a failure mode, a concrete improvement left implicit is a verification step in which the model compares its generated SVG against the reference before presenting a template.
- The published prompt templates and generated intermediate representations could double as a benchmark suite for measuring how well LMMs understand SVG structure, giving the visualization community a reusable testbed.
Signed reviews
Editorial analysis
A structured set of objections, weighed in public.
Referee Report
Summary. The paper presents DataWink, an LMM-powered pipeline and interface for reusing and adapting SVG-based visualization examples. The pipeline decomposes an input SVG into an intermediate representation (data-driven, text, decorative, and configuration layers), then synthesizes a D3-based template with parameterized controls; the interface supports data replacement, chat-based adaptation, dynamically generated widgets, and direct manipulation. The evaluation is a within-subjects user study (N=12) with a replication task comparing DataWink against a mix of familiar commercial tools, followed by an open-ended redesign task and Likert questionnaires. The authors claim that DataWink enables faster and more effective reuse and adaptation of visualizations compared with conventional tools while aligning with users' creative workflows.
Significance. If the broad claim holds, DataWink would be a valuable contribution to example-driven visualization authoring, extending prior work on standard charts and timelines to decorated, non-standard SVG visualizations. The paper's strengths include a well-motivated intermediate representation, a transparently reported and reproducible implementation (source code and prompt templates are released), a structured user study with qualitative findings, and an unusually candid limitations section. However, the central generalization is not yet fully established: the quantitative user-study comparison rests on a single curated reference chart, and Section 7.1 explicitly concedes that the LMM chain is prone to propagated errors that constrain applicability to more advanced visualization types. The contribution is promising and publishable in principle, but the evidence as presented supports a more narrowly scoped claim than the conclusion states.
major comments (4)
- [§6.4, Fig. 5] The sentence stating that 'participants in the DataWink condition achieved a significantly higher performance' is not supported by any reported statistical test for the completion-rate data. Fig. 5 shows only percentages, with no p-values, effect sizes, or per-subtask raw counts. Please either add an appropriate statistical analysis (e.g., McNemar or a mixed-effects model on subtask completion) or remove the word 'significantly' and describe the result as a descriptive difference.
- [§6.1, §6.4, §7.1] The quantitative comparison in Task A uses a single reference visualization (the Window chart), and the gallery adds only three author-selected examples. Section 7.1 concedes that the method 'operates upon LMM chains, which are prone to propagated errors at early stages' and that this 'constrains its applicability to more advanced visualization types.' Since all downstream user-facing capabilities presuppose reliable decomposition and templating, the conclusion that DataWink enables faster and more effective reuse and adaptation of visualizations in general is not established by the current evidence. I suggest either adding a pipeline-reliability evaluation over a broader corpus of decorated SVG charts or carefully qualifying the conclusion to the demonstrated chart class.
- [§6.1] The baseline condition is not a fixed tool: participants could mix any commercial tools they were familiar with, including ChatGPT and Gemini, which are the same model family that powers DataWink. This confound makes it difficult to attribute the observed differences to the DataWink pipeline and interface rather than to tool choice, prior familiarity, or the absence of a structured pipeline in the baseline. Please report which tools each participant actually used and discuss whether the comparison holds when controlling for tool familiarity or model family.
- [§6.4, Fig. 5] There is a potential inconsistency between the claim that all N=12 participants 'could finish data adaptation tasks, maintain original visual decorations, and perform global chart adjustment' and the statement that N=4 participants 'failed to control the data-driven shadows and ran out of time before synthesizing accurate gradients.' Please clarify which subtasks count toward completion, how the completion criteria were applied uniformly, and how partial completion or timeout was coded in the reported rates.
minor comments (5)
- [§6.4, Fig. 5] The completion-rate visualization should include raw counts or confidence intervals, and the figure caption should state the denominator for each percentage to make the rates interpretable with N=12.
- [§3.2] The intermediate representation is described with a bullet-list pseudo-grammar; a formal schema or a small JSON example would make the representation concrete and facilitate replication by other researchers.
- [§4.4] The GitHub URL is broken across a line break in the rendered text; please provide a single clickable URL for the source code and prompts.
- [§6.2] The limitation paragraph in §6.1 mentions sample size and baseline tool choice, but not the participants' shared cultural and linguistic background, which is relevant to the generalizability of findings about natural-language interaction and workflow fit.
- [Fig. 6] Since reverse-coded items were flipped for reporting, the caption should indicate the original wording of those items or note that all ratings were normalized so that higher values imply stronger agreement.
Circularity Check
No significant circularity: the central claims rest on a user study and a concrete SVG-to-template pipeline, not on fitted inputs or self-citation chains.
full rationale
The paper's derivation chain is not circular. The core technical claim is that an LMM pipeline can convert an SVG visualization into an intermediate representation and then into a D3-based template; the core evaluation claim is that users complete replication and redesign tasks faster and more effectively with DataWink than with familiar commercial tools. Neither claim is defined in terms of the other. The intermediate representation is defined independently of the template output (Section 3.2), and the pipeline's outputs are produced by LMM prompts on a preprocessed SVG plus a raster image, not by fitting parameters to the evaluation results. The template synthesis step (Section 3.4.1) uses the parsed original data to replicate the reference, but this is an implementation detail of the system under test, not a hidden reuse of the evaluation outcome. The user study (Section 6) is an empirical, externally observable comparison with a counterbalanced within-subjects design, screen recordings, task completion rates, and questionnaire responses; the completion criteria in Fig. 5 are concrete output states rather than LMM self-assessments or the paper's own predicted scores. The paper honestly discloses load-bearing limitations in Section 7.1, including LMM-chain error propagation, long prompts, and restricted applicability to more advanced visualization types; this transparency does not make the method circular. There are self-citations to prior works by the same authors (e.g., MetaGlyph [77], WaitGPT [75], Wakey-Wakey [76], GVVST [60], and the timeline work [84]), but these are used as related-work context and inspiration, not as the justification for DataWink's central claims; no uniqueness theorem or load-bearing result is imported from them. The code and prompt templates are made publicly available, providing independent reproducibility support. A weak external ground truth for extracted data and template fidelity is a validity concern, not a circularity concern, because the paper never asserts an equation or a fitted quantity that is equivalent to its own input by construction.
Assumptions & free parameters
free parameters (4)
- SVG decimal precision threshold =
2 decimal places
- Raster image max width =
400 pixels
- One-shot example chart =
A bar chart example
- LMM backbone =
GPT-4o-mini, GPT-4o-128k
assumptions (4)
- domain assumption SVG files contain enough structural information to recover the data values and encoding scheme of the original visualization.
- ad hoc to paper Large multimodal models (GPT-4o and GPT-4o-mini) can reliably perform role identification, data extraction, and D3 code synthesis from a simplified SVG plus a raster image.
- domain assumption The proposed four-layer intermediate representation is expressive enough to cover the target class of decorated, data-driven SVG visualizations.
- domain assumption User study participants' behavior and self-reports predict the experience of the intended non-expert user population.
invented entities (3)
-
Intermediate representation of visualizations
independent evidence
-
Slot-based SVG (marked-up SVG with custom XML markers)
independent evidence
-
Dynamic widget synthesis
independent evidence
Cite this review
Pith. "Pith review of DataWink: Reusing and Adapting SVG-based Visualization Examples with Large Multimodal Models." pith.science (2026). https://pith.science/paper/4F4MQ4AI
@misc{pith2026250717734,
  author       = {Pith},
  title        = {Pith review of: DataWink: Reusing and Adapting SVG-based Visualization Examples with Large Multimodal Models},
  year         = {2026},
  howpublished = {\url{https://pith.science/paper/4F4MQ4AI}},
  note         = {Machine review of arXiv:2507.17734}
}
read the original abstract
Creating aesthetically pleasing data visualizations remains challenging for users without design expertise or familiarity with visualization tools. To address this gap, we present DataWink, a system that enables users to create custom visualizations by adapting high-quality examples. Our approach combines large multimodal models (LMMs) to extract data encoding from existing SVG-based visualization examples, featuring an intermediate representation of visualizations that bridges primitive SVG and visualization programs. Users may express adaptation goals to a conversational agent and control the visual appearance through widgets generated on demand. With an interactive interface, users can modify both data mappings and visual design elements while maintaining the original visualization's aesthetic quality. To evaluate DataWink, we conduct a user study (N=12) with replication and free-form exploration tasks. As a result, DataWink is recognized for its learnability and effectiveness in personalized authoring tasks. Our results demonstrate the potential of example-driven approaches for democratizing visualization creation.
Figures


Figures from the paper (3 more)


Reference graph
Works this paper leans on
-
[3]
A. Bigelow, S. Drucker, D. Fisher, and M. Meyer. Reflections on how designers design with data. In Proc. AVI, pp. 17–24. ACM, 2014. doi: 10. 1145/2598153.2598175 2
arXiv 2014
-
[5]
M. A. Borkin, Z. Bylinskii, N. W. Kim, C. M. Bainbridge, C. S. Yeh, D. Borkin, H. Pfister, and A. Oliva. Beyond memorability: Visualization recognition and recall. IEEE Trans. Vis. Comput. Graph., 22(1):519–528,
-
[6]
Bostock, V
M. Bostock, V . Ogievetsky, and J. Heer. D 3: Data-driven documents. IEEE Trans. Vis. Comput. Graph., 17(12):2301–2309, 2011. doi: 10.1109/ TVCG.2011.185 3, 4, 9
2011
-
[7]
A. Cairo. The art of insight: How great visualization designers think. John Wiley & Sons, 2023. 1
2023
-
[8]
C. Chen, H. K. Bako, P. Yu, J. Hooker, J. Joyal, S. C. Wang, S. Kim, J. Wu, A. Ding, L. Sandeep, A. Chen, C. Sinha, and Z. Liu. VisAnatomy: An SVG chart corpus with fine-grained semantic labels. arXiv:2410.12268,
-
[9]
C. Chen, B. Lee, Y . Wang, Y . Chang, and Z. Liu. Mystique: Deconstructing SVG charts for layout reuse. IEEE Trans. Vis. Comput. Graph., 30(1):447– 457, 2024. doi: 10.1109/TVCG.2023.3327354 2
arXiv 2024
-
[10]
Q. Chen, W. Shuai, J. Zhang, Z. Sun, and N. Cao. Beyond numbers: Creating analogies to enhance data comprehension and communication with generative AI. In Proc. CHI, article no. 377, 14 pages. ACM, 2024. doi: 10.1145/3613904.3642480 2
arXiv 2024
- [11]
Show all 84 references
-
[12]
Coelho and K
D. Coelho and K. Mueller. Infomages: Embedding data into thematic images. Comput. Graph. Forum, 39(3):593–606, 2020. doi: 10.1111/cgf. 14004 1
2020 doi
-
[14]
Dahary, M
O. Dahary, M. Lu, O. Patashnik, and D. Cohen-Or. PictorialAttributes: Depicting multiple attributes with realistic imaging. In ACM SIGGRAPH 2024 Posters, article no. 69, 2 pages. ACM, 2024. doi: 10.1145/3641234. 3671072 9
2024 doi
-
[15]
Di Bartolomeo, V
S. Di Bartolomeo, V . Schetinger, J. L. Adams, A. M. McNutt, M. El- Assady, and M. Miller. Doom or deliciousness: Challenges and opportu- nities for visualization in the age of generative models. Comput. Graph. Forum, 42(3):423–435, 2023. doi: 10.1111/cgf.14841 2
2023 doi
-
[16]
S. Dou, X. Jiang, L. Liu, L. Ying, C. Shan, Y . Shen, X. Dong, Y . Wang, D. Li, and C. Zhao. Hierarchically recognizing vector graphics and a new chart-based vector graphics dataset. IEEE Trans. Pattern Anal. Mach. Intell., 46(12):7556–7573, 2024. doi: 10.1109/TPAMI.2024.3394298 2
2024
-
[17]
J. Ge, Z. Z. Wang, X. Zhou, Y .-H. Peng, S. Subramanian, Q. Tan, M. Sap, A. Suhr, D. Fried, G. Neubig, and T. Darrell. AutoPresent: Designing structured visuals from scratch. In Proc. CVPR, 2025. arXiv:2501.00912. 9
2025 arXiv
-
[18]
Goswami, P
K. Goswami, P. Mathur, R. Rossi, and F. Dernoncourt. PlotEdit: Natural language-driven accessible chart editing in PDFs via multimodal LLM agents. In Proc. ECIR, pp. 130–134. Springer, 2025. doi: 10.1007/978-3 -031-88720-8_22 1
2025 doi
-
[19]
Harper and M
J. Harper and M. Agrawala. Deconstructing and restyling D3 visualiza- tions. In Proc. UIST, pp. 253–262. ACM, 2014. doi: 10.1145/2642918. 2647411 2
2014 doi
-
[20]
Harper and M
J. Harper and M. Agrawala. Converting basic D3 charts into reusable style templates. IEEE Trans. Vis. Comput. Graph., 24(3):1274–1286, 2018. doi: 10.1109/TVCG.2017.2659744 2
2018
-
[21]
Harrison, K
L. Harrison, K. Reinecke, and R. Chang. Infographic aesthetics: Designing for the first impression. In Proc. CHI, pp. 1187–1190. ACM, 2015. doi: 10.1145/2702123.2702545 1
2015
-
[22]
Y . He, K. Xu, S. Cao, Y . Shi, Q. Chen, and N. Cao. Leveraging foundation models for crafting narrative visualization: A survey. IEEE Trans. Vis. Comput. Graph., 2025. Early Access. doi: 10.1109/TVCG.2025.3542504 2
2025
-
[23]
D. Jung, W. Kim, H. Song, J.-i. Hwang, B. Lee, B. Kim, and J. Seo. ChartSense: Interactive data extraction from chart images. In Proc. CHI, pp. 6706–6717. ACM, 2017. doi: 10.1145/3025453.3025957 2
2017
-
[24]
Kembhavi, M
A. Kembhavi, M. Salvato, E. Kolve, M. Seo, H. Hajishirzi, and A. Farhadi. A diagram is worth a dozen images. InProc. ECCV, pp. 235–251. Springer,
-
[25]
N. W. Kim, E. Schweickart, Z. Liu, M. Dontcheva, W. Li, J. Popovic, and H. Pfister. Data-Driven Guides: Supporting expressive design for information graphics. IEEE Trans. Vis. Comput. Graph., 23(1):491–500,
-
[26]
doi: 10.1007/978-3-319-46493-0_15 2
-
[27]
Kumar, J
R. Kumar, J. O. Talton, S. Ahmad, and S. R. Klemmer. Bricolage: Example-based retargeting for web design. In Proc. CHI, pp. 2197–2206. ACM, 2011. doi: 10.1145/1978942.1979262 2
2011
-
[28]
doi: 10.1109/TVCG.2016.2598620 2
2016
-
[29]
T. S. Kim, D. Choi, Y . Choi, and J. Kim. Stylette: Styling the web with natural language. In Proc. CHI, article no. 5, 17 pages. ACM, 2022. doi: 10.1145/3491102.3501931 1
2022
-
[30]
V . Liu, R. H. Kazi, L.-Y . Wei, M. Fisher, T. Langlois, S. Walker, and L. Chilton. Logomotion: Visually-grounded code synthesis for creating and editing animation. In Proc. CHI, article no. 157, 16 pages. ACM,
-
[31]
J. R. Lewis. The system usability scale: Past, present, and future. Int. J. Hum.-Comput. Interact., 34(7):577–590, 2018. doi: 10.1080/10447318. 2018.1455307 7
2018
-
[32]
T. F. Liu, M. Craft, J. Situ, E. Yumer, R. Mech, and R. Kumar. Learning design semantics for mobile apps. In Proc. UIST, 11 pages, pp. 569–579. ACM, 2018. doi: 10.1145/3242587.3242650 2
2018
-
[33]
M. Lu, C. Wang, J. Lanir, N. Zhao, H. Pfister, D. Cohen-Or, and H. Huang. Exploring visual information flows in infographics. In Proc. CHI, article no. 136, 12 pages. ACM, 2020. doi: 10.1145/3313831.3376263 2
2020
-
[34]
Y . Lu, A. Leung, A. Swearngin, J. Nichols, and T. Barik. Misty: UI prototyping through interactive conceptual blending. In Proc. CHI, article no. 1108, 17 pages. ACM, 2025. doi: 10.1145/3706598.3713924 2
2025
-
[36]
Z. Liu, J. Thompson, A. Wilson, M. Dontcheva, J. Delorey, S. Grigg, B. Kerr, and J. Stasko. Data Illustrator: Augmenting vector design tools with lazy data binding for expressive visualization authoring. In Proc. CHI, 13 pages. ACM, 2018. doi: 10.1145/3173574.3173697 2
2018
-
[37]
Madan, Z
S. Madan, Z. Bylinskii, C. Nobre, M. Tancik, A. Recasens, K. Zhong, S. Alsheikh, A. Oliva, F. Durand, and H. Pfister. Parsing and summarizing infographics with synthetically trained icon detection. In Proc. PacificVis, pp. 31–40, 2021. doi: 10.1109/PacificVis52677.2021.00012 2
2021
-
[38]
Masson, S
D. Masson, S. Malacria, D. V ogel, E. Lank, and G. Casiez. ChartDetective: Easy and accurate interactive data extraction from complex vector charts. In Proc. CHI, article no. 147, 17 pages. ACM, 2023. doi: 10.1145/3544548 .3581113 2
2023 doi
-
[39]
J. Luo, Z. Li, J. Wang, and C.-Y . Lin. ChartOCR: Data extraction from charts images via a deep hybrid framework. In Proc. WACV, pp. 1917– 1925, 2021. doi: 10.1109/W ACV48630.2021.00196 2
1917
-
[40]
G. Lupi, S. Posavec, and M. Popova. Dear Data. Princeton Architectural Press, 2016. 1
2016
-
[41]
Offenwanger, T
A. Offenwanger, T. Tsandilas, and F. Chevalier. DataGarden: Formalizing personal sketches into structured visualization templates. IEEE Trans. Vis. Comput. Graph., 31(1):1268–1278, 2025. doi: 10.1109/TVCG.2024. 3456336 2, 3, 9
2025 doi
-
[42]
P. Parsons. Understanding data visualization design practice. IEEE Trans. Vis. Comput. Graph., 28(1):665–675, 2023. doi: 10.1109/TVCG.2021. 3114959 1
2023 doi
-
[43]
A. M. McNutt and R. Chugh. Integrated visualization editing via parame- terized declarative templates. In Proc. CHI, article no. 17, 14 pages. ACM,
-
[44]
Pollock, C
J. Pollock, C. Mei, G. Huang, E. Evans, D. Jackson, and A. Satyanarayan. Bluefish: Composing diagrams with declarative relations. In Proc. UIST, article no. 23, 21 pages, 2024. doi: 10.1145/3654777.3676465 9
2024
-
[45]
G. G. Méndez, M. A. Nacenta, and S. Vandenheste. iV oLVER: Interactive visual language for visualization extraction and reconstruction. In Proc. CHI, pp. 4073–4085. ACM, 2016. doi: 10.1145/2858036.2858435 2
2016
-
[47]
D. Ren, B. Lee, and M. Brehmer. Charticulator: Interactive construction of bespoke chart layouts. IEEE Trans. Vis. Comput. Graph., 25(1):789–799,
-
[48]
Poco and J
J. Poco and J. Heer. Reverse-engineering visualizations: Recovering visual encodings from chart images. Comput. Graph. Forum, 36(3):353–363,
-
[49]
Satyanarayan, D
A. Satyanarayan, D. Moritz, K. Wongsuphasawat, and J. Heer. Vega-lite: A grammar of interactive graphics. IEEE Trans. Vis. Comput. Graph., 23(1):341–350, 2016. doi: 10.1109/TVCG.2016.2599030 9
2016
-
[50]
Savva, N
M. Savva, N. Kong, A. Chhajta, L. Fei-Fei, M. Agrawala, and J. Heer. ReVision: Automated classification, analysis and redesign of chart images. In Proc. UIST, pp. 393–402, 2011. doi: 10.1145/2047196.2047247 2
2011
-
[51]
A. Qi, T. Tsandilas, A. Shamir, and A. Bousseau. Sketch2Data: Recov- ering data from hand-drawn infographics. Comput. Graph., article no. 104251, 14 pages, 2025. doi: 10.1016/j.cag.2025.104251 2, 9
2025
-
[52]
L. Shen, H. Li, Y . Wang, T. Luo, Y . Luo, and H. Qu. Data Playwright: Authoring data videos with annotated narration. IEEE Trans. Vis. Comput. Graph., 2024. Early Access. doi: 10.1109/TVCG.2024.3477926 2
2024
-
[53]
C. Shi, C. Yang, Y . Liu, B. Shui, J. Wang, M. Jing, L. Xu, X. Zhu, S. Li, Y . Zhang, G. Liu, X. Nie, D. Cai, and Y . Yang. ChartMimic: Evaluating LMM’s cross-modal reasoning capability via chart-to-code generation. In Proc. ICLR, 57 pages, 2025. arXiv:2406.09961. 1, 2
2025 arXiv
-
[54]
X. Shi, Y . Wang, R. Rossi, and J. Zhao. Brickify: Enabling expressive design intent specification through direct manipulation on design tokens. In Proc. CHI, article no. 424, 20 pages. ACM, 2025. doi: 10.1145/3706598 .3714087 9
2025 doi
-
[55]
Satyanarayan, B
A. Satyanarayan, B. Lee, D. Ren, J. Heer, J. Stasko, J. Thompson, M. Brehmer, and Z. Liu. Critical reflections on visualization author- ing systems. IEEE Trans. Vis. Comput. Graph., 26(1):461–471, 2019. doi: 10.1109/TVCG.2019.2934281 2
2019
-
[57]
H. V . Shin, J. Warner, B. Hartmann, C. Gomes, H. Winnemoeller, and W. Li. Multi-level correspondence via graph kernels for editing vector graphics designs. In Proc. GI, pp. 97–107. CHCSS/SCDHM, 2021. doi: 10.20380/GI2021.12 2
2021 doi
-
[58]
Schöttler, J
S. Schöttler, J. Dykes, J. Wood, U. Hinrichs, and B. Bach. Constraint-based breakpoints for responsive visualization design and development. IEEE Trans. Vis. Comput. Graph., 2024. Early Access. doi: 10.1109/TVCG. 2024.3410097 9
2024
-
[59]
D. V . Society. Information is beautiful awards. https://www. informationisbeautifulawards.com/about, 2025. Accessed on March 25, 2025. 9
2025
-
[60]
S. Song, Y . Zhang, Y . Lin, H. Qu, C. Wang, and C. Li. GVVST: Image- driven style extraction from graph visualizations for visual style transfer. IEEE Trans. Vis. Comput. Graph. , 2024. Early Access. doi: 10.1109/ TVCG.2024.3485701 2
2024
-
[61]
Stefaner
M. Stefaner. Crisis? What crisis?—Why 2024 was a dead year for indie dataviz – and how we’ll do much better in 2025. https: //truth-and-beauty.net/texts/crisis-what-crisis . Accessed on March 25, 2025. 9
2024
-
[62]
Y . Shi, T. Gao, X. Jiao, and N. Cao. Understanding design collaboration between designers and artificial intelligence: A systematic literature review. Proceedings of the ACM on Human-Computer Interaction, 7(CSCW2), article no. 368, 35 pages, 2023. doi: 10.1145/3610217 2
2023 doi
-
[63]
Tsandilas
T. Tsandilas. StructGraphics: Flexible visualization design through data- agnostic and reusable graphical structures. IEEE Trans. Vis. Comput. Graph., 27(2):315–325, 2020. doi: 10.1109/TVCG.2020.3030476 2
2020
-
[64]
Vaithilingam, E
P. Vaithilingam, E. L. Glassman, J. P. Inala, and C. Wang. DynaVis: Dy- namically synthesized UI widgets for visualization editing. In Proc. CHI, article no. 985, 17 pages. ACM, 2024. doi: 10.1145/3613904.3642639 1, 2, 4
2024
-
[65]
L. S. Snyder, C. Wang, and S. Drucker. Challenges & opportunities with llm-assisted visualization retargeting. ArXiv Preprint, 5 pages, 2025. doi: 10.48550/arXiv.2507.01436 1
2025 doi
-
[66]
Warner, K
J. Warner, K. W. Kim, and B. Hartmann. Interactive flexible style transfer for vector graphics. In Proc. UIST, article no. 49, 14 pages. ACM, 2023. doi: 10.1145/3586183.3606751 2
2023
-
[67]
Wilkinson
L. Wilkinson. The grammar of graphics. In Handbook of computational statistics: Concepts and methods, pp. 375–414. Springer, 2011. doi: 10. 1007/0-387-28695-0 9
2011
-
[68]
A. Wu, Y . Wang, X. Shu, D. Moritz, W. Cui, H. Zhang, D. Zhang, and H. Qu. AI4VIS: Survey on artificial intelligence approaches for data visualization. IEEE Trans. Vis. Comput. Graph., 28(12):5049–5070, 2022. doi: 10.1109/TVCG.2021.3099002 2
2022
-
[69]
Y . Tian, W. Cui, D. Deng, X. Yi, Y . Yang, H. Zhang, and Y . Wu. ChartGPT: Leveraging LLMs to generate charts from abstract natural language. IEEE Trans. Vis. Comput. Graph., 31(3):1731–1745, 2025. doi: 10.1109/TVCG. 2024.3368621 2
2025
-
[70]
S. Wu. What killed innovation? https://www.shirleywu.studio/ notebook/2025-02-innovation-killer . Accessed on March 25,
2025
-
[71]
H. Xia, N. Henry Riche, F. Chevalier, B. De Araujo, and D. Wigdor. DataInk: Direct and creative data-oriented drawing. In Proc. CHI, article no. 223, 13 pages. ACM, 2018. doi: 10.1145/3173574.3173797 3
2018
-
[72]
C. Wang, B. Lee, S. Drucker, D. Marshall, and J. Gao. Data Formulator 2: iterative creation of data visualizations, with AI transforming data along the way. In Proc. CHI, article no. 677, 17 pages. ACM, 2025. doi: 10. 1145/3706598.3713296 2
2025
-
[73]
S. Xiao, S. Huang, Y . Lin, Y . Ye, and W. Zeng. Let the chart spark: Embedding semantic context into chart with text-to-image generative model. IEEE Trans. Vis. Comput. Graph., 30(1):284–294, 2023. doi: 10. 1109/TVCG.2023.3326913 2, 9
2023
-
[74]
S. Xiao, L. Wang, X. Ma, and W. Zeng. TypeDance: Creating seman- tic typographic logos from image through personalized generation. In Proc. CHI, article no. 175, 18 pages. ACM, 2024. doi: 10.1145/3613904. 3642185 2
2024 doi
-
[75]
L. Xie, C. Zheng, H. Xia, H. Qu, and C. Zhu-Tian. WaitGPT: Monitoring and steering conversational LLM agent in data analysis with on-the-fly code visualization. In Proc. UIST, article no. 52, 14 pages. ACM, 2024. doi: 10.1145/3654777.3676374 2
2024
-
[76]
R. Wu, W. Su, and J. Liao. Chat2SVG: Vector graphics generation with large language models and image diffusion models. In Proc. CVPR, 2025. arXiv:2411.16602. 9
2025
-
[77]
L. Ying, X. Shu, D. Deng, Y . Yang, T. Tang, L. Yu, and Y . Wu. MetaGlyph: Automatic generation of metaphoric glyph-based visualization. IEEE Trans. Vis. Comput. Graph., 29(1):331–341, 2022. doi: 10.1109/TVCG. 2022.3209447 1, 2
2022
-
[78]
L.-P. Yuan, W. Zeng, S. Fu, Z. Zeng, H. Li, C.-W. Fu, and H. Qu. Deep colormap extraction from visualizations. IEEE Trans. Vis. Comput. Graph., 28(12):4048–4060, 2021. doi: 10.1109/TVCG.2021.3070876 2
2021
-
[79]
S. Xiao, Y . Hou, C. Jin, and W. Zeng. WYTIWYR: A user intent-aware framework with multi-modal inputs for visualization retrieval. Comput. Graph. Forum, 42(3):311–322, 2023. doi: 10.1111/cgf.14832 9
2023 doi
-
[80]
Zhang, J
S. Zhang, J. Ma, J. Wu, D. Ritchie, and M. Agrawala. Editing motion graphics video via motion vectorization and transformation. ACM Trans. Gr., 42(6), article no. 229, 13 pages, 2023. doi: 10.1145/3618316 2
2023 doi
-
[81]
Zhang, R
Y . Zhang, R. Jiang, L. Xie, Y . Zhao, C. Liu, T. Ding, S. Chen, and X. Yuan. OldVisOnline: Curating a dataset of historical visualizations. IEEE Trans. Vis. Comput. Graph., 30(1):551–561, 2024. doi: 10.1109/TVCG.2023. 3326908 9
2024 doi
-
[82]
T. Zhou, G. Y .-Y . Chan, S. Guo, J. Hoffswell, C. Xiao, V . S. Bursztyn, and E. Koh. Data Pictorial: Deconstructing raster images for data-aware animated vector posters. In Proc. UIST Adjunct, article no. 98, 3 pages. ACM, 2024. doi: 10.1145/3672539.3686353 2
2024
-
[83]
L. Xie, Z. Zhou, K. Yu, Y . Wang, H. Qu, and S. Chen. Wakey-Wakey: Animate text by mimicking characters in a GIF. In Proc. UIST, article no. 98, 14 pages. ACM, 2023. doi: 10.1145/3586183.3606813 2
2023
-
[84]
Zhu-Tian, Y
C. Zhu-Tian, Y . Wang, Q. Wang, Y . Wang, and H. Qu. Towards automated infographic design: Deep learning-based auto-extraction of extensible timeline. IEEE Trans. Vis. Comput. Graph., 26(1):917–926, 2019. doi: 10. 1109/TVCG.2019.2934810 1, 2, 4 11
2019
-
[86]
J. E. Zhang, N. Sultanum, A. Bezerianos, and F. Chevalier. DataQuilt: Extracting visual elements from images to craft pictorial visualizations. In Proc. CHI, article no. 45, 13 pages. ACM, 2020. doi: 10.1145/3313831. 3376172 1, 2
2020 doi
-
[90]
T. Zhou, J. Huang, and G. Y .-Y . Chan. Epigraphics: Message-driven infographics authoring. In Proc. CHI, 18 pages. ACM, 2024. doi: 10. 1145/3613904.3642172 2
2024
-
[2016]
doi: 10.1109/TVCG.2015.2467732 1
2015
-
[2017]
This is the author’s version of the article that has been published in IEEE Transactions on Visualization and Computer Graphics
doi: 10.1111/cgf.13193 2 10 © 2025 IEEE. This is the author’s version of the article that has been published in IEEE Transactions on Visualization and Computer Graphics. The final version of this record is available at: xx.xxxx/TVCG.201x.xxxxxxx
2025 doi
-
[2019]
doi: 10.1109/TVCG.2018.2865158 2
2018
-
[2021]
doi: 10.1145/3411764.3445356 2
-
[2025]
doi: 10.1145/3706598.3714155 2, 4, 8, 9
Reviewed August 15, 2026 · model on record in the stance chip above.
Discussion (0). Continue with ORCID to comment.