REVIEW 4 major objections 5 minor 1 cited by
Energy Balance in Avalanche Models for Solar Flares
T0 review · 4 major / 5 minor · reviewed 2026-08-14 · deepseek-v4-flash
Pith's one-line read The power-law distribution of solar flare energies in three avalanche models comes from the transition rates between energy states, not from the distribution of stored energy.
desk verdict A useful application of the master-equation idea to CA flare models, but the transition-rate attribution is based on an assumed functional form rather than a direct measurement. read the letter →
The pith
A machine-rendered reading of the paper's core claim, the machinery that carries it, and where it could break.
The reading
What carries the argument
The central object is the probability balance equation (a master equation for the energy of the active region), which describes a continuous range of energy states with driving and with transitions between energies at rates $\alpha(E,E')$. The paper couples this with the assumed power-law transition-rate form $\alpha(E,E') = \alpha_0 E^{\delta}(E-E')^{-\gamma}\theta(E-E'-E_0)$, which lets the released energy and the current system energy enter separately. Fitting the resulting expression for $N(E)$ to simulation data separates the roles of $P(E)$ and $\alpha(E,E')$; because $P(E)$ is peaked, any power law in $N(E)$ is attributed to $\alpha$. The waiting-time analysis uses the $q$-exponential distribution as the fitting family.
What would settle it
Track the lattice energy immediately before and after every avalanche in a long simulation and directly tabulate $\alpha(E,E')$; if the directly measured transition rates are not a power law of the released energy while $N(E)$ still is, the claimed origin in transition rates fails.
Extended reading notes
Core claim
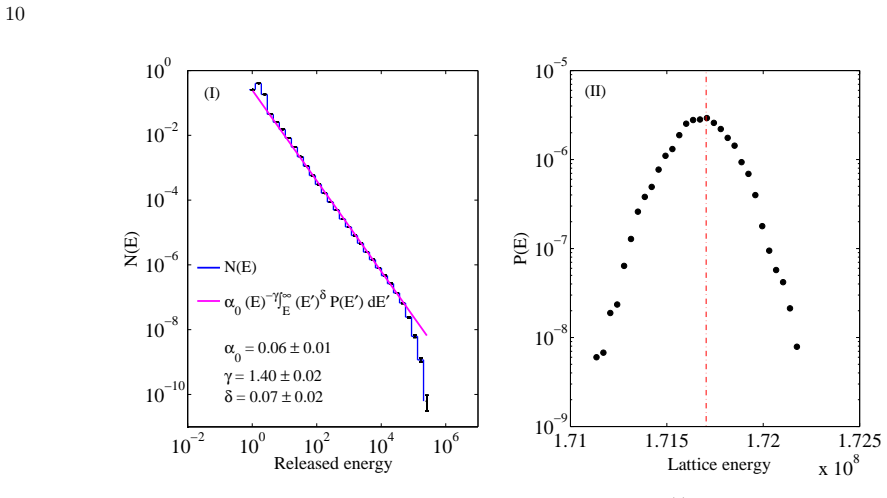
Using a probability balance equation for a single scalar energy $E$, the paper shows that in the reduced Lu-Hamilton cellular automaton and in two variants of an energy-optimized automaton, the stationary distribution $P(E)$ of lattice energy is a narrow, approximately Gaussian peak located near the mean energy. Since such a peaked $P(E)$ cannot generate a power law over many decades, the observed $N(E) \propto E^{-\gamma}$ must be carried by the transition rates $\alpha(E,E')$. Fitting $N(E)=\alpha_0 E^{-\gamma} \int_E^\infty (E')^{\delta} P(E') \, dE'$ gives $\gamma = 1.40 \pm 0.02$ for the Lu-Hamilton model and $\gamma = 1.65 \pm 0.02$ for both optimized variants, with $\delta$ near zero to $0.07$. The paper therefore concludes that the power-law flare size distribution originates in the distribution of transition rates between energy states, not in the energy distribution of the active region. It also finds waiting times described by a $q$-exponential: $q$ is $1.00001 \pm 0.00001$ for the reduced Lu-Hamilton model, $1.28 \pm 0.02$ for the anisotropic optimized model, and $1.00010 \pm 0.00001$ for the isotropic optimized model, meaning two of the three are consistent with a simple Poisson process.
Load-bearing premise
The whole argument assumes that the state of the model can be described by one number — its total energy — and that each flare is an instant change from one energy to another; if how long a flare lasts or how the energy is arranged matters, the calculated jump rates may not be meaningful.
Editorial extensions
If this is right
- In these models, the scale-free flare size distribution is a property of the release mechanism (how much energy is emitted in a jump), not of how much magnetic energy the lattice holds.
- The same master-equation decomposition gives a route to modeling flare energy and waiting-time statistics together, with waiting times mostly Poisson except when the redistribution rule is anisotropic and globally driven.
- Observed power-law flare size distributions should be interpreted as constraints on transition-rate functions, so different active regions can show different $\gamma$ because their rate functions differ, not because their stored-energy distributions differ.
- The fitted parameter sets provide baselines that future, more physical avalanche models can be tested against: compare their fitted transition rates against the observed frequency-size distributions rather than comparing $P(E)$ directly.
Reading between the lines
- A direct test of the paper's conclusion would be to measure the energy just before and after each avalanche in the simulations and tabulate $\alpha(E,E')$ empirically, without assuming the power-law ansatz; this would show whether the fitted $\gamma$ is an artifact of the assumed functional form.
- The same balance-equation decomposition could be applied to observed active regions if their free magnetic energy can be estimated over time, asking whether real flares also obey rate-dominated power laws.
- The different $\gamma$ values for the Lu-Hamilton model (1.40) versus the optimized models (1.65) suggest that the power-law index is not universal even within this model family, which may matter for interpreting observed variations in flare power-law slopes.
- The $q=1.28$ waiting-time result for the anisotropic optimized model predicts measurable flare clustering; checking long active-region observed series for $q>1$ would test whether that redistribution rule is physically relevant.
Signed reviews
Editorial analysis
A structured set of objections, weighed in public.
Referee Report
Summary. The paper applies a probability balance (master) equation, previously used by Wheatland and collaborators for solar flare energetics, to cellular automaton (CA) avalanche models of solar flares. Flare events are simulated with a reduced Lu-Hamilton model and two versions of an 'optimized' model, and the authors measure the frequency-size distribution N(E) of released energies and the lattice energy distribution P(E). They then substitute an assumed power-law transition rate, α(E,E') = α0 E^δ (E−E')^−γ, into the balance equation and fit the resulting expression for N(E) to the simulated distributions using a genetic algorithm. From the quasi-normal shape of P(E) and the quality of the fits, the paper concludes that the power-law form of N(E) originates in the distribution of transition rates between energy states rather than in the distribution of stored lattice energy. The paper also fits the waiting-time distributions with a q-exponential and reports that the reduced LH and isotropic optimized models are consistent with a simple Poisson process, while the anisotropic optimized model deviates.
Significance. If established, the paper's conclusion would provide a useful conceptual clarification for CA flare models: the scale-free avalanche size distribution is inherited from the energy-jump probability distribution, not from the stored-energy distribution. The mathematical decomposition in Eq. (11) is correct, and the authors' observation that P(E) is quasi-normal while N(E) is a power law is a clean consistency argument that the power law cannot come from P(E) alone. The paper also usefully extends the probability balance framework to two recent CA models and provides a quantitative test of the waiting-time distribution. However, the significance is limited by the fact that the quantitative evidence for the central claim is a fit of an assumed transition-rate form, not an independent measurement of the transition rates from the simulations. The paper does not report goodness-of-fit statistics, does not justify the scalar, Markovian reduction of the CA lattice, and does not test alternative transition-rate kernels. These gaps leave the headline attribution at the level of a consistency check rather than a demonstrated origin.
major comments (4)
- [Section 3, Eq. (14)] The fit of Eq. (14) to the simulated N(E) is not an independent measurement of the transition rate, because Eq. (14) is derived by inserting the assumed power-law form α(E,E') = α0 E^δ (E−E')^−γ (Eq. 13) into the balance equation. The text states explicitly that the transition rate is assumed to have this form. To support the central claim that the power law originates in the transition rates, the simulations should provide a direct histogram of transitions binned by initial lattice energy and released energy, and this histogram should be compared with Eq. (13). At minimum, the authors should test alternative kernels (e.g., exponential or log-normal in released energy) and show that they fail to reproduce N(E) given the measured P(E). Without such a test, the paper demonstrates consistency with the ansatz but not the claimed origin.
- [Section 2.2, Eq. (10)] The probability balance equation reduces the full CA lattice state to a scalar energy E with instantaneous Markovian transitions. This reduction is assumed but not justified. Avalanches in CA models have finite durations and consist of many individual redistribution events; treating each avalanche as an instantaneous jump between two energy levels may be invalid if the transition rate depends on internal configurational details that are not captured by the scalar energy. The authors should provide a test of this reduction, for example by comparing the waiting-time distribution predicted from the energy-dependent rate λ(E) in Eq. (15) with the directly measured inter-event statistics, or by verifying that the inferred N(E) is unchanged when conditioning on avalanche duration.
- [Section 3, Figures 1-3] The text states that the goodness of fit is evaluated using the χ² test and that a genetic algorithm minimizes the χ² function, but no χ² values, degrees of freedom, or residuals are reported for any of the fits in Figures 1-3. Given that three free parameters are fitted to a smooth power-law-like distribution, reporting the actual χ² values is essential for assessing whether the deviations, particularly in the rollover region, are acceptable. The authors should report χ² (or an equivalent likelihood), the number of data points used, and show residual plots for each fit.
- [Section 3, Eqs. (14), (19), (22)] The fitting range used for Eq. (14) is not stated. This matters because the predicted N(E) in Eq. (19) has a rollover near the mean lattice energy due to the finite support of P(E), while the observed rollovers in Figures 1-3 occur at released energies roughly two to five orders of magnitude below the mean and are attributed instead to finite simulation time via Eq. (22). The authors should specify the energy range over which Eq. (14) is fitted and the number of data points in that range, and confirm that the fit is not dominated by the rollover. Without this information, the reported parameters α0, γ, and δ are not reproducible or fully interpretable.
minor comments (5)
- [Eq. (24)] Equation (24) is described as the cumulative distribution function, but the expression shown is actually the complementary CDF (survival function). The CDF should include the factor 1 − before the q-exponential term, or the text should be relabeled as the survival function.
- [Eq. (23)] In Equation (23), the equality P(Δt) = (2−q)λ e^{−λΔt} ≈ ... is confusing: the ordinary exponential is not exactly equal to the q-exponential. The authors should write the q-exponential definition explicitly and then state that it reduces to the ordinary exponential in the limit q → 1.
- [Section 3, Figures 1-3] The fitted curve in the left panels is labeled with the full expression 'α0 (E)^{−γ} ∫ ...' which is difficult to read in the figures. A concise legend entry such as 'Eq. (14) fit' would improve clarity.
- [Section 3, Eq. (22)] The notation n(>E) is defined as 'the expected number of events with size greater than E', but the integral in Eq. (22) uses N(E), which is a rate per unit energy per unit time. The authors should make the time interval explicit in the definition to avoid dimensional ambiguity.
- [References and reproducibility] The paper does not state the lattice sizes, the number of simulation runs, or the exact driving rates used beyond the inequality in Section 3, and no code or data availability statement is provided. Adding this information would make the numerical results reproducible.
Circularity Check
No significant circularity: the power-law-origin inference follows from the independently measured quasi-normal P(E) and the general balance equation, not from the fitted transition-rate ansatz.
full rationale
The paper's central inference is not circular. Section 2.2 defines the flare frequency-size distribution N(E) via the general convolution N(E) = ∫ P(E') α(E', E'-E) dE' (Eq. 11), which does not require the power-law ansatz of Eq. (13). The simulations independently yield a sharply peaked, quasi-normal P(E) (right panels of Figures 1-3). For E well below the mean lattice energy, Eq. (11) makes N(E) approximately proportional to α(Ebar, Ebar-E), so the observed power-law N(E) directly forces a power-law release-energy dependence in the transition rate. Thus the conclusion that the power law originates in the transition rates, rather than in P(E), follows from measured quantities plus the general balance equation. The subsequent use of Eq. (13) is a parametric fitting form: fitting Eq. (14) estimates α0, γ, and δ and tests consistency; it is not presented as an independent prediction of N(E) from a previously determined α. The self-citations (Wheatland 2008; Farhang et al. 2018) provide the balance-equation framework and the optimized CA model as inputs; neither is invoked as an unverified uniqueness theorem or as the sole support for the origin claim. The scalar Markovian reduction behind Eq. (10) is an assumption whose validity could be questioned, and the missing chi-squared values are an incompleteness issue, but these are correctness concerns rather than circularity. I find no step in which a central claim reduces by construction to its inputs.
Assumptions & free parameters
free parameters (6)
- alpha_0 =
0.06, 0.085, 2.72 (per model)
- gamma =
1.40, 1.65, 1.65
- delta =
0.07, 0.06, 0.01
- q =
1.00001, 1.28, 1.00010
- lambda =
not quoted
- E0 =
not specified
assumptions (4)
- domain assumption The active region energy evolution is a Markov process described by the master equation (Equation 10).
- domain assumption A flare corresponds to an instantaneous transition from energy E to a lower energy E' with rate alpha(E,E').
- ad hoc to paper The transition rate has the power-law form alpha = alpha0 E^delta (E-E')^(-gamma), Equation 13.
- domain assumption The system reaches a steady state so that the time-independent probability balance equation applies.
Cite this review
Pith. "Pith review of Energy Balance in Avalanche Models for Solar Flares." pith.science (2026). https://pith.science/paper/4JLGPRMM
@misc{pith2026190900195,
  author       = {Pith},
  title        = {Pith review of: Energy Balance in Avalanche Models for Solar Flares},
  year         = {2026},
  howpublished = {\url{https://pith.science/paper/4JLGPRMM}},
  note         = {Machine review of arXiv:1909.00195}
}
read the original abstract
The distributions of solar flare energies and waiting times have not been described simultaneously by a single physical model, yet. In this research, we investigate whether recent avalanche models can describe the distributions for both the released energies and waiting times of flares in an active region. Flaring events are simulated using the modified Lu and Hamilton model (Lu and Hamilton (1991), ApJ, 380, 89) and also the optimized model (Farhang et al. (2018), ApJ, 859, 41). Applying a probability balance equation approach, we study the statistics of the simulated flaring events and investigate the origin of the observed power law in the flare frequency-size distribution. The results indicate that the power law originates in the distribution of transition rates (the distribution of the probabilities of transitions between different energies) rather than the distribution of the energy of the active region. It is also observed that the waiting-time distribution of simulated flaring events follows a q-exponential function which approximates a simple Poisson distribution.
Figures


Figures from the paper (1 more)

Forward citations
Cited by 1 Pith paper
-
A Correlation in the Waiting-time Distributions of Solar Flares
A new analysis of GOES soft X-ray data finds that larger flares in isolated active regions tend to be followed by longer waiting times until the next flare, a 'saturation' pattern that supports the build-up/release mo...
Reference graph
Works this paper leans on
-
[1]
2011, Self-Organized Criticality in Astrophysics (Springer-Verlag Berlin Heidelberg), XIV, 416
Aschwanden, M. 2011, Self-Organized Criticality in Astrophysics (Springer-Verlag Berlin Heidelberg), XIV, 416
work page 2011
-
[2]
Aschwanden, M., & van Ballegooijen, A. A. 2018, in Catalyzing Solar Connections
work page 2018
-
[3]
Crosby, N., Dimitropoulou, M., et al
Aschwanden, M., B. Crosby, N., Dimitropoulou, M., et al. 2014, Space Science Reviews, 198
2014
-
[4]
Aschwanden, M. J., & McTiernan, J. M. 2010, The Astrophysical Journal, 717, 683
work page 2010
-
[5]
Aschwanden, M. J., Tarbell, T. D., Nightingale, R. W., et al. 2000, The Astrophysical Journal, 535, 1047
work page 2000
-
[6]
Aschwanden, M. J., Caspi, A., Cohen, C. M. S., et al. 2017, The Astrophysical Journal, 836, 17
work page 2017
-
[7]
1987, Physical Review Letters, 59, 381
Bak, P., Tang, C., & Wiesenfeld, K. 1987, Physical Review Letters, 59, 381
work page 1987
-
[8]
Barpi, F., Borri-Brunetto, M., & Veneri, L. D. 2007, Journal of Cold Regions Engineering, 21, 121 Boffetta, G., Carbone, V., Giuliani, P., Veltri, P., &
work page 2007
Show all 43 references
-
[9]
1999, Physical Review Letters, 83, 4662
Vulpiani, A. 1999, Physical Review Letters, 83, 4662
1999
-
[10]
2003, Astronomy and Astrophysics, 406, 1061
Buchlin, E., Aletti, V., Galtier, S., et al. 2003, Astronomy and Astrophysics, 406, 1061
2003
-
[11]
2005, Astronomy and astrophysics, 436, 355 Cant´ o, J., & Mart ´ ınez-G´ omez, S
Buchlin, E., Galtier, S., & Velli, M. 2005, Astronomy and astrophysics, 436, 355 Cant´ o, J., & Mart ´ ınez-G´ omez, S. C. . E. 2009, Astronomy and Astrophysics, 501, 1259
2005
-
[12]
W., Liu, H.-L., & Bogdan, T
Charbonneau, P., McIntosh, S. W., Liu, H.-L., & Bogdan, T. J. 2001, Solar Physics, 203, 321
2001
-
[13]
B., Aschwanden, M
Crosby, N. B., Aschwanden, M. J., & Dennis, B. R. 1993, Solar Physics, 143, 275
1993
-
[14]
Farhang, N., Safari, H., & Wheatland, M. S. 2018, The Astrophysical Journal, 859, 41
2018
-
[15]
R., Hudson, H
Fletcher, L., Dennis, B. R., Hudson, H. S., et al. 2011, Space Sience Review, 159, 19
2011
-
[16]
2017, The Astrophysical Journal, 847, 115
Gheibi, A., Safari, H., & Javaherian, M. 2017, The Astrophysical Journal, 847, 115
2017
-
[17]
McClements, K. G. 2003, Physical Review Letters, 90, 131101
2003
-
[18]
1998, Astronomy and Astrophysics, 335, 1085
Isliker, H., Anastasiadis, A., Vassiliadis, D., & Vlahos, L . 1998, Astronomy and Astrophysics, 335, 1085
1998
-
[19]
2000, Astronomy and Astrophysics, 363, 1134
Isliker, H., Anastasiadis, A., & Vlahos, L. 2000, Astronomy and Astrophysics, 363, 1134
2000
-
[20]
2013, Acta Geophysica, 61
Jimnez, A. 2013, Acta Geophysica, 61
2013
-
[21]
2017, Genetic Algorithm Essentials, Studies in Computational Intelligence (Springer International Publishing)
Kramer, O. 2017, Genetic Algorithm Essentials, Studies in Computational Intelligence (Springer International Publishing)
2017
-
[22]
F., & Uzdensky, D
Loureiro, N. F., & Uzdensky, D. A. 2016, Plasma Physics and Controlled Fusion, 58, 014021
2016
-
[23]
T., & Hamilton, R
Lu, E. T., & Hamilton, R. J. 1991, The Astrophysical Journal, 380, L89
1991
-
[24]
T., Hamilton, R
Lu, E. T., Hamilton, R. J., McTiernan, J. M., & Bromund, K. R. 1993, The Astrophysical Journal, 412, 841
1993
-
[25]
2015, Earth, Planets and Space, 67, 59
Maehara, H., Shibayama, T., Notsu, Y., et al. 2015, Earth, Planets and Space, 67, 59
2015
-
[26]
Moore, E. F. 1962, Machine Models of Self-Reproduction, ed. R. Bellman, ”Mathematical problems in the biological sciences (American Mathematical Society)
1962
-
[27]
2008, The Astrophysical Journal, 682, 654 Picoli Jr., S., Mendes, R
Morales, L., & Charbonneau, P. 2008, The Astrophysical Journal, 682, 654 Picoli Jr., S., Mendes, R. S., Malacarne, L. C., & Santos, R. P. B. 2009, Brazilian Journal of Physics, 39, 468
2008
-
[28]
Robinson, P. A. 1994, Physical Review E, 49, 1984
1994
-
[29]
Rosner, R., & Vaiana, G. S. 1978, The Astrophysical Journal, 222, 1104
1978
-
[30]
2011, Living Reviews in Solar Physics, 8, 6
Shibata, K., & Magara, T. 2011, Living Reviews in Solar Physics, 8, 6
2011
-
[31]
1995, Publications of the Astronomical Society of Japan, 47, 251
Shimizu, T. 1995, Publications of the Astronomical Society of Japan, 47, 251
1995
-
[32]
2014, Solar Physics, 289, 2993
Strugarek, A., Charbonneau, P., Joseph, R., & Pirot, D. 2014, Solar Physics, 289, 2993
2014
-
[33]
2004, Continuum Mechanics and Thermodynamics, 16, 223
Tsallis, C., & Brigatti, E. 2004, Continuum Mechanics and Thermodynamics, 16, 223
2004
-
[34]
Upper, D. R. 1997, PhD thesis, University of California,
1997
-
[35]
Berkeley, USA Van Kampen, N. G. 1992, Stochastic Processes in Physics and Chemistry (Amsterdam: Elsevier Science) Von Neumann, J. 1966, Theory of Self-Reproducing Automata (Champain, IL: University of Illionois Press)
1992
-
[36]
Weimar, J. R. 1998, Simulation with Cellular Automata (Berlin: Technical University Braunschweig)
1998
-
[37]
2001, Solar Physics, 203, 87
Wheatland, M. 2001, Solar Physics, 203, 87
2001
-
[38]
Wheatland, M. S. 2008, The Astrophysical Journal, 679, 1621
2008
-
[39]
S., & Glukhov, S
Wheatland, M. S., & Glukhov, S. 1998, The Astrophysical Journal, 494, 858
1998
-
[40]
S., & Litvinenko, Y
Wheatland, M. S., & Litvinenko, Y. E. 2001, The Astrophysical Journal, 557, 332
2001
-
[41]
S., & Litvinenko, Y
Wheatland, M. S., & Litvinenko, Y. E. 2002, Solar Physics, 211, 255
2002
-
[42]
C., Rabassa, P., & Beck, C
Yalcin, G. C., Rabassa, P., & Beck, C. 2016, Journal of Physics A: Mathematical and Theoretical, 49, 154001
2016
-
[43]
B., & Cleveland, F
Zirker, J. B., & Cleveland, F. M. 1993, Solar Physics, 144, 341
1993
Reviewed August 14, 2026 · model on record in the stance chip above.
Discussion (0). Continue with ORCID to comment.