REVIEW 3 major objections 5 minor 21 references
Characterization of diffuse X-ray emission from IGR~J17448-3232: an implication of a line of sight merging activity
T0 review · 3 major / 5 minor · reviewed 2026-08-14 · deepseek-v4-flash
Pith's one-line read The core of IGR J17448-3232 is out of ionization equilibrium, implying a recent merger.
desk verdict Plausible but not unique NEI detection in IGR J17448-3232; honest about model degeneracy and worth refereeing. read the letter →
The pith
A machine-rendered reading of the paper's core claim, the machinery that carries it, and where it could break.
The reading
What carries the argument
The analytical engine is the comparison between two independent temperature diagnostics for the same plasma. The electron temperature is read from the shape of the thermal bremsstrahlung continuum, while the ionization temperature is read from the intensity ratio of the Fe XXVI Ly$\alpha$ line to the Fe XXV He$\alpha$ line, a ratio that depends on how far collisional ionization has progressed. In collisional ionization equilibrium these two temperatures agree; when the ionization temperature falls below the electron temperature, the plasma is under-ionized, meaning it was heated recently. The non-ionization equilibrium model then carries the argument through the parameter $n_{\rm e}t$ (electron density times elapsed time), whose best-fit value of $2.5\times10^{11}\ {\rm cm^{-3}\ s}$ gives the timescale since the shock. This ratio-versus-continuum comparison is what separates NEI from a simple hot CIE plasma.
What would settle it
Measure the Fe XXVI/Fe XXV ratio and the continuum temperature separately in several sub-annuli inside 300 arcseconds with a high-resolution spectrometer: if the ratio can be reproduced by a two-temperature CIE mixture with plausible component luminosities, the single-phase NEI claim is falsified; if the ratio stays uniformly below the CIE value while the continuum temperature stays high, the NEI claim stands.
Extended reading notes
Core claim
The central discovery claim is that the intracluster medium within $r<300''$ of IGR J17448-3232 is in a non-ionization equilibrium state, not the collisional ionization equilibrium normally assumed for cluster gas. The electron temperature from the thermal bremsstrahlung continuum is 13-15 keV, whereas the ionization temperature inferred from the Fe XXVI Ly$\alpha$/Fe XXV He$\alpha$ intensity ratio is lower, about 8-10 keV; the single-temperature NEI model (with $n_{\rm e}t=(2.5^{+1.4}_{-1.0})\times10^{11}\ {\rm cm^{-3}\ s}$) reproduces the combined 300 arcsec spectrum with $\chi^2/{\rm dof}=1083/1119$. The outer region ($r>300''$) is consistent with a single CIE plasma at 5-8 keV. The authors also show that two-temperature CIE or CIE-plus-power-law models can fit the central spectrum, but those models require an unusually hard component (a temperature above 34 keV or a power-law photon index of 1.1) carrying a large fraction of the flux, so they favor the NEI interpretation. They propose that the NEI plasma was produced by a merger along the line of sight, because the cluster looks circular in projection and the elapsed time since shock heating, about $8\times10^6$ years, is much shorter than the roughly $10^9$-year crossing time.
Load-bearing premise
The NEI conclusion assumes that all the gas within 300 arcseconds has one temperature and one ionization state, so the low iron line ratio must be caused by under-ionization rather than by a mix of cooler and hotter gas.
Editorial extensions
If this is right
- If the NEI reading is right, the central plasma was heated by a shock only about $8\times10^6$ years ago, making the merger recent compared with the cluster's $\sim10^9$-year crossing time.
- A merger that happened along the line of sight would leave the cluster looking circular and relaxed in projection, so an NEI core can be the only clear relic of the collision.
- The measured value of $n_{\rm e}t$ gives a direct time-density product that can be combined with density estimates to date the shock and constrain the merger geometry.
- The outer region's cooler, equilibrium gas at 5-8 keV and the central 13-15 keV plasma together imply the shock energy is concentrated in the core, matching a head-on merger geometry.
Reading between the lines
- The same continuum-versus-line-ratio mismatch could be searched for in other apparently relaxed, hot clusters; any cluster with a recent enough line-of-sight merger should show a similar deficit of Fe XXVI relative to Fe XXV.
- The single-phase assumption is the fragile link: if future high-resolution maps reveal that the ratio and continuum temperature vary independently inside 300 arcseconds, the spectrum is a mixture of phases and the NEI claim loses its uniqueness.
- High-resolution X-ray calorimetry could directly test the line-of-sight merger picture by looking for Doppler shifts or line broadening in the iron lines, which should be small for a merger perpendicular to the sky and large for one along the line of sight.
Signed reviews
Editorial analysis
A structured set of objections, weighed in public.
Referee Report
Summary. The paper analyzes XMM-Newton EPIC observations of the galaxy cluster IGR J17448-3232, focusing on the diffuse X-ray emission from the central r<300" region. The authors find a hot plasma with kTe ~ 13-15 keV from the continuum and a Fe XXVI Ly-alpha / Fe XXV He-alpha line ratio whose implied ionization temperature is 8-10 keV, i.e., lower than the electron temperature. A single-temperature non-equilibrium ionization (NEI) model (vrnei) fits the combined central spectrum with chi2/dof = 1083/1119 and yields net = 2.5e11 cm^-3 s, while a single-temperature collisional ionization equilibrium (CIE) model is worse. The authors acknowledge that two-component CIE and CIE+power-law models also provide acceptable fits and reproduce the line ratio, but they argue that these alternatives require unusually hard components (kT > 34 keV or photon index ~1.1) that have not been reported in other clusters, and thus prefer the NEI interpretation. They estimate an elapsed time of roughly 8 Myr since shock heating and, because this is much shorter than the sound crossing time, propose that the merger occurred along the line of sight.
Significance. If the NEI interpretation is correct, this would be a valuable and rare detection of a non-equilibrium ionization state in a galaxy cluster, with consequences for understanding merger-induced shock heating and the timescales for ionization equilibration in the ICM. The paper is careful in its treatment of the Galactic diffuse X-ray background using Suzaku data, and it explicitly discusses the degeneracy among spectral models, which is a strength. However, the central claim is not uniquely established: the preference for NEI rests on a modest chi2 improvement (Delta chi2 ~ 15-19) over the two-component equilibrium models, and the dismissal of those alternatives is based on physical plausibility arguments rather than a quantitative model-selection test. The significance of the Fe XXVI line detection in individual annuli is also marginal, which weakens the line-ratio diagnostic. The paper is therefore best viewed as reporting a plausible NEI candidate that requires stronger statistical support before it can be considered the established state of the ICM.
major comments (3)
- [Section 4, Table 3] The preference for the NEI model over the 2CIE and CIE+PL models is asserted but not quantitatively established. The paper states that 'the NEI model gives a better fit' and 'we argue that the NEI plasma model ... is likely,' but it does not report an F-test, AIC, BIC, or any other model-selection statistic. The Delta chi2 values are 15 (NEI vs 2CIE) and 19 (NEI vs CIE+PL) for one additional degree of freedom in the alternatives, which is suggestive but not decisive without a proper test, especially when the alternative models are physically motivated and reproduce the Fe line ratio. Please add a quantitative model comparison (e.g., F-test or information criterion) and discuss whether the hard component (kT > 34 keV or photon index 1.1) can be excluded on grounds other than precedent. If it cannot, the conclusion should be framed as a weak preference rather than a determination.
- [Section 3.2.2, Table 2, Figure 4] The claim that the ionization temperature is lower than the electron temperature rests on the Fe XXVI/Fe XXV line ratio, but the Fe XXVI line is only marginally detected in several annuli (e.g., 0.4 ± 0.4 x 10^-5 photons s^-1 cm^-2 in the 200"-300" region, and 0.6 ± 0.3 in 0"-100"). The paper should report the detection significance of Fe XXVI in the combined r<300" spectrum and provide confidence contours for the line ratio itself. If the combined detection is not at high significance, the inferred NEI signature is correspondingly uncertain, and this uncertainty should be propagated into the discussion.
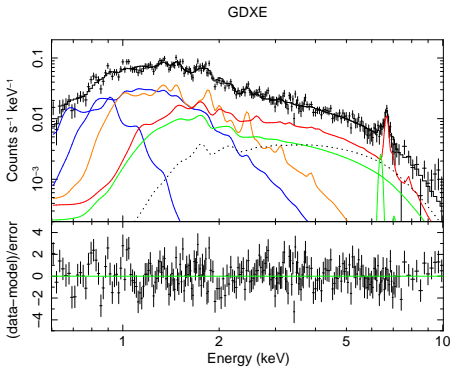
- [Section 3.2.1] The Galactic diffuse X-ray background (GDXE) intensities are scaled by factors of 0.80 (reflection component) and 0.89 (thermal components) based on Yamauchi et al. (2016), but the uncertainties on these scaling factors are not propagated into the cluster spectral results. The authors perform a robustness check by varying the sky and detector backgrounds by ±10%, but a formal treatment, such as allowing the scaling factors to vary within their reported errors and refitting, would strengthen confidence in the derived Fe line fluxes and temperatures, particularly because the GDXE contains Fe lines near 6.4-6.7 keV that overlap with the cluster lines.
minor comments (5)
- [Section 3.1] The heading 'Spatical distribuion' contains two typos; it should read 'Spatial distribution.'
- [Introduction] In the introduction, 'the orgin of these features' should be 'the origin of these features.'
- [Figure 4] Figure 4 shows no error bars on the data points. Please add errors, or state explicitly that they are omitted for clarity, so that the reader can judge the significance of the deviation from the CIE curve.
- [Section 3.2.2] The initial temperature in the NEI model is fixed to kT_init = 5 keV, chosen from the outer annulus. The sensitivity of the best-fit net value and the chi2 to this assumption is not discussed; a brief test with different kT_init (e.g., 4 or 6 keV) would be useful.
- [Abstract and Section 5] The abstract and conclusion state that the line ratio 'suggests' NEI, which is appropriately cautious, but the title ('an implication of a line of sight merging activity') and the concluding bullet about supporting the merging scenario are somewhat stronger than the evidence warrants given the model degeneracy.
Circularity Check
No significant circularity: the NEI claim is a spectral interpretation and no derivation reduces to its inputs by construction.
full rationale
The central NEI conclusion is based on a directly measured Fe XXVI Ly-alpha / Fe XXV He-alpha intensity ratio (Table 2, Figure 4) being lower than the ratio expected from a CIE plasma at the fitted continuum temperature, followed by fitting a NEI model to the same spectrum (Table 3). This is a model-selection argument, not a self-referential derivation: the ionization temperature is estimated from the line ratio independently of the vrnei model, and the NEI fit does not force the ratio by construction. The statistically acceptable 2CIE and CIE+PL alternatives indicate model degeneracy rather than circularity, since the paper does not claim those alternatives are excluded by construction; it argues against them on physical plausibility grounds. The only self-citation is the use of Yamauchi et al. (2016) for GDXE background scaling in Section 3.2.2, but the paper explicitly checks robustness by varying background intensities by +/-10% and obtaining consistent results, and the source dominates in the inner region. That citation is an empirical calibration, not a load-bearing premise, so it does not raise the circularity score. The elapsed-time estimate of about 8 Myr is derived from the fitted net and an assumed geometry, but it is presented as a calculated estimate rather than as an independent prediction. No circular step can be exhibited because the derivation chain does not identify any quantity with its own input.
Assumptions & free parameters
free parameters (4)
- Central electron temperature kTe (continuum) =
13-15 keV across inner annuli
- Fe XXVI Ly-alpha and Fe XXV He-alpha line intensities =
Ratios 0.3-0.7 in inner regions
- net (ionization timescale) in NEI model =
2.5 +1.4/-1.0 x 10^11 cm^-3 s
- kT_init (initial temperature in NEI model) =
5 keV (fixed)
assumptions (4)
- domain assumption The vapec and vrnei plasma codes in XSPEC correctly model CIE and NEI X-ray emissivities and line ratios.
- domain assumption The sky background at the cluster position is the same as at the Suzaku pointing 0.4 degrees away, after scaling by factors from Yamauchi et al. (2016).
- domain assumption The CXB model and parameters from Kushino et al. (2002) apply here.
- standard math The cluster redshift is z=0.055 and the cosmology is standard, from Barriere et al. (2015).
Cite this review
Pith. "Pith review of Characterization of diffuse X-ray emission from IGR~J17448-3232: an implication of a line of sight merging activity." pith.science (2026). https://pith.science/paper/4LHEPP4Y
@misc{pith2026190806561,
  author       = {Pith},
  title        = {Pith review of: Characterization of diffuse X-ray emission from IGR~J17448-3232: an implication of a line of sight merging activity},
  year         = {2026},
  howpublished = {\url{https://pith.science/paper/4LHEPP4Y}},
  note         = {Machine review of arXiv:1908.06561}
}
read the original abstract
Results of the spectral analysis for the galaxy cluster IGR J17448-3232 are presented. The intracluster medium (ICM) in the central region (r<300", 320 kpc) has a high electron temperature plasma of kTe~13-15 keV and an ionization temperature estimated from an intensity ratio of Fe XXVI Ly alpha/Fe XXV He alpha lines is lower than the electron temperature, which suggests that the ICM is in the non-ionization equilibrium (NEI) state. The spectrum in the central region can be also fitted with a two-component model: a two-temperature plasma model in a collisional ionization equilibrium (CIE) with temperatures of 7.9 keV and >34 keV or a CIE+power law model with a temperature of 9.4 keV and a photon index of 1.1. The two component models can represent the intensity ratio of Fe XXVI Ly alpha/Fe XXV He alpha lines. On the other hand, the spectrum in the outer region (r>300'') can be explained by a single CIE plasma model with a temperature of 5-8 keV. Based on the spectral feature and its circular structure, we propose that the NEI plasma was produced by merging along the line-of-sight direction.
Figures


Figures from the paper (2 more)


Reference graph
Works this paper leans on
- [1]
- [2]
- [3]
-
[4]
1992, ApJ, 400, 699 Barri` ere, N
Balucinska-Church, M., & McCammon, D. 1992, ApJ, 400, 699 Barri` ere, N. M., Tomsick, J. A., Wik, D. R., Chaty, S., & Rodo riguez, J. 2015, ApJ, 799, 24
work page 1992
- [5]
- [6]
- [7]
-
[8]
Inoue, S., Hayashida, K., Ueda, S., Nagino, R., Tsunemi, H., & Koyama, K. 2016, PASJ, 68, S23
work page 2016
Show all 21 references
-
[9]
2007, PASJ, 59, S23
Koyama, K., et al. 2007, PASJ, 59, S23
2007
-
[10]
Y ., Ishida, M., Ohashi, T., & Ueda, Y
Kushino, A., Ishisaki, Y ., Morita, U., Y amasaki, N. Y ., Ishida, M., Ohashi, T., & Ueda, Y . 2002, PASJ, 54, 327
2002
-
[11]
Lodders, K 2003, ApJ, 591, 1220
2003
-
[12]
H., David, L., Vikhlinin, A., M urray, S., Forman, W., Jones, C., & Tucker, W
Markevitch, M., Gonzalez, A. H., David, L., Vikhlinin, A., M urray, S., Forman, W., Jones, C., & Tucker, W. 2002, ApJ, 567, L27
2002
-
[13]
2007, PASJ, 59, S1
Mitsuda, K., et al. 2007, PASJ, 59, S1
2007
-
[14]
2008, PASJ, 491, 363
Ota, N., et al. 2008, PASJ, 491, 363
2008
-
[15]
2011, A&A, 535, A4
Reichert, A., B¨ ohringer, H., Fassbender, R., & M¨ uhlegger, M. 2011, A&A, 535, A4
2011
-
[16]
R., et al
Russell, H. R., et al. 2012, MNRAS, 423, 236
2012
-
[17]
L., Mushotzky, R
Snowden, S. L., Mushotzky, R. F., Kuntz, K. D., & Davis, D. S. 2 008, A&A, 478, 615 Str¨ uder, L., et al. 2001, A&A, 365, L18
2001
-
[18]
Takizawa, M.1999, ApJ, 520, 514
1999
-
[19]
A., Chaty, S., Rodriguez, J., Wakter, R., & Kaare t, P
Tomsick, J. A., Chaty, S., Rodriguez, J., Wakter, R., & Kaare t, P . 2009, ApJ, 701, 811
2009
-
[20]
Turner, M. J. L., et al. 2001, A&A, 365, L27
2001
-
[21]
G., & Koyama, K
Uchiyama, H., Nobukawa, M., Tsuru, T. G., & Koyama, K. 2013, P ASJ, 65, 19 Y amauchi, S., Nobukawa, K. K., Nobukawa, M., Uchiyama, H., & Koyama, K. 2016, PASJ, 68, 59 13
2013
Reviewed August 14, 2026 · model on record in the stance chip above.
Discussion (0). Continue with ORCID to comment.