High Resolution Spectroscopic Analysis of Chromospheric Line Evolution during an Energetic Flare on AD Leo
Pith reviewed 2026-06-30 04:38 UTC · model grok-4.3
The pith
High-resolution spectra of an AD Leo superflare show Balmer lines dominate chromospheric energy with delayed Ca II and Na I peaks indicating cumulative heating.
A machine-rendered reading of the paper's core claim, the machinery that carries it, and where it could break.
Core claim
During the superflare the chromospheric energy budget is carried chiefly by the Balmer series, with Ca II H, Ca II K and the infrared triplet each contributing well-defined fractions of the Hα energy; the same event exhibits delayed peak emission in Ca II H&K, the Ca II triplet and Na I lines that matches the Neupert effect and therefore points to cumulative heating in the gradual phase. Although the flare morphology is broadly solar-like, systematic differences in the chromospheric line ratios are interpreted as consequences of the different atmospheric structure and pre-flare conditions on M dwarfs rather than fundamentally different energy-release physics.
What carries the argument
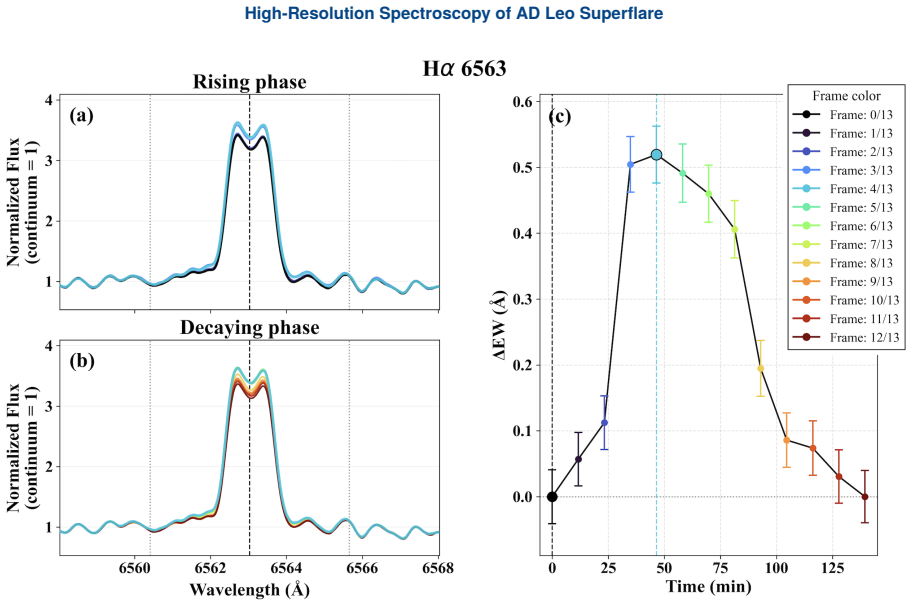
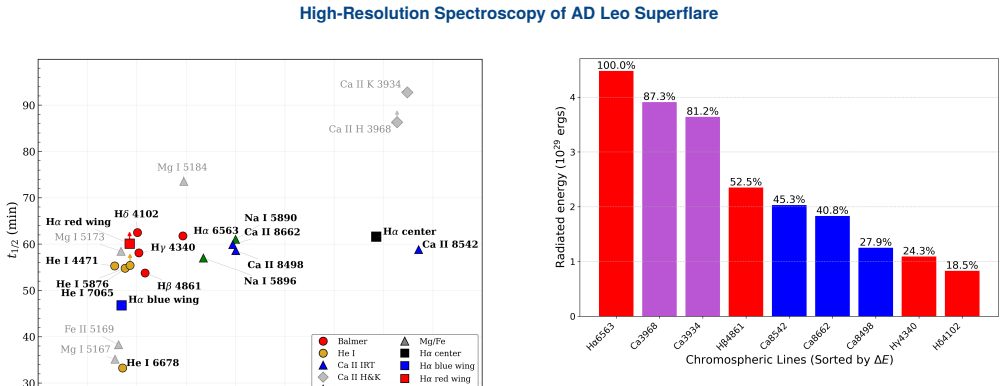
Time series of equivalent-width variations extracted from R~30,000 spectra of the Balmer, Ca II and Na I lines, used to compute radiated energies and to track the timing of peak emission.
If this is right
- The Balmer series supplies the dominant fraction of chromospheric radiated energy during the flare.
- Ca II H contributes 47.5% and Ca II K contributes 26.2% of the Hα energy while each infrared-triplet line contributes 17-19%.
- Delayed peaks in Ca II triplet and Na I lines are consistent with the Neupert effect and therefore with cumulative heating during the gradual phase.
- The overall flare morphology is similar to solar flares but the detailed chromospheric line ratios differ, pointing to distinct M-dwarf atmospheric conditions.
Where Pith is reading between the lines
- Models of M-dwarf flare heating may need to incorporate a deeper or denser chromosphere to reproduce the observed line ratios.
- Repeated high-resolution spectroscopy of additional M-dwarf flares could test whether the reported line delays are universal or depend on flare size or stellar activity level.
- If the solar-calibrated energy scaling holds only approximately, the true bolometric energies of M-dwarf superflares could be systematically higher or lower than currently estimated.
Load-bearing premise
Measured equivalent-width changes can be converted into absolute radiated energies and then into total bolometric energy by means of a scaling relation that was calibrated on solar flares.
What would settle it
An independent bolometric-energy measurement of the same flare that differs by more than a factor of a few from the value inferred from Hα, or a repeat observation of another AD Leo flare showing no temporal delay between Hα and Ca II peaks.
Figures


read the original abstract
Active M dwarfs exhibit frequent and energetic flares that provide a unique laboratory for studying chromospheric heating processes under extreme magnetic activity. To probe the flare process of M-dwarfs, we present a high-resolution ($R\sim30{,}000$) spectroscopic case study of a superflare on AD Leo, detected on 2023 March 14 using the Bohyunsan Optical Echelle Spectrograph (BOES). Such high-energy events are rarely captured with simultaneous multi-line spectroscopy, allowing us to trace the energy partition and temporal evolution of the chromospheric lines. Based on equivalent width variations, we found that the H$\alpha$ line radiated $8.8\times10^{30}$ erg, implying a total bolometric energy ($\sim10^{33}$ erg) comparable to the largest solar flares. The Balmer series dominated the energy budget; the individual Ca II H and K lines contributed 47.5% and 26.2% of the H$\alpha$ energy, respectively, while each Ca II infrared triplet line emitted $\sim$17-19%. We confirm that the delayed peak emission, previously reported for Ca II H&K, also occurs in the Ca II triplet and Na I lines. These delays are consistent with the Neupert effect, suggesting that cumulative heating governs the gradual phase emission. While this superflare resembles solar flares in general morphology, it also displayed systematic differences in chromospheric emission. It is likely that these differences reflect the distinct atmospheric structure and quiescent chromospheric conditions of M dwarfs, rather than fundamentally different flare physics.
Editorial analysis
A structured set of objections, weighed in public.
Referee Report
Summary. The manuscript reports high-resolution (R~30,000) spectroscopic observations of a superflare on AD Leo using BOES, analyzing equivalent-width variations to quantify chromospheric line energies and temporal evolution. Key claims include Hα radiating 8.8×10^30 erg (implying bolometric energy ~10^33 erg), Balmer-series dominance, Ca II H and K contributing 47.5% and 26.2% of Hα energy respectively with each Ca II IRT line at ~17-19%, delayed peaks in Ca II triplet and Na I lines consistent with the Neupert effect, and general morphological similarity to solar flares but with systematic differences attributed to M-dwarf atmospheric structure.
Significance. If the central measurements hold, the work supplies rare simultaneous multi-line high-resolution spectroscopy of an energetic M-dwarf superflare, documenting energy partition among chromospheric lines and confirming delayed emission consistent with cumulative heating. This adds concrete observational constraints on flare heating processes in stars with quiescent conditions distinct from the Sun.
major comments (2)
- [Abstract] Abstract: The quantitative energy budget (Hα at 8.8×10^30 erg, Ca II percentages, bolometric total ~10^33 erg) rests on converting measured equivalent-width variations to radiated energies and then scaling Hα to bolometric energy via a relation calibrated on solar flares. The abstract itself states that the flare displays systematic differences in chromospheric emission from solar flares due to distinct M-dwarf atmospheric structure; if this difference affects the EW-to-energy conversion factor or Hα-to-bolometric ratio, the reported partition, Balmer dominance, and numerical values lose their grounding. No independent M-dwarf calibration or direct spectral integration is described.
- [Abstract] Abstract: No error bars accompany the reported energies or line contributions, and the text provides no description of continuum subtraction, radiative transfer assumptions, or reduction steps. These omissions are load-bearing because the central claims are the specific numerical energies and percentages.
minor comments (1)
- [Abstract] Abstract: The observation date is given as 2023 March 14 but instrument setup, exposure times, and data reduction pipeline are not summarized even at the level needed for an observational report.
Simulated Author's Rebuttal
We thank the referee for the constructive feedback and for recognizing the value of simultaneous multi-line high-resolution spectroscopy of an M-dwarf superflare. We address the two major comments below.
read point-by-point responses
-
Referee: [Abstract] Abstract: The quantitative energy budget (Hα at 8.8×10^30 erg, Ca II percentages, bolometric total ~10^33 erg) rests on converting measured equivalent-width variations to radiated energies and then scaling Hα to bolometric energy via a relation calibrated on solar flares. The abstract itself states that the flare displays systematic differences in chromospheric emission from solar flares due to distinct M-dwarf atmospheric structure; if this difference affects the EW-to-energy conversion factor or Hα-to-bolometric ratio, the reported partition, Balmer dominance, and numerical values lose their grounding. No independent M-dwarf calibration or direct spectral integration is described.
Authors: We agree that the energy estimates rely on solar-flare calibrated relations for EW-to-energy conversion and Hα-to-bolometric scaling, and that the noted differences in M-dwarf chromospheric structure could affect the applicability of these factors. In the absence of published M-dwarf-specific calibrations or full spectral integration (precluded by the instrument's wavelength coverage), we employed the best available methods from the literature. We will revise the abstract and add a dedicated limitations paragraph in the discussion to emphasize the approximate character of the numerical values and to call for future M-dwarf flare modeling. revision: partial
-
Referee: [Abstract] Abstract: No error bars accompany the reported energies or line contributions, and the text provides no description of continuum subtraction, radiative transfer assumptions, or reduction steps. These omissions are load-bearing because the central claims are the specific numerical energies and percentages.
Authors: We concur that quantitative claims require error bars and transparent methodology. The manuscript contains a data-reduction section and describes equivalent-width measurements, but these will be expanded to detail continuum-subtraction procedures, any assumptions regarding radiative transfer or line formation, and the full reduction pipeline. Formal uncertainties will be derived and reported on all energies and fractional contributions in both the abstract and main text. revision: yes
Circularity Check
No circularity: direct observational report with external scaling assumptions
full rationale
The paper reports measured equivalent-width variations from high-resolution spectra and converts them to line energies and a bolometric total using a scaling relation calibrated on solar flares. No derivation chain reduces any reported quantity to a fitted parameter or self-citation defined inside the work; the Neupert-effect consistency is an interpretive comparison, not a constructed prediction. The paper explicitly notes M-dwarf differences yet still applies the external calibration, which is an assumption rather than a self-referential loop. This matches the default expectation for an observational case study with no internal predictions or uniqueness theorems.
Axiom & Free-Parameter Ledger
Reference graph
Works this paper leans on
-
[1]
Balona, L. A. 2015, MNRAS, 447, 2714
2015
-
[2]
T., et al
Bellotti, S., Morin, J., Lehmann, L. T., et al. 2023, A&A, 676, A56
2023
-
[3]
1964, in NASA Special Publication, ed
Carmichael, H. 1964, in NASA Special Publication, ed. W. N. Hess, Vol. 50, 451 Crespo-Chacón,I.,Montes,D.,García-Alvarez,D.,etal.2006,A&A, 452, 987
1964
-
[4]
I., Donati, J.-F., Folsom, C
Cristofari, P. I., Donati, J.-F., Folsom, C. P., et al. 2023, MNRAS, 522, 1342
2023
-
[5]
Davenport, J. R. A. 2016, ApJ, 829, 23
2016
-
[6]
R., & Zarro, D
Dennis, B. R., & Zarro, D. M. 1993, Sol. Phys., 146, 177 Fouqué, P., Moutou, C., Malo, L., et al. 2018, MNRAS, 475, 1960
1993
-
[7]
2011, A&A, 534, A133
Fuhrmeister, B., Lalitha, S., Poppenhaeger, K., et al. 2011, A&A, 534, A133
2011
-
[8]
Fuhrmeister, B., Schmitt, J. H. M. M., & Hauschildt, P. H. 2005, A&A, 439, 1137 GaiaCollaboration,Brown,A.G.A.,Vallenari,A.,etal.2021,A&A, 649, A1 Guedel,M.,Benz,A.O.,Schmitt,J.H.M.M.,&Skinner,S.L.1996, ApJ, 471, 1002 Günther, M. N., Zhan, Z., Seager, S., et al. 2020, AJ, 159, 60
2005
-
[9]
L., & Pettersen, B
Hawley, S. L., & Pettersen, B. R. 1991, ApJ, 378, 725
1991
-
[10]
L., Fisher, G
Hawley, S. L., Fisher, G. H., Simon, T., et al. 1995, ApJ, 453, 464 Hawley,S.L.,Allred,J.C.,Johns-Krull,C.M.,etal.2003,ApJ,597, 535
1995
-
[11]
1974, Sol
Hirayama, T. 1974, Sol. Phys., 34, 323
1974
-
[12]
J., Poppenhäger, K., et al
Ilin, E., Schmidt, S. J., Poppenhäger, K., et al. 2021, A&A, 645, A42
2021
-
[13]
M., Hawley, S
Johns-Krull, C. M., Hawley, S. L., Basri, G., & Valenti, J. A. 1997, ApJS, 112, 221
1997
-
[14]
2016, ApJ, 826, 195 Khodachenko,M.L.,Ribas,I.,Lammer,H.,etal.2007,Astrobiology, 7, 167
Kay, C., Opher, M., & Kornbleuth, M. 2016, ApJ, 826, 195 Khodachenko,M.L.,Ribas,I.,Lammer,H.,etal.2007,Astrobiology, 7, 167
2016
-
[15]
G., Chun, M.-Y., et al
Kim, K.-M., Jang, J. G., Chun, M.-Y., et al. 2000, Korean Astronom- ical Society, 15, 119
2000
-
[16]
A., & Pneuman, G
Kopp, R. A., & Pneuman, G. W. 1976, Sol. Phys., 50, 85
1976
-
[17]
2022, A&A, 666, A143
Kossakowski, D., Kürster, M., Henning, T., et al. 2022, A&A, 666, A143
2022
-
[18]
Kowalski, A. F. 2024, Living Reviews in Solar Physics, 21, 1
2024
-
[19]
F., Hawley, S
Kowalski, A. F., Hawley, S. L., Wisniewski, J. P., et al. 2013, ApJS, 207, 15
2013
-
[20]
Lammer, H., Lichtenegger, H. I. M., Kulikov, Y. N., et al. 2007, Astrobiology, 7, 185 Medina,A.A.,Winters,J.G.,Irwin,J.M.,&Charbonneau,D.2020, ApJ, 905, 107
2007
-
[21]
2008, MNRAS, 390, 567 Oh et al
Morin, J., Donati, J.-F., Petit, P., et al. 2008, MNRAS, 390, 567 Oh et al. 11 High-Resolution Spectroscopy of AD Leo Superflare Figure A.1.Same as Figure 2, but for the higher-order Balmer lines: (a) Hβ4861 Å, (b) Hγ4340 Å, (c) Hδ4102 Å, and (d) Hϵ3970 Å
2008
-
[22]
W., Mutabazi, T., & Jurua, E
Muheki, P., Guenther, E. W., Mutabazi, T., & Jurua, E. 2020, A&A, 637, A13
2020
-
[23]
2020, PASJ, 72, 68
Namekata, K., Maehara, H., Sasaki, R., et al. 2020, PASJ, 72, 68
2020
-
[24]
Neupert, W. M. 1968, ApJ, 153, L59
1968
-
[25]
F., Maehara, H., et al
Notsu, Y., Kowalski, A. F., Maehara, H., et al. 2024, ApJ, 961, 189
2024
-
[26]
2025, Ms thesis, Seoul National University
Oh, Y. 2025, Ms thesis, Seoul National University
2025
-
[27]
A., & Wolk, S
Osten, R. A., & Wolk, S. J. 2015, ApJ, 809, 79 Paulson,D.B.,Allred,J.C.,Anderson,R.B.,etal.2006,PASP,118, Oh et al. 12 High-Resolution Spectroscopy of AD Leo Superflare Figure A.2.Same as Figure 2, but for the Heilines: (a) Hei4471 Å, (b) Hei5876 Å, (c) Hei6678 Å, and (d) Hei7065 Å. 227
2015
-
[28]
2022, ApJ, 935, 143
Pietras, M., Falewicz, R., Siarkowski, M., Bicz, K., & Preś, P. 2022, ApJ, 935, 143
2022
-
[29]
2025, ApJ, 980, 196 Savitzky,A.,&Golay,M.J.E.1964,AnalyticalChemistry,36,1627
Ram, D., Mondal, S., Patra, D., Ghosh, S., & Khumbhakar, R. 2025, ApJ, 980, 196 Savitzky,A.,&Golay,M.J.E.1964,AnalyticalChemistry,36,1627
2025
-
[30]
C., & Reid, I
Shkolnik, E., Liu, M. C., & Reid, I. N. 2009, ApJ, 699, 649
2009
-
[31]
A., & Coppi, B
Sturrock, P. A., & Coppi, B. 1966, ApJ, 143, 3 Oh et al. 13 High-Resolution Spectroscopy of AD Leo Superflare Figure A.3.Same as Figure 2, but for the Caiiinfrared triplet lines: (a) Caii8498 Å, (b) Caii8542 Å, and (c) Caii8662 Å. van Dokkum, P. G. 2001, PASP, 113, 1420
1966
-
[32]
2006, Astronomische Nachrichten, 327, 862
Vollmann, K., & Eversberg, T. 2006, Astronomische Nachrichten, 327, 862
2006
-
[33]
2019, ApJS, 241, 29
Yang, H., & Liu, J. 2019, ApJS, 241, 29
2019
-
[34]
T., Girard, T
Zacharias, N., Finch, C. T., Girard, T. M., et al. 2013, AJ, 145, 44 Oh et al. 14 High-Resolution Spectroscopy of AD Leo Superflare Figure A.4.Same as Figure 2, but for the Mgitriplet lines: (a) Mgi5167 Å, (b) Mgi5173 Å, and (c) Mgi5184 Å. Oh et al. 15 High-Resolution Spectroscopy of AD Leo Superflare Figure A.5.Same as Figure 2, but for the Feiiand Naili...
2013
discussion (0)
Sign in with ORCID, Apple, or X to comment. Anyone can read and Pith papers without signing in.