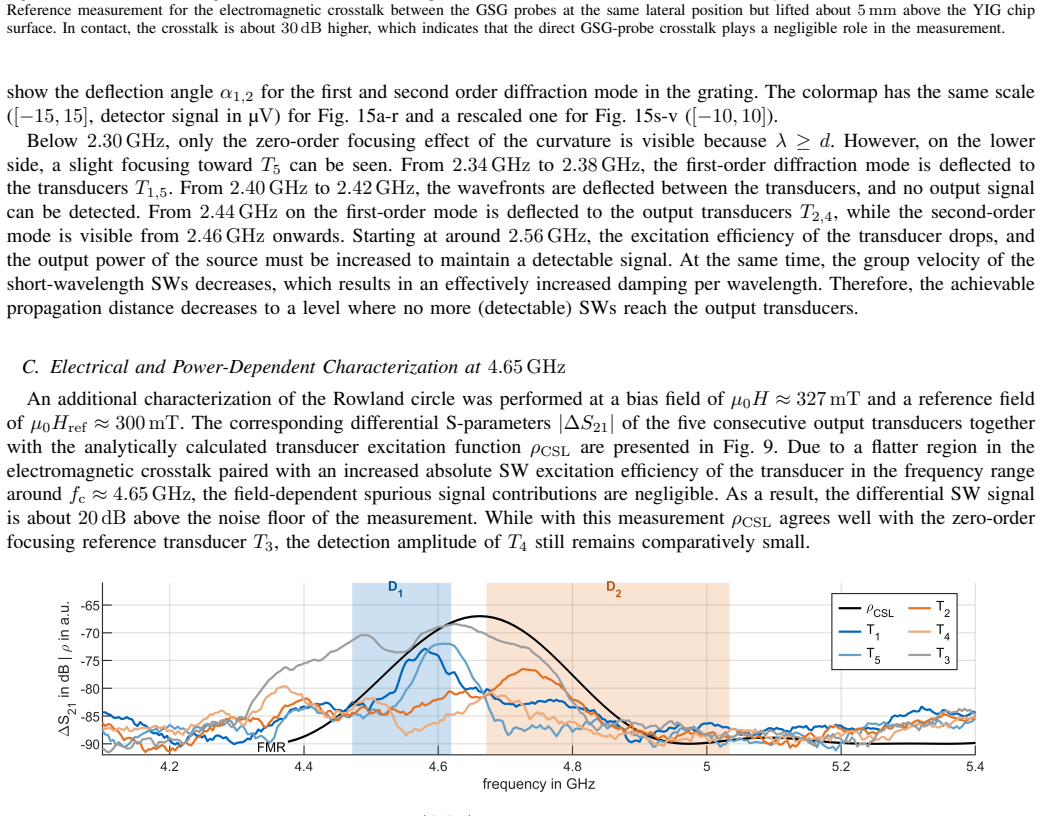
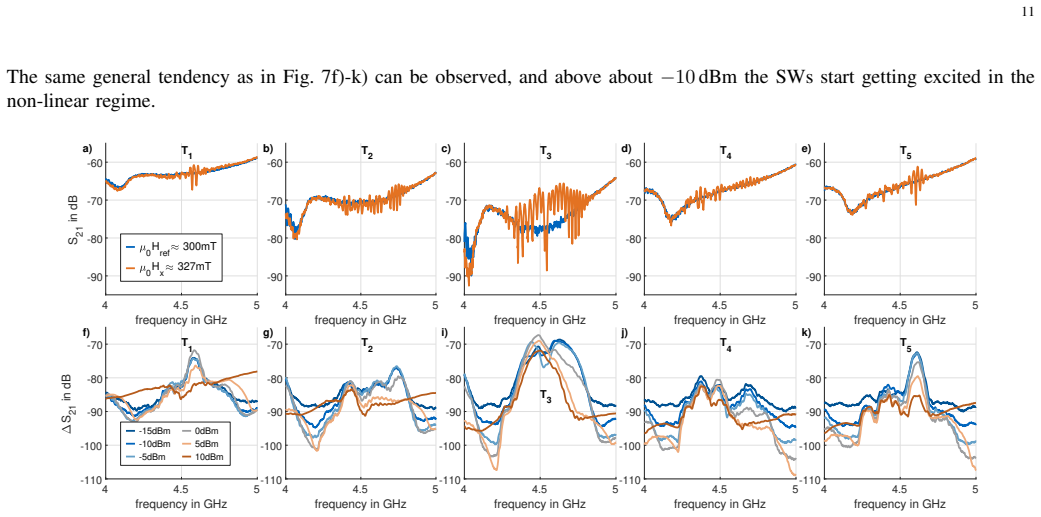
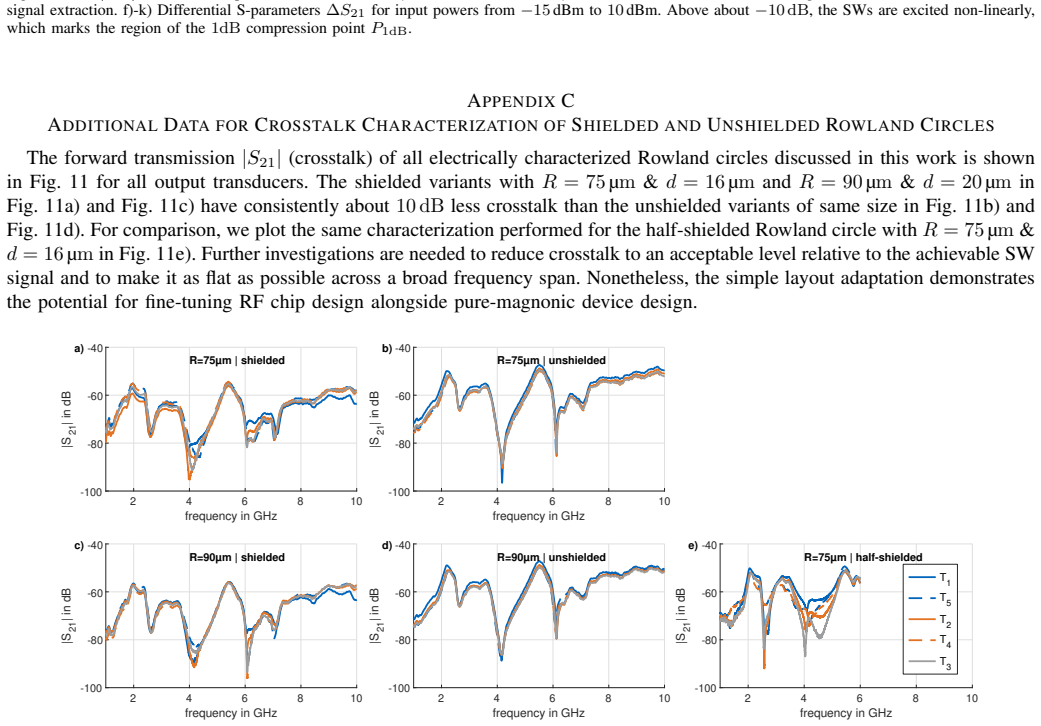
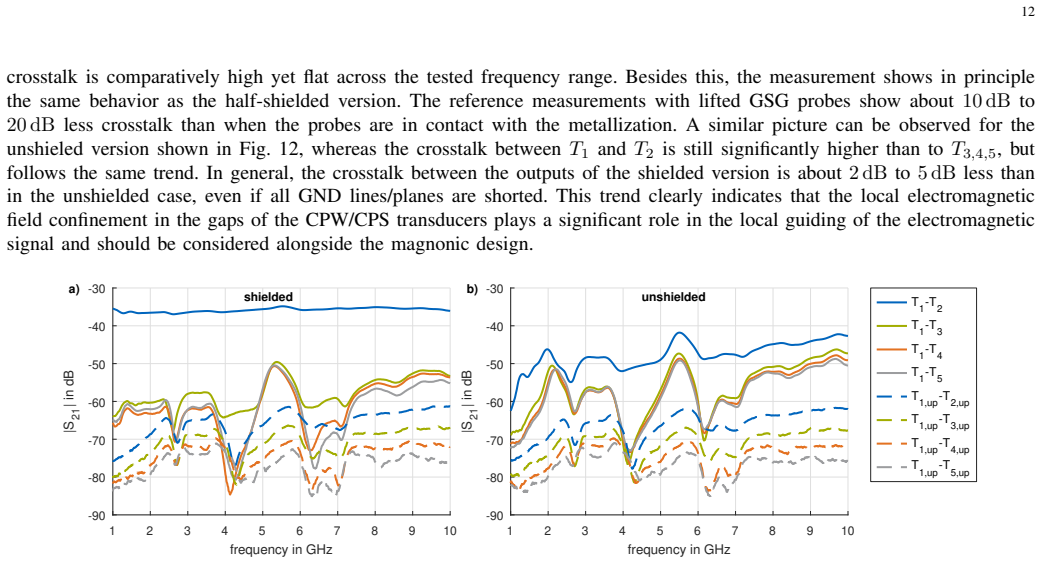
Design and Realization of Broadband Magnonic Spectrometers With Local Electrical Outputs
Pith reviewed 2026-06-30 04:06 UTC · model grok-4.3
The pith
A Rowland circle spectrometer for spin waves is realized with electrical input and local electrical output transducers on YIG films.
A machine-rendered reading of the paper's core claim, the machinery that carries it, and where it could break.
Core claim
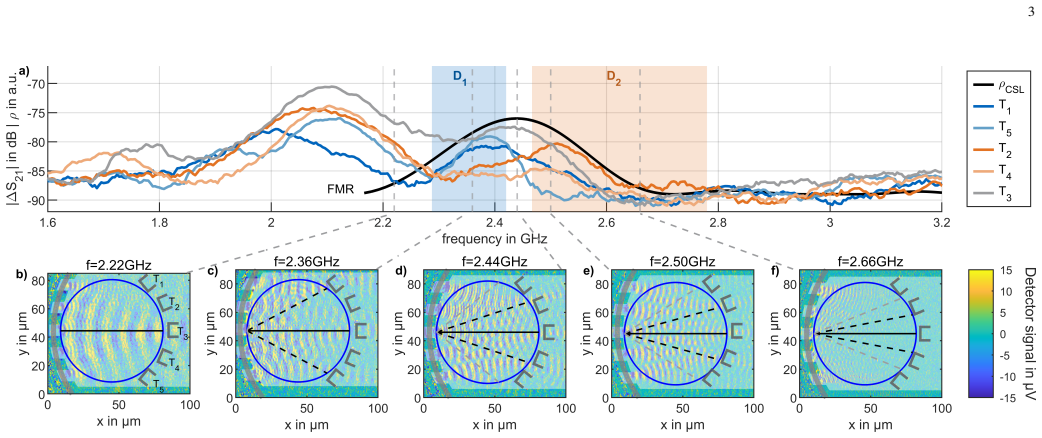
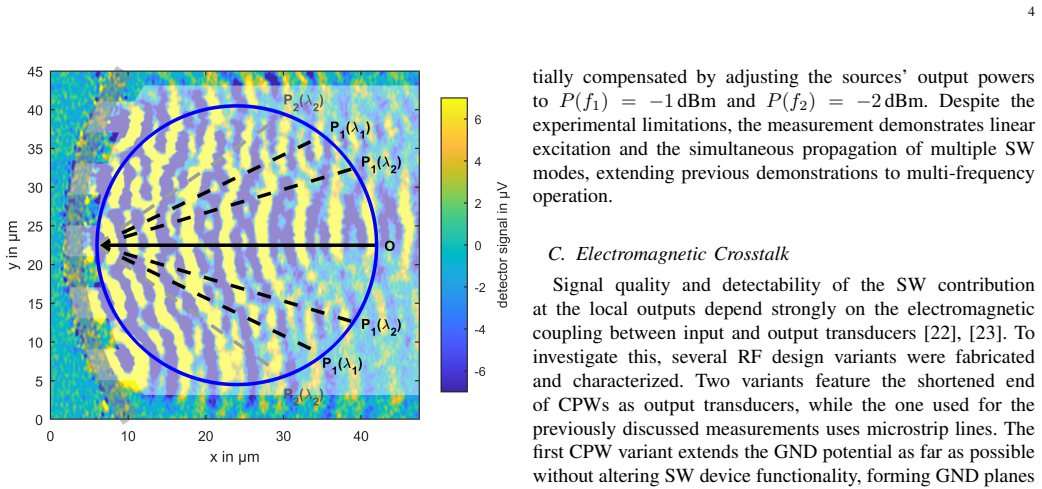
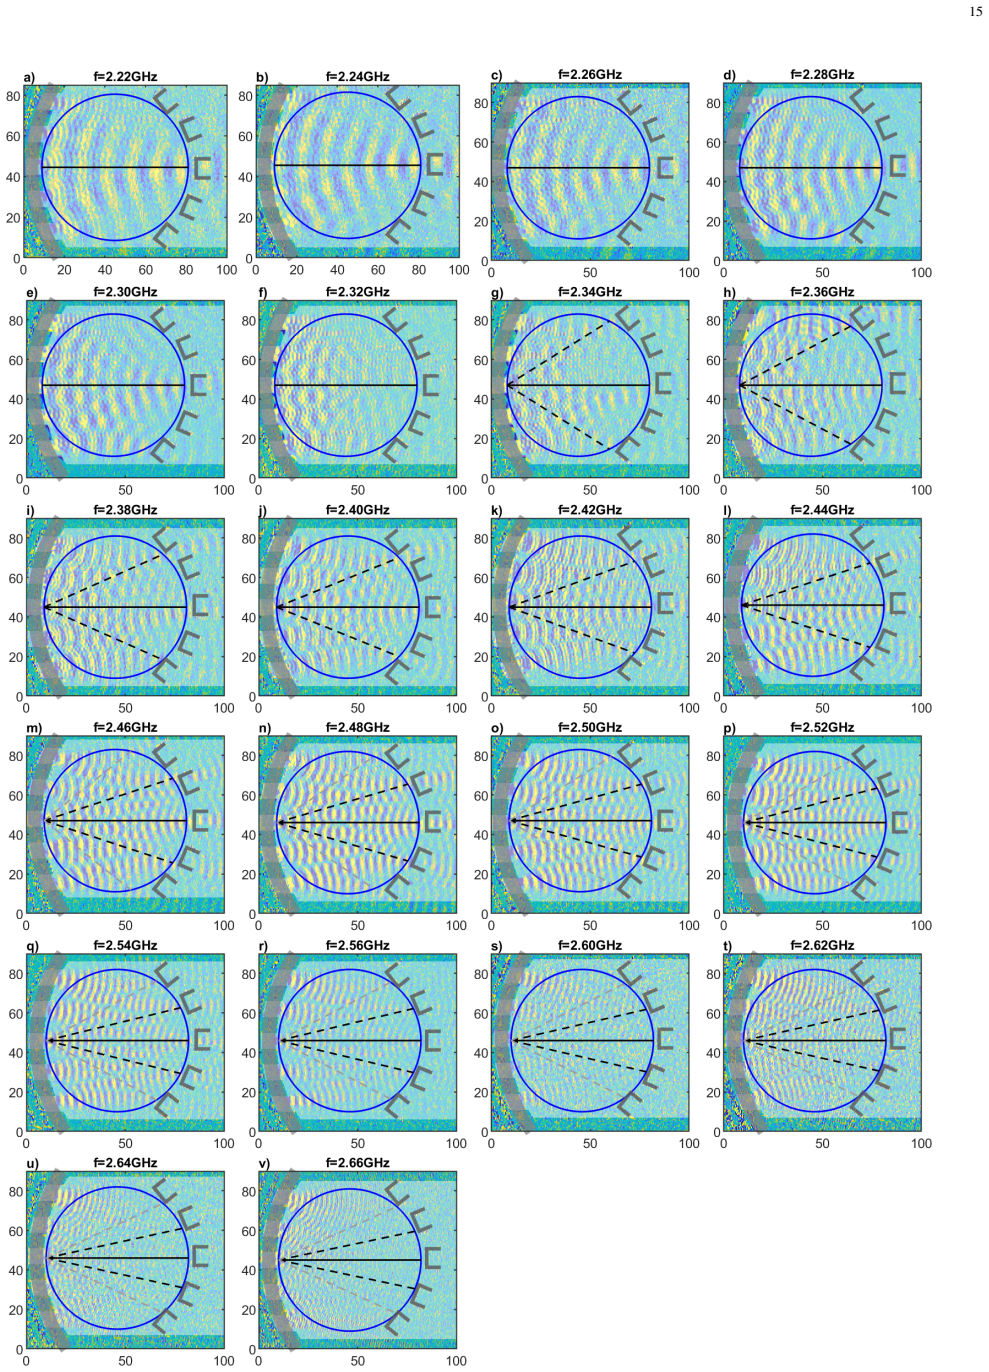
The device functionality is confirmed by combined electrical and magneto-optical measurements, which show that the deflection of SW wavefronts at different input frequencies closely follows the analytically predicted behavior. The linear excitation of SWs via two input tones further confirms the spectrometer operation for simultaneously propagating waves. Beyond the single-device demonstration, a concept for scalable architectures comprising multiple Rowland circles with tunable operating points is proposed.
What carries the argument
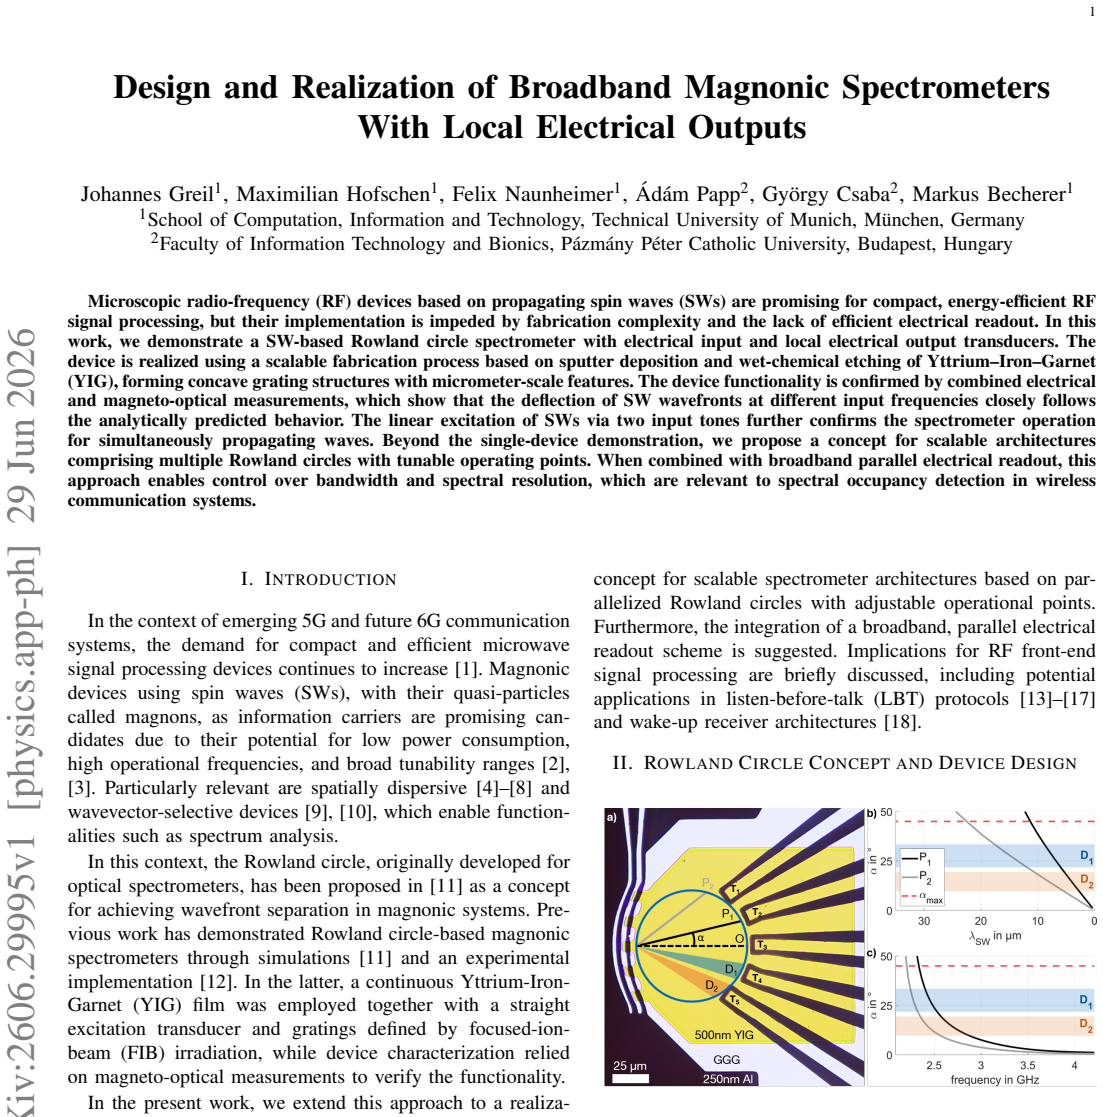
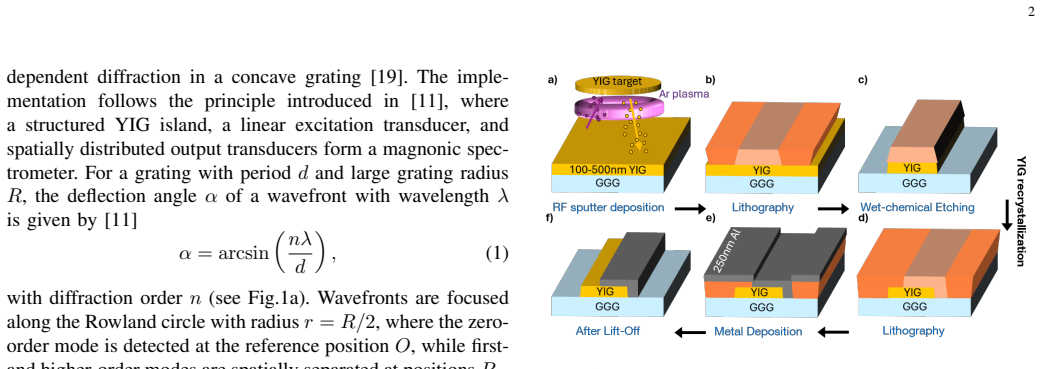
The Rowland circle geometry with concave grating structures in a YIG film that focuses spin waves of different frequencies onto distinct local electrical output transducers.
If this is right
- The spectrometer enables compact RF signal processing with electrical readout.
- Multiple Rowland circles allow control over bandwidth and spectral resolution.
- The architecture supports broadband parallel electrical readout for simultaneous waves.
- It targets applications in spectral occupancy detection for wireless systems.
Where Pith is reading between the lines
- The fabrication method could extend to other magnonic devices requiring curved structures.
- Tunable circles might enable reconfigurable spectrum analyzers in integrated RF circuits.
- Direct comparison of electrical output signals to optical images could quantify conversion efficiency.
Load-bearing premise
The sputter deposition and wet-chemical etching process reliably produces the micrometer-scale concave grating features needed for the Rowland circle geometry to function as predicted.
What would settle it
Observation that spin-wave wavefront deflection angles at varying input frequencies deviate from the analytically predicted values would falsify the central claim.
Figures
read the original abstract
Microscopic radio-frequency (RF) devices based on propagating spin waves (SWs) are promising for compact, energy-efficient RF signal processing, but their implementation is impeded by fabrication complexity and the lack of efficient electrical readout. In this work, we demonstrate a SW-based Rowland circle spectrometer with electrical input and local electrical output transducers. The device is realized using a scalable fabrication process based on sputter deposition and wet-chemical etching of Yttrium-Iron-Garnet (YIG), forming concave grating structures with micrometer-scale features. The device functionality is confirmed by combined electrical and magneto-optical measurements, which show that the deflection of SW wavefronts at different input frequencies closely follows the analytically predicted behavior. The linear excitation of SWs via two input tones further confirms the spectrometer operation for simultaneously propagating waves. Beyond the single-device demonstration, we propose a concept for scalable architectures comprising multiple Rowland circles with tunable operating points. When combined with broadband parallel electrical readout, this approach enables control over bandwidth and spectral resolution, which are relevant to spectral occupancy detection in wireless communication systems.
Editorial analysis
A structured set of objections, weighed in public.
Referee Report
Summary. The manuscript claims to demonstrate a spin-wave (SW) based Rowland-circle spectrometer fabricated in YIG via sputter deposition and wet-chemical etching, featuring electrical input and local electrical output transducers. Functionality is asserted to be confirmed by combined electrical and magneto-optical measurements showing that SW wavefront deflections at varying input frequencies match analytical predictions, with additional verification via linear excitation using two simultaneous input tones. The work also proposes scalable multi-Rowland-circle architectures with tunable bandwidth and resolution for spectral occupancy detection.
Significance. If the quantitative match between measured wavefront deflections and analytical predictions holds, the result would be significant for applied magnonics: it addresses fabrication complexity and readout limitations in propagating-SW RF devices and provides a concrete path toward compact, energy-efficient spectral processors. The emphasis on scalable YIG processing and parallel electrical readout architectures strengthens the practical relevance.
major comments (2)
- [Abstract / Results] Abstract and results: the central claim that 'measurements confirm analytical predictions' and that 'deflection of SW wavefronts ... closely follows the analytically predicted behavior' lacks any reported quantitative metrics (e.g., angular deviation, RMS error, or statistical comparison) or error bars. Without these, the strength of the experimental confirmation cannot be evaluated and is load-bearing for the spectrometer demonstration.
- [Fabrication / Methods] Fabrication section: the assertion that the sputter-deposition + wet-chemical-etch process 'reliably produces the micrometer-scale concave grating features needed for the Rowland circle geometry' is presented without supporting metrology (SEM/AFM statistics, feature-size histograms, or edge-roughness values). This directly affects whether the observed deflections can be attributed to the designed geometry.
minor comments (2)
- Figure captions should explicitly state the analytical model (e.g., dispersion relation or grating equation) used for the predicted deflection angles so that readers can reproduce the comparison.
- Clarify the frequency range, YIG thickness, and bias-field values used in both the analytical predictions and the measurements to allow direct comparison.
Simulated Author's Rebuttal
We thank the referee for their thorough review and constructive feedback. We have carefully considered the major comments and provide point-by-point responses below. Where appropriate, we have revised the manuscript to address the concerns raised.
read point-by-point responses
-
Referee: [Abstract / Results] Abstract and results: the central claim that 'measurements confirm analytical predictions' and that 'deflection of SW wavefronts ... closely follows the analytically predicted behavior' lacks any reported quantitative metrics (e.g., angular deviation, RMS error, or statistical comparison) or error bars. Without these, the strength of the experimental confirmation cannot be evaluated and is load-bearing for the spectrometer demonstration.
Authors: We agree with the referee that quantitative metrics are important for rigorously evaluating the agreement between experiment and theory. Although the manuscript describes the qualitative match, we will revise the Results section to include error bars on the deflection angle data points and compute the root-mean-square (RMS) error between the measured and analytically predicted deflections. These additions will be based on the existing measurement data and will strengthen the central claim. revision: yes
-
Referee: [Fabrication / Methods] Fabrication section: the assertion that the sputter-deposition + wet-chemical-etch process 'reliably produces the micrometer-scale concave grating features needed for the Rowland circle geometry' is presented without supporting metrology (SEM/AFM statistics, feature-size histograms, or edge-roughness values). This directly affects whether the observed deflections can be attributed to the designed geometry.
Authors: The referee correctly identifies that metrology data is not currently included. To address this, we will add representative SEM images of the fabricated gratings along with statistical analysis of feature sizes (including mean and standard deviation from multiple measurements) and edge roughness values to the Methods section. This will confirm that the process reliably achieves the required geometry. revision: yes
Circularity Check
No significant circularity detected
full rationale
The paper is an experimental demonstration of a fabricated magnonic spectrometer whose functionality is validated by direct electrical and magneto-optical measurements of spin-wave wavefront deflection. The abstract and described argument contain no equations, no fitted parameters presented as predictions, and no load-bearing self-citations or uniqueness theorems. The match to 'analytically predicted behavior' is an external benchmark comparison rather than a self-referential derivation, leaving the central claim self-contained against fabrication and measurement evidence.
Axiom & Free-Parameter Ledger
Reference graph
Works this paper leans on
-
[1]
Review on Spin-Wave RF Applications,
K. O. Levchenko, K. Dav ´ıdkov´a, J. Mikkelsenet al., “Review on Spin-Wave RF Applications,”IEEE Transactions on Magnetics, vol. 62, no. 5, May 2026. [Online]. Available: http://dx.doi.org/10.1109/tmag. 2026.3657608
-
[2]
The 2024 magnonics roadmap,
B. Flebus, D. Grundler, B. Ranaet al., “The 2024 magnonics roadmap,” Journal of Physics: Condensed Matter, vol. 36, no. 36, p. 363501, Jun
2024
-
[3]
Available: http://dx.doi.org/10.1088/1361-648X/ad399c
[Online]. Available: http://dx.doi.org/10.1088/1361-648X/ad399c
-
[4]
Q. Wang, G. Csaba, R. Verbaet al., “Nanoscale magnonic networks,” Physical Review Applied, vol. 21, no. 4, Apr. 2024. [Online]. Available: http://dx.doi.org/10.1103/PhysRevApplied.21.040503
-
[5]
Towards graded-index magnonics: Steering spin waves in magnonic networks,
C. S. Davies, A. Francis, A. V . Sadovnikovet al., “Towards graded-index magnonics: Steering spin waves in magnonic networks,” Physical Review B, vol. 92, no. 2, Jul. 2015. [Online]. Available: http://dx.doi.org/10.1103/PhysRevB.92.020408
-
[6]
Quadraticdispersionrelationsingaplessfrustration- free systems.Phys
N. J. Whitehead, S. A. R. Horsley, T. G. Philbinet al., “Graded index lenses for spin wave steering,”Physical Review B, vol. 100, no. 9, Sep. 2019. [Online]. Available: http://dx.doi.org/10.1103/PhysRevB. 100.094404
-
[7]
Optical elements for anisotropic spin-wave propagation,
M. V ogel, P. Pirro, B. Hillebrandset al., “Optical elements for anisotropic spin-wave propagation,”Applied Physics Letters, vol. 116, no. 26, Jun. 2020. [Online]. Available: http://dx.doi.org/10.1063/5. 0018519
work page doi:10.1063/5 2020
-
[8]
Experimental Demonstration of a Spin-Wave Lens Designed With Machine Learning,
M. Kiechle, L. Maucha, V . Ahrenset al., “Experimental Demonstration of a Spin-Wave Lens Designed With Machine Learning,”IEEE Magnetics Letters, vol. 13, p. 1–5, 2022. [Online]. Available: http://dx.doi.org/10.1109/LMAG.2022.3209647
-
[9]
Spin-Wave Optics in YIG Realized by Ion-Beam Irradiation,
M. Kiechle, A. Papp, S. Mendischet al., “Spin-Wave Optics in YIG Realized by Ion-Beam Irradiation,”Small, vol. 19, no. 21, Feb. 2023. [Online]. Available: http://dx.doi.org/10.1002/smll.202207293
-
[10]
Engineered Magnetization Dynamics of Magnonic Nanograting Filters,
R. Yagan, F. Katmis, and M. C. Onbas ¸lı, “Engineered Magnetization Dynamics of Magnonic Nanograting Filters,”Magnetochemistry, vol. 7, no. 6, p. 81, Jun. 2021. [Online]. Available: http://dx.doi.org/10.3390/ magnetochemistry7060081
2021
-
[11]
Mode selective excitation of spin waves,
T. Taniguchi and C. H. Back, “Mode selective excitation of spin waves,”Applied Physics Letters, vol. 120, no. 3, Jan. 2022. [Online]. Available: http://dx.doi.org/10.1063/5.0080716
-
[12]
Nanoscale spectrum analyzer based on spin-wave interference,
A. Papp, W. Porod, A. I. Csurgayet al., “Nanoscale spectrum analyzer based on spin-wave interference,”Scientific Reports, vol. 7, no. 1, Aug. 2017. [Online]. Available: http://dx.doi.org/10.1038/ s41598-017-09485-7
2017
-
[13]
Experimental demonstration of a concave grating for spin waves in the Rowland arrangement,
A. Papp, M. Kiechle, S. Mendischet al., “Experimental demonstration of a concave grating for spin waves in the Rowland arrangement,” Scientific Reports, vol. 11, no. 1, Jul. 2021. [Online]. Available: http://dx.doi.org/10.1038/s41598-021-93700-z
-
[14]
LTE-unlicensed: the future of spectrum aggregation for cellular networks,
R. Zhang, M. Wang, L. X. Caiet al., “LTE-unlicensed: the future of spectrum aggregation for cellular networks,”IEEE Wireless Communications, vol. 22, no. 3, p. 150–159, Jun. 2015. [Online]. Available: http://dx.doi.org/10.1109/MWC.2015.7143339
-
[15]
New radio beam-based access to unlicensed spectrum: Design challenges and solutions,
S. Lagen, L. Giupponi, S. Goyalet al., “New radio beam-based access to unlicensed spectrum: Design challenges and solutions,”IEEE Communications Surveys & Tutorials, vol. 22, no. 1, p. 8–37, 2020. [Online]. Available: http://dx.doi.org/10.1109/COMST.2019.2949145
-
[16]
A Unified Analytical Approach to Multi-Cell LBT-Based Spectrum Sharing Systems,
Y . Ma, S. Mosleh, and J. B. Coder, “A Unified Analytical Approach to Multi-Cell LBT-Based Spectrum Sharing Systems,” inThe 2020 IEEE 91st Vehicular Technology Conference: VTC2020-Spring, T. . I. 91st Vehicular Technology Conference: VTC2020-Spring, Ed., 2020
2020
-
[17]
A. M. Baswade, M. Reddy, A. F. A.et al., “Performance analysis of spatially distributed LTE-U/NR-U and Wi-Fi networks: An analytical model for coexistence study,”Journal of Network and Computer Applications, vol. 191, p. 103157, Oct. 2021. [Online]. Available: http://dx.doi.org/10.1016/j.jnca.2021.103157
-
[18]
Towards Software-Centric Listen-Before-Talk on Software-Defined Radios,
S. Brauer, A. Zubow, and F. Dressler, “Towards Software-Centric Listen-Before-Talk on Software-Defined Radios,” in2021 IEEE Wireless Communications and Networking Conference (WCNC). IEEE, Mar. 2021, p. 1–7. [Online]. Available: http://dx.doi.org/10.1109/ WCNC49053.2021.9417395
-
[19]
3gpp release 18 wake-up receiver: Feature overview and evaluations,
A. H ¨oglund, M. Mozaffari, Y . Yanget al., “3gpp release 18 wake-up receiver: Feature overview and evaluations,”IEEE Communications Standards Magazine, vol. 8, no. 3, p. 10–16, Sep. 2024. [Online]. Available: http://dx.doi.org/10.1109/MCOMSTD.0001.2400002
-
[20]
James,Spectrograph Design Fundamentals
J. James,Spectrograph Design Fundamentals. Cambridge University Press, 2007
2007
-
[21]
B. A. Kalinikos and A. N. Slavin, “Theory of dipole-exchange spin wave spectrum for ferromagnetic films with mixed exchange boundary conditions,”Journal of Physics C: Solid State Physics, vol. 19, no. 35, p. 7013–7033, Dec. 1986. [Online]. Available: http://dx.doi.org/10.1088/0022-3719/19/35/014
-
[22]
Radio Regulations Articles,
ITU, “Radio Regulations Articles,” International Telecommunication Union, Tech. Rep., 2024
2024
-
[23]
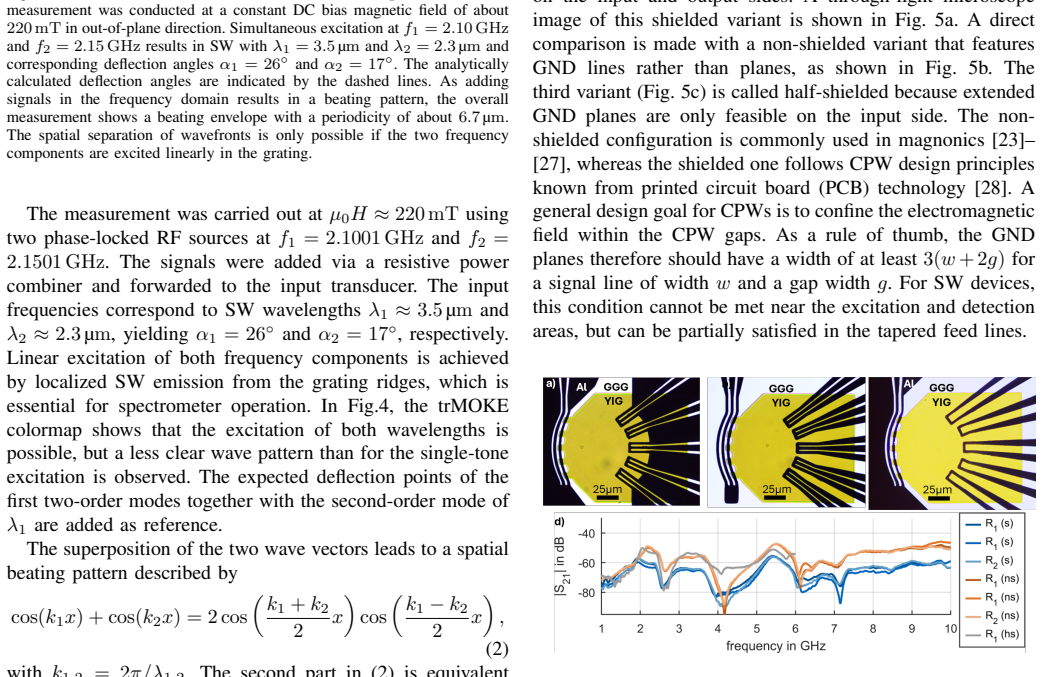
Secondary Excitation of Spin Waves: How Electromagnetic Crosstalk Impacts Magnonic Devices,
J. Greil, M. Golibrzuch, M. Kiechleet al., “Secondary Excitation of Spin Waves: How Electromagnetic Crosstalk Impacts Magnonic Devices,” IEEE Transactions on Magnetics, vol. 59, no. 11, p. 1–5, Nov. 2023. [Online]. Available: http://dx.doi.org/10.1109/TMAG.2023.3292545
-
[24]
F. Kohl, B. Heinz, M. Wagneret al., “Modeling interference of spin-waves and electromagnetic leakage in micron-scaled spin-wave transducers,”Applied Physics Letters, vol. 128, no. 16, Apr. 2026. [Online]. Available: http://dx.doi.org/10.1063/5.0308357
-
[25]
Spin-wave transduction at the submicrometer scale: Experiment and modeling,
V . Vlaminck and M. Bailleul, “Spin-wave transduction at the submicrometer scale: Experiment and modeling,”Physical Review B, vol. 81, no. 1, Jan. 2010. [Online]. Available: http://dx.doi.org/10.1103/ PhysRevB.81.014425
2010
-
[26]
Electrical spectroscopy of forward volume spin waves in perpendicularly magnetized materials,
M. Sushruth, M. Grassi, K. Ait-Oukaciet al., “Electrical spectroscopy of forward volume spin waves in perpendicularly magnetized materials,” Physical Review Research, vol. 2, no. 4, Nov. 2020. [Online]. Available: http://dx.doi.org/10.1103/PhysRevResearch.2.043203
-
[27]
Efficient electromagnetic transducers for spin-wave devices,
D. A. Connelly, G. Csaba, H. R. O. Aquinoet al., “Efficient electromagnetic transducers for spin-wave devices,”Scientific Reports, vol. 11, no. 1, Sep. 2021. [Online]. Available: http://dx.doi.org/10.1038/ s41598-021-97627-3
2021
-
[28]
Optimizing propagating spin wave spectroscopy,
J. Lucassen, C. F. Schippers, L. Ruttenet al., “Optimizing propagating spin wave spectroscopy,”Applied Physics Letters, vol. 115, no. 1, Jul
-
[29]
Available: http://dx.doi.org/10.1063/1.5090892
[Online]. Available: http://dx.doi.org/10.1063/1.5090892
-
[30]
R. N. Simons,Coplanar Waveguide Circuits, Comonent, and Systems, John Wiley $ Sons, Inc., Ed. John Wiley $ Sons, Inc., 2001
2001
-
[31]
Lumped circuit model for inductive antenna spin-wave transducers,
F. Vanderveken, V . Tyberkevych, G. Talmelliet al., “Lumped circuit model for inductive antenna spin-wave transducers,”Scientific Reports, vol. 12, no. 1, Mar. 2022. [Online]. Available: http: //dx.doi.org/10.1038/s41598-022-07625-2
-
[32]
Design rules for low-insertion- loss magnonic transducers,
R. Erd ´elyi, G. Csaba, L. Mauchaet al., “Design rules for low-insertion- loss magnonic transducers,”Scientific Reports, vol. 15, no. 1, Mar. 2025. [Online]. Available: http://dx.doi.org/10.1038/s41598-025-94474-4
-
[33]
Magnetoresistive detection of spin waves,
Q. Rossi, D. Stoeffler, G. De Loubens, H. Merbouche, H. Majjad, Y . Henry, I. Ngouagnia, A. Solignac, and M. Bailleul, “Magnetoresistive detection of spin waves,”Science Advances, vol. 11, no. 33, Aug
-
[34]
Available: http://dx.doi.org/10.1126/sciadv.adx4126
[Online]. Available: http://dx.doi.org/10.1126/sciadv.adx4126
-
[35]
Dispersion- tunable low-loss implanted spin-wave waveguides for large magnonic networks,
J. Bensmann, R. Schmidt, K. O. Nikolaevet al., “Dispersion- tunable low-loss implanted spin-wave waveguides for large magnonic networks,”Nature Materials, vol. 24, no. 12, p. 1920–1926, Jul. 2025. [Online]. Available: http://dx.doi.org/10.1038/s41563-025-02282-y
-
[36]
Establishing the Magnetoelastic Origin of Spin-Wave Routing through Focused Ion Beam Patterning,
F. Naunheimer, J. Greil, V . Ahrenset al., “Establishing the Magnetoelastic Origin of Spin-Wave Routing through Focused Ion Beam Patterning,” 2026. [Online]. Available: https://arxiv.org/abs/2602.10797
-
[37]
Roadmap for focused ion beam technologies,
K. H ¨oflich, G. Hobler, F. I. Allenet al., “Roadmap for focused ion beam technologies,”Applied Physics Reviews, vol. 10, no. 4, Dec
-
[38]
Available: http://dx.doi.org/10.1063/5.0162597
[Online]. Available: http://dx.doi.org/10.1063/5.0162597
-
[39]
The effect of ga-ion irradiation on sub-micron-wavelength spin waves in yttrium-iron-garnet films,
J. Greil, M. Kiechle, A. Pappet al., “The effect of ga-ion irradiation on sub-micron-wavelength spin waves in yttrium-iron-garnet films,” Nanotechnology, vol. 36, no. 13, p. 135301, Feb. 2025. [Online]. Available: http://dx.doi.org/10.1088/1361-6528/adad7d
-
[40]
5G; NR; Base Station (BS) radio transmission and reception,
3GPP, “5G; NR; Base Station (BS) radio transmission and reception,” 3GPP TS 38.104 version 18.5.0, May 2024, release 18
2024
-
[41]
IEEE 802.11be-2024,
802.11 Wireless LAN Working Group, “IEEE 802.11be-2024,” IEEE Standards Association, Tech. Rep., 2024
2024
-
[42]
Bat63-02v: Single silicon rf schottky diode,
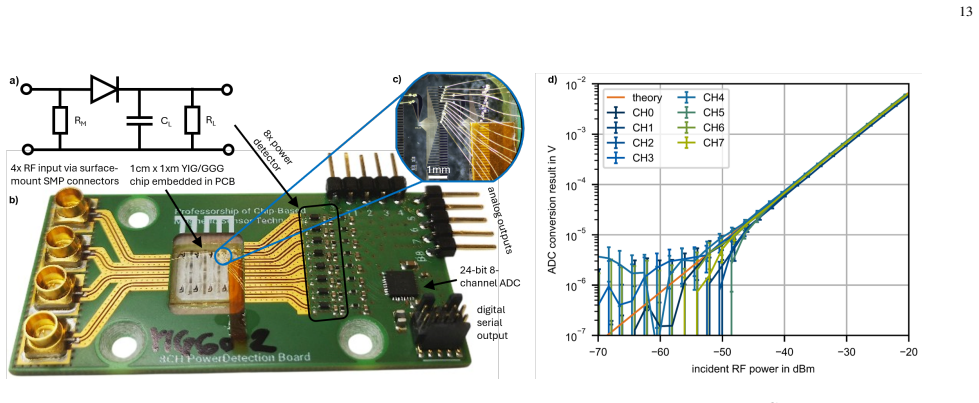
I. Technologies, “Bat63-02v: Single silicon rf schottky diode,” online,
-
[43]
Available: https://www.infineon.com/part/BAT63-02V
[Online]. Available: https://www.infineon.com/part/BAT63-02V
-
[44]
Ads131m08 8-channel, simultaneously-sampling, 24- bit, delta-sigma adc,
T. Instruments, “Ads131m08 8-channel, simultaneously-sampling, 24- bit, delta-sigma adc,” online, 2021. [Online]. Available: https: //www.ti.com/product/de-de/ADS131M08
2021
-
[45]
EN 301 893 V2.2.1 (2024-11): GHz W AS/RLAN; Harmonised Standard for access to radio spectrum,
ETSI, “EN 301 893 V2.2.1 (2024-11): GHz W AS/RLAN; Harmonised Standard for access to radio spectrum,” European Telecommunications Standards Institute, Tech. Rep., 2024
2024
-
[46]
Characterizing the linearity of magnonic devices for radio-frequency applications,
R. Erdelyi, A. P. L. Maucha, P. Pirroet al., “Characterizing the linearity of magnonic devices for radio-frequency applications,” 2026. [Online]. Available: https://arxiv.org/abs/2603.27470
-
[47]
Thumm, W
M. Thumm, W. Wiesbeck, and S. Kern,Hochfrequenzmesstechnik Ver- fahren und Messsysteme, 2nd ed. Wiesbaden: Vieweg+Teubner Verlag, 1998. 8 APPENDIXA ANALYTICALMODELS ANDCALCULATIONS A. Analytical Dispersion Relation and Group Velocity We used the SW dispersion relation developed by Kalinikos and Slavin [20] to calculate ω= » (ω0 +ω Mλexk2)(ω0 +ω Mλexk2 +ω ...
1998
discussion (0)
Sign in with ORCID, Apple, or X to comment. Anyone can read and Pith papers without signing in.