REVIEW 3 major objections 5 minor 59 references
Estimating infall times of galaxies around clusters: how accurately can it be done with observational data?
T0 review · 3 major / 5 minor · reviewed 2026-08-07 · deepseek-v4-flash
Pith's one-line read Orbital overlap caps galaxy infall-time accuracy at about 2.6 Gyr.
desk verdict A clean methods comparison shows all R-V infall-time estimators are capped near 2.5-2.6 Gyr by orbital overlap, but the paper's <1.5 Gyr two-estimate improvement and 'fundamental' wording rest on an untested oracle split. read the letter →
The pith
A machine-rendered reading of the paper's core claim, the machinery that carries it, and where it could break.
The reading
What carries the argument
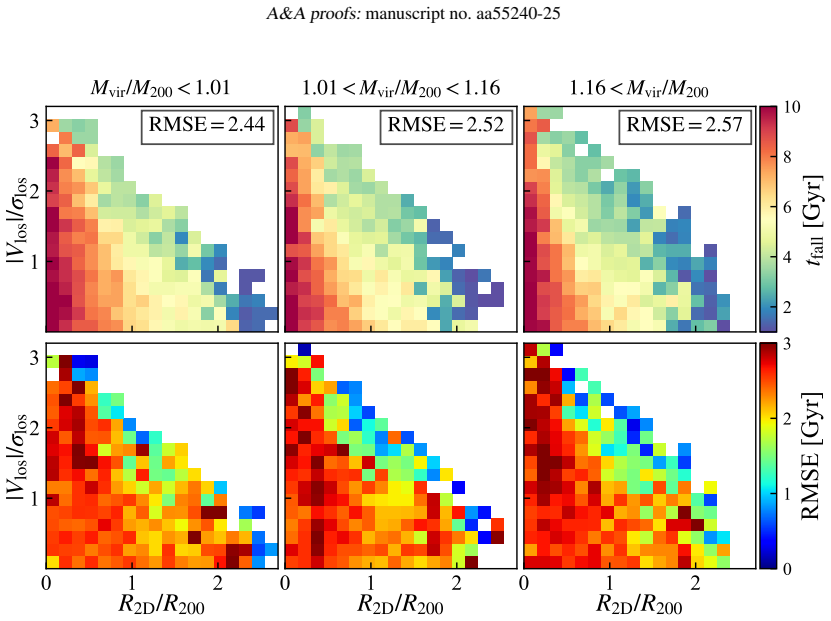
The R-V diagram, with $R=R_{2D}/R_{200}$ and $V=V_{\rm los}/\sigma_{\rm los}$, is the observational projection of the infall problem. The evaluation is carried by the RMSE of true infall time around the median in each diagram pixel or zone, which quantifies the fundamental scatter. The paper introduces a linear distance $d_{\rm linear}=(|V|-kR)/\sqrt{1+k^2}$ from the origin to an oblique partition line, calibrates the optimal slope $k=-3.7$ in 2D via the Spearman rank correlation, and uses it as the reference estimator. The orbital-overlap argument rests on a two-component Gaussian mixture fit per zone for the two-estimate improvement, and on a six-component fit of the global infall-time distribution compared with six orbital-phase populations defined by pericentre and apocentre counts.
What would settle it
Run a simulation with known infall times and test whether adding a measured galaxy property such as colour, star formation rate, or gas fraction to the R-V position lowers the estimation RMSE below 2.5 Gyr; if any property does, the claimed orbital-overlap ceiling is not fundamental.
Extended reading notes
Core claim
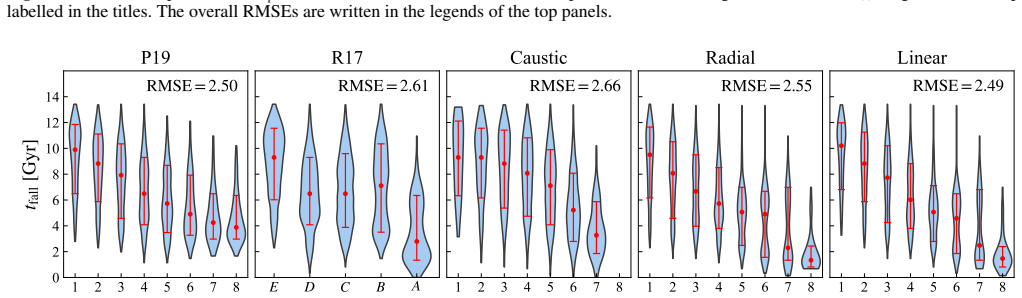
The paper's central claim is that the infall time of a galaxy cannot be recovered from the R-V diagram more accurately than the diagram's intrinsic dispersion, measured here as 2.53 Gyr, and that no partition of this diagram decisively beats any other: a simple linear cut has RMSE 2.56 Gyr, while caustic, radius, and the two published zone recipes all fall within roughly 0.1 Gyr of it. The reason is orbital overlap, demonstrated by decomposing the full infall-time distribution into six Gaussian components that align with six orbital-phase populations; each population has its own scatter below about 1.5 Gyr, but the populations occupy the same projected positions, so a galaxy's location in the R-V diagram is a mixture of very different infall histories. Two improvement routes are established: selecting dynamically relaxed clusters lowers the dispersion by about 0.1 Gyr, and switching from one median estimate to two estimates per zone reduces the scatter to about 1.5 Gyr or less, assuming the two populations can be identified. The paper also notes that outermost zones are dominated by interlopers and should be interpreted cautiously.
Load-bearing premise
The only route the paper offers below 2.6 Gyr assumes observers can reliably classify galaxies as early-infall or late-infall from their physical properties, a classification the paper assumes but never tests.
Editorial extensions
If this is right
- Any recipe restricted to projected radius and line-of-sight velocity inherits the same roughly 2.5 Gyr intrinsic scatter, so the choice among partitions is secondary.
- A simple linear cut through the R-V diagram is the cheapest reliable estimator, matching or slightly beating the more elaborate zone recipes.
- Restricting samples to dynamically relaxed clusters reduces the typical error by only about 0.1 Gyr, so cluster selection is not a strong lever.
- Reporting two plausible infall times per galaxy rather than one can reduce per-zone scatter to about 1.5 Gyr or less, if the earlier-infall and later-infall populations can be separated.
- Outer zones of the R-V diagram are more than half interlopers, so infall-time estimates in the outermost parts of the diagram should be treated as unreliable.
Reading between the lines
- A testable next step is to check whether any single galaxy property, such as colour, star formation rate, or gas fraction, separates the two Gaussian populations per zone; if it does, the two-estimate accuracies become achievable with existing cluster surveys.
- The paper's use of 'fundamental' applies to estimators built only from R and V; non-kinematic observables are an open route the paper itself suggests but does not test.
- A cleaner causal test of the orbital-overlap explanation would define orbital populations purely from dynamical histories in the simulation, then measure how separable those populations are in observable space, rather than choosing population boundaries to match a Gaussian mixture.
- If the orbital-overlap ceiling holds, infall-time analyses in galaxy-evolution studies should shift from point estimates to explicitly reporting the bimodal distribution of possible infall times.
Editorial analysis
A structured set of objections, weighed in public.
Referee Report
Summary. The paper uses the TNG300-1 simulation to construct projected phase-space (R–V) diagrams for 136 massive clusters (408 line-of-sight projections) and systematically compares five methods for estimating galaxy infall times: projected radius, caustic distance, a newly proposed linear partition, the R17 five-zone scheme, and the P19 eight-zone scheme. All methods are evaluated on the same simulated galaxy sample with a common infall-time definition (first crossing of 3 R200). The authors report that all methods achieve similar root-mean-square errors (RMSE ≈ 2.5–2.7 Gyr), close to the intrinsic pixel-level dispersion of 2.53 Gyr, and that the simple linear partition performs marginally best. They attribute this irreducible-looking scatter to orbital overlap: galaxies on different orbital phases with different infall times occupy the same regions of the R–V diagram. Two possible improvements are explored: restricting analysis to dynamically relaxed clusters (gain of only ~0.1 Gyr) and replacing a single median infall time per zone with two Gaussian-mixture estimates per zone, which lowers the per-zone RMSE to about 1.0–1.5 Gyr under the assumption that galaxies can be reliably classified into earlier- and later-infall populations. The paper concludes that orbital overlap fundamentally limits infall-time accuracy and recommends linear partitioning as a simple and robust empirical estimator.
Significance. If the central dispersion analysis is correct, the paper provides a useful quantitative benchmark for the many observational studies that adopt R–V diagram infall-time estimators: it shows that differences between existing methods are negligible compared with the intrinsic scatter and that a simple linear partition captures the trend as well as more complex recipes. The comparison is performed on a well-known public simulation with a clear and consistent normalization, and the authors are appropriately cautious about the small differences between methods (≈0.1 Gyr). The two-estimate idea is a constructive suggestion, but the headline improvement to ≲1.5 Gyr currently rests on an untested oracle classification, and the word 'fundamentally' overstates the scope of the result, which is conditional on using only projected radius and line-of-sight velocity. With revision, the paper can serve as a valuable reference for the infall-time estimation literature.
major comments (3)
- [Sec. 5.2, Table 1] The RMSEtwo values in Table 1 are computed by comparing each galaxy's true infall time with both GMM peak estimates and retaining the smaller error. No observable property is used to choose between t1 and t2; the calculation assumes the authors can 'reliably divide galaxies into earlier-infall and later-infall populations.' This is an oracle bound, not a demonstrated observational deliverable. The improvement from RMSEmedian ≈ 2.2–2.7 Gyr to RMSEtwo ≈ 0.8–1.5 Gyr therefore depends entirely on an untested classification step. To make the claim credible, the authors should either (a) demonstrate a practical classification using the galaxy properties they mention (color, star formation rate, gas fraction) and recompute the realized RMSE, or (b) explicitly and consistently label the two-estimate numbers as an idealized upper bound on achievable accuracy.
- [Abstract and Sec. 5.3, 6] The statement that 'orbital overlap fundamentally limits the accuracy of infall time estimation' is established only for estimators built from R2D and Vlos. The paper itself suggests that additional physical properties of galaxies may help partially mitigate the degeneracy (Sec. 5.2; last paragraph of Sec. 5.3), yet those properties are never tested. The R–V diagram is a projection of a higher-dimensional space; a lower bound derived from it does not imply a fundamental limit on the full observable set. The 'fundamental' language in the abstract and conclusions should be softened to something like 'currently limits the accuracy of R–V-based estimators,' or the authors should attempt a concrete test of whether adding, e.g., color or star formation rate reduces the dispersion below 2.53 Gyr.
- [Sec. 4.1, Figs. 4–5] The linear partition slope k is optimized on the full TNG sample by maximizing the Spearman correlation between tfall and dlinear on that same sample, and the RMSE for the linear partition is then evaluated on the same data. This in-sample fit gives the linear partition a potential advantage over methods whose boundaries were fixed externally (R17, P19) and over the projected-radius and caustic methods that do not use fitted parameters. Although the reported accuracy differences are small (~0.1 Gyr), the 'slightly outperforms' conclusion should be verified out-of-sample, for example by dividing the cluster sample into training and test sets or by using a nested cross-validation to select the slope.
minor comments (5)
- [Sec. 4.2, Fig. 6] The paragraph beginning 'Additionally, the fractions of galaxies covered by each method...' is repeated almost verbatim in the text after Fig. 6; one of the two copies should be removed.
- [Sec. 2.4, Eq. (2)] The definition Vlos = |vi + H0 × ri| uses an absolute value, so the resulting R–V diagram is folded. The text later says 'we use only the absolute value |V|', but it would be clearer to state the folding convention directly at Eq. (2), since the absolute value is not the standard definition of a line-of-sight velocity.
- [Sec. 5.1, Eq. (7)] The virial mass Mvir = 3R200 σ_los^2 / G assumes a particular form of the virial theorem and a spherical mass distribution; a brief justification of why Mvir/M200 is a suitable dynamical-state indicator would be helpful, especially since the paper finds only a weak dependence on it.
- [Sec. 5.2] The text notes that a two-component GMM does not capture all multimodality (e.g., 'at least three peaks are visible in Zone 5'). A short statement about sensitivity to the number of components and to the GMM initialization would make the two-estimate table more reproducible.
- [Sec. 5.5, Fig. 12] The interloper analysis is well placed and appropriately warns about zones 7–8, but the paper does not quantify how interloper contamination affects the RMSE of the other methods, which use different zone boundaries. A sentence acknowledging that the interloper impact is likely zone-dependent would be useful.
Circularity Check
Two-estimate accuracy gain is an in-sample oracle bound; the core 2.5-Gyr limit measurement is self-contained and non-circular.
-
fitted input called prediction
[Section 5.2, Table 1 (and abstract conclusion)]
"Assuming that we can reliably divide galaxies into earlier-infall and later-infall populations, we calculate the dispersions when using two estimates. For each galaxy, we compare its two errors relative to both estimates and use the smaller one to calculate RMSE, which is listed as RMSEtwo in Table 1."
The two GMM peaks t1 and t2 are fitted to the same tfall distributions that are then used to evaluate accuracy, and RMSEtwo is defined as the smaller of the two per-galaxy errors. This by construction guarantees a reduction relative to any single estimate and is not an achievable observational accuracy, because an observer does not know the true infall time and cannot choose the closer peak. The paper's only proposed observable discriminator (color, SFR, gas fraction) is explicitly untested, as Sec. 5.2 admits that 'further studies are needed to confirm its effectiveness.' Thus the abstract claim that 'employing two estimates of infall times instead of one reduces the dispersion to ≲1.5 Gyr' is an in-sample/oracle bound rather than a validated estimator.
-
fitted input called prediction
[Section 4.1, Figs. 4-5, Table 1]
"To determine the optimal slope, we test a range of slopes and use the Spearman rank correlation coefficient ρ ... to examine the monotonic correlation between tfall and dlinear. ... we adopt the slopes derived from the full galaxy sample, k3D =−1.8 and k2D =−3.7, for calculating dlinear in the rest of this paper."
The slope k defining dlinear is selected by maximizing the Spearman correlation with true infall time on the full TNG galaxy sample, and the same sample is then used to compute the RMSE values (Fig. 5, Table 1) that support the statement that the linear partition 'slightly outperforms' the other methods. This is an in-sample optimization: the reported ρ = -0.53 and RMSE = 2.56 Gyr are fitting statistics, not independent out-of-sample accuracy. The small ~0.1 Gyr margin over P19 is therefore partly produced by the fitting procedure itself and would require cross-validation before being treated as a predictive advantage. This does not invalidate the robust ~2.5-2.6 Gyr intrinsic-dispersion finding, but it does affect the method-ranking claim.
full rationale
The central limiting result — that all R-V-diagram methods reach RMSE ≳ 2.6 Gyr and that the pixel-median intrinsic dispersion is 2.53 Gyr — is not circular: it is measured directly from TNG300-1 true infall times against pixel medians, and it is robust across the five methods compared. The orbital-overlap explanation is an independent simulation diagnosis. However, the paper's proposed improvement in Sec. 5.2 is partially circular. The two Gaussian components are fitted to the same tfall distributions used for evaluation, and RMSEtwo selects, for each galaxy, the closer of the two fitted peaks using the true infall time. That is an oracle/min-of-two in-sample quantity, not a demonstrated observational estimator; the paper concedes that the observable population assignment is untested. The linear-partition slope is also optimized and evaluated on the same sample, making its small method-ranking advantage partly in-sample. These two issues do not undermine the measured 2.5-2.6 Gyr limit, but they mean the '≲1.5 Gyr improvement' claim is a by-construction reduction rather than an independently validated observational accuracy.
Assumptions & free parameters
free parameters (4)
- Linear partition slope k_2D =
-3.7
- Linear partition slope k_3D =
-1.8
- GMM peak locations t1, t2 per zone =
Table 1, e.g., zone 1: 7.37 / 11.18 Gyr
- GMM weights f1:f2 per zone =
e.g., zone 1: 0.47:0.53
assumptions (5)
- domain assumption TNG300-1 simulation faithfully represents galaxy infall into clusters
- domain assumption Central galaxy tracks the cluster center and velocity
- ad hoc to paper Observers can reliably separate earlier- and later-infall populations using galaxy properties
- domain assumption The R-V diagram is symmetric so folding to |V| is sufficient
- domain assumption Mvir/M200 indicates dynamical state
Cite this review
Pith. "Pith review of Estimating infall times of galaxies around clusters: how accurately can it be done with observational data?." pith.science (2026). https://pith.science/paper/4URW4763
@misc{pith2026250517775,
  author       = {Pith},
  title        = {Pith review of: Estimating infall times of galaxies around clusters: how accurately can it be done with observational data?},
  year         = {2026},
  howpublished = {\url{https://pith.science/paper/4URW4763}},
  note         = {Machine review of arXiv:2505.17775}
}
abstract
Context. The environment plays a crucial role in galaxy evolution, particularly for galaxies infalling into clusters. Accurately estimating the infall times of galaxies from observations can significantly enhance our understanding of the environmental effects on galaxy evolution. Aims. This paper aims to evaluate existing methods for estimating infall times via the $R-V$ diagram, explore possible strategies to improve accuracy in estimating infall times, and discuss fundamental limitations. Methods. We utilize a TNG300-1 simulation and construct the $R-V$ diagram that is directly comparable to the observations. Using the same dataset, we systematically compare four commonly used methods, including the projected radii, caustic profiles, and two discrete methods. A simple linear partition is also considered as a reference. Results. Each method exhibits distinct characteristics. While the linear partition slightly outperforms other methods, all methods suffer from limited accuracy ($\gtrsim 2.6$ Gyr), constrained by the intrinsic dispersion ($2.53$ Gyr) of infall times in the $R-V$ diagram. Given this limit, we explore two potential approaches that can improve accuracy: (1) the infall time dispersion is smaller in more dynamically relaxed clusters, and (2) employing two estimates of infall times instead of one reduces the dispersion to $\lesssim1.5$ Gyr. We further demonstrate that the intrinsic dispersion primarily arises from orbital overlap: galaxies in different orbital phases overlap with each other in the $R-V$ diagram and thus appear indistinguishable. Conclusions. Orbital overlap fundamentally limits the accuracy of infall time estimation. The linear partition approach could be a simple and robust estimation.
Figures


Figures from the paper (9 more)




Reference graph
Works this paper leans on
-
[1]
Alpaslan , M., Driver , S., Robotham , A. S. G., et al. 2015, , 451, 3249
2015
-
[2]
M., Sip o cz , B
Astropy Collaboration , Price-Whelan , A. M., Sip o cz , B. M., et al. 2018, , 156, 123
2018
-
[3]
Barrett , P., Hunter , J., Miller , J. T., Hsu , J. C., & Greenfield , P. 2005, in Astronomical Society of the Pacific Conference Series, Vol. 347, Astronomical Data Analysis Software and Systems XIV, ed. P. Shopbell , M. Britton , & R. Ebert , 91
work page 2005
-
[4]
Brambila, D., Lopes, P. A. A., Ribeiro, A. L. B., & Cortesi, A. 2023, Monthly Notices of the Royal Astronomical Society, 523, 785–801
work page 2023
- [5]
-
[6]
S., & White , S
Davis , M., Efstathiou , G., Frenk , C. S., & White , S. D. M. 1985, , 292, 371
1985
-
[7]
2016, arXiv e-prints, arXiv:1611.00036
DESI Collaboration , Aghamousa , A., Aguilar , J., et al. 2016, arXiv e-prints, arXiv:1611.00036
arXiv 2016
-
[8]
Measuring the mass profile of galaxy clusters beyond their virial radius
Diaferio , A. 2009, arXiv e-prints, arXiv:0901.0868
work page Pith review arXiv 2009
Show all 59 references
-
[9]
& Geller , M
Diaferio , A. & Geller , M. J. 1997, , 481, 633
1997
-
[10]
2023, , 672, A84
Ding , Y., Zhu , L., van de Ven , G., et al. 2023, , 672, A84
2023
-
[11]
2009, , 399, 497
Dolag , K., Borgani , S., Murante , G., & Springel , V. 2009, , 399, 497
2009
-
[12]
1980, , 236, 351
Dressler , A. 1980, , 236, 351
1980
-
[13]
J., et al
Dressler , A., Oemler , Augustus, J., Couch , W. J., et al. 1997, , 490, 577
1997
-
[14]
& Shectman , S
Dressler , A. & Shectman , S. A. 1988, , 95, 985
1988
-
[15]
2025, , 697, A1
Euclid Collaboration , Mellier , Y., Abdurro'uf , et al. 2025, , 697, A1
2025
-
[16]
Gommers, R., Virtanen, P., Haberland, M., & and, E. B. 2024, scipy/scipy: SciPy 1.13.0
2024
-
[17]
2003, , 346, 601
Goto , T., Yamauchi , C., Fujita , Y., et al. 2003, , 346, 601
2003
-
[18]
P., Pereira , M
Haines , C. P., Pereira , M. J., Sanderson , A. J. R., et al. 2012, , 754, 97
2012
-
[19]
P., Pereira , M
Haines , C. P., Pereira , M. J., Smith , G. P., et al. 2015, , 806, 101
2015
-
[20]
Kauffmann , G., White , S. D. M., Heckman , T. M., et al. 2004, , 353, 713
2004
-
[21]
J., Bayliss , M
Kim , K. J., Bayliss , M. B., Noble , A. G., et al. 2023, , 955, 32
2023
-
[22]
2011, arXiv e-prints, arXiv:1110.3193
Laureijs , R., Amiaux , J., Arduini , S., et al. 2011, arXiv e-prints, arXiv:1110.3193
2011 arXiv
-
[23]
2013, arXiv e-prints, arXiv:1308.0847
Levi , M., Bebek , C., Beers , T., et al. 2013, arXiv e-prints, arXiv:1308.0847
2013 arXiv
-
[24]
Lopes, P. A. A., Ribeiro, A. L. B., & Brambila, D. 2023, Monthly Notices of the Royal Astronomical Society: Letters, 527, L19–L25
2023
-
[25]
A., & Raychaudhury , S
Mahajan , S., Mamon , G. A., & Raychaudhury , S. 2011, , 416, 2882
2011
-
[26]
L., Haines , C
Maier , C., Ziegler , B. L., Haines , C. P., & Smith , G. P. 2019, , 621, A131
2019
-
[27]
2018, , 480, 5113
Marinacci , F., Vogelsberger , M., Pakmor , R., et al. 2018, , 480, 5113
2018
-
[28]
P., Pillepich , A., Springel , V., et al
Naiman , J. P., Pillepich , A., Springel , V., et al. 2018, , 477, 1206
2018
-
[29]
2018, , 475, 624
Nelson , D., Pillepich , A., Springel , V., et al. 2018, , 475, 624
2018
-
[30]
G., Webb , T
Noble , A. G., Webb , T. M. A., Muzzin , A., et al. 2013, , 768, 118
2013
-
[31]
G., Webb , T
Noble , A. G., Webb , T. M. A., Yee , H. K. C., et al. 2016, , 816, 48
2016
-
[32]
Oman , K. A. & Hudson , M. J. 2016, , 463, 3083
2016
-
[33]
A., Hudson , M
Oman , K. A., Hudson , M. J., & Behroozi , P. S. 2013, , 431, 2307
2013
-
[34]
C., de Carvalho, R
Oxland, M., Parker, L. C., de Carvalho, R. R., & Sampaio, V. M. 2024, Satellite quenching and morphological transformation of galaxies in groups and clusters
2024
-
[35]
2019, Monthly Notices of the Royal Astronomical Society, 484, 1702, aDS Bibcode: 2019MNRAS.484.1702P
Pasquali, A., Smith, R., Gallazzi, A., et al. 2019, Monthly Notices of the Royal Astronomical Society, 484, 1702, aDS Bibcode: 2019MNRAS.484.1702P
2019
-
[36]
2011, Journal of Machine Learning Research, 12, 2825
Pedregosa, F., Varoquaux, G., Gramfort, A., et al. 2011, Journal of Machine Learning Research, 12, 2825
2011
-
[37]
2018, , 475, 648
Pillepich , A., Nelson , D., Hernquist , L., et al. 2018, , 475, 648
2018
-
[38]
2023, Research in Astronomy and Astrophysics, 23, 085007
Qu , C.-G., Yu , H., Diaferio , A., Sohn , J., & Liu , D. 2023, Research in Astronomy and Astrophysics, 23, 085007
2023
-
[39]
& Geller , M
Regos , E. & Geller , M. J. 1989, , 98, 755
1989
-
[40]
H., Basu , K., Ettori , S., et al
Reiprich , T. H., Basu , K., Ettori , S., et al. 2013, , 177, 195
2013
-
[41]
2020, , 247, 45
Rhee , J., Smith , R., Choi , H., et al. 2020, , 247, 45
2020
-
[42]
2017, The Astrophysical Journal, 843, 128, aDS Bibcode: 2017ApJ...843..128R
Rhee, J., Smith, R., Choi, H., et al. 2017, The Astrophysical Journal, 843, 128, aDS Bibcode: 2017ApJ...843..128R
2017
-
[43]
2015, , 449, 49
Rodriguez-Gomez , V., Genel , S., Vogelsberger , M., et al. 2015, , 449, 49
2015
-
[44]
M., de Carvalho, R
Sampaio, V. M., de Carvalho, R. R., Aragón-Salamanca, A., et al. 2024, Monthly Notices of the Royal Astronomical Society, 532, 982–994
2024
-
[45]
M., de Carvalho, R
Sampaio, V. M., de Carvalho, R. R., Ferreras, I., et al. 2021, Monthly Notices of the Royal Astronomical Society, 503, 3065–3080
2021
-
[46]
L., Diaferio , A., Murante , G., & Borgani , S
Serra , A. L., Diaferio , A., Murante , G., & Borgani , S. 2011, , 412, 800
2011
-
[47]
2024, , 961, 39
Shi , K., Malavasi , N., Toshikawa , J., & Zheng , X. 2024, , 961, 39
2024
-
[48]
1904, The American Journal of Psychology, 15, 72
Spearman, C. 1904, The American Journal of Psychology, 15, 72
1904
-
[49]
2018, , 475, 676
Springel , V., Pakmor , R., Pillepich , A., et al. 2018, , 475, 676
2018
-
[50]
Springel , V., White , S. D. M., Jenkins , A., et al. 2005, , 435, 629
2005
-
[51]
Springel , V., White , S. D. M., Tormen , G., & Kauffmann , G. 2001, , 328, 726
2001
-
[52]
S., Hudson , M
Taranu , D. S., Hudson , M. J., Balogh , M. L., et al. 2014, , 440, 1934
2014
-
[53]
2023, , 522, 2297
Taylor , E., Almaini , O., Merrifield , M., et al. 2023, , 522, 2297
2023
-
[54]
2025, arXiv e-prints, arXiv:2505.02891
Vall \'e s-P \'e rez , D., Planelles , S., & Quilis , V. 2025, arXiv e-prints, arXiv:2505.02891
2025 arXiv
-
[55]
C., & Varoquaux , G
van der Walt , S., Colbert , S. C., & Varoquaux , G. 2011, Computing in Science and Engineering, 13, 22
2011
-
[56]
Wen , Z. L. & Han , J. L. 2013, , 436, 275
2013
-
[57]
2010, in P roceedings of the 9th P ython in S cience C onference, ed
W es M c K inney. 2010, in P roceedings of the 9th P ython in S cience C onference, ed. S t\'efan van der W alt & J arrod M illman, 56 -- 61
2010
-
[58]
L., Diaferio , A., & Baldi , M
Yu , H., Serra , A. L., Diaferio , A., & Baldi , M. 2015, , 810, 37
2015
-
[59]
P., et al
Zheng , Y., Xu , K., Jing , Y. P., et al. 2024, , 969, 129
2024
Reviewed August 7, 2026 · model on record in the stance chip above.
Discussion (0). Continue with ORCID to comment.