REVIEW 4 major objections 4 minor 58 references
Two-Point Statistics of Coherent Structure in Turbulent Flow
T0 review · 4 major / 4 minor · reviewed 2026-08-14 · deepseek-v4-flash
Pith's one-line read Velocity-vorticity correlation structures give a robust, efficient route from two-point data to the geometry of coherent turbulent motions.
desk verdict A serviceable but flawed review of two-point correlation techniques; the VVCS section needs a threshold-sensitivity analysis and some factual corrections before it is publishable. read the letter →
The pith
A machine-rendered reading of the paper's core claim, the machinery that carries it, and where it could break.
The reading
What carries the argument
The central object is the velocity-vorticity correlation structure (VVCS), defined as the high-correlation regions $R_{ij}(\mathbf{x}_r; x, y, z) \ge R_0$ with $0 \le R_0 \le 1$ of the two-point cross-correlation coefficient between a velocity component $u_i$ at a reference location and a vorticity component $\omega_j$ at another location. It carries the argument by turning the correlation tensor into three-dimensional iso-surfaces whose shape, topology, spacing, and inclination angle become the measured geometry of the averaged coherent motion. The underlying mechanism is that the correlation between a reference-point velocity fluctuation and surrounding vorticity connects what happens at one location to the structures around it, so near-wall fluctuations are traced to the vortices above them.
What would settle it
Compare VVCS-extracted spanwise spacing, streamwise length, and inclination angle against instantaneous structure detection in the same DNS snapshots; if the VVCS values do not match the conditional average of actual vortex cores, or if they change sharply with the threshold $R_0$, the central robustness claim fails.
Extended reading notes
Core claim
The core discovery asserted here is that high-correlation regions of the two-point velocity-vorticity correlation tensor—called VVCS—reproduce the principal geometric features of near-wall coherent structures in turbulent wall-bounded flow. In the author's account, VVCS appears as an inclined quadruple structure near the wall, with topology that changes with reference-wall distance, and its sub-structures, the near-wall correlation structure and the accompanying streamwise correlation structure, carry the spanwise spacing and streamwise length of quasi-streamwise vortices and low-speed streaks. The paper states in Section 3.4 that 'The VVCS analysis is a robust and efficient method for quantifying coherent motions in turbulent shear flows, and particularly suitable for extracting statistical geometrical measures using two-point simultaneous data.' Across applications, VVCS is used to locate lift-up regions in DNS and optimal perturbations, to quantify how riblets shift vortex cores, and in a five-method comparison it was the only technique that directly delivered geometry throughout an open-channel flow.
Load-bearing premise
The method's usefulness depends on thresholded correlation regions representing real, recurring flow structures rather than mathematical averages that no instantaneous snapshot contains, a concern the paper itself acknowledges.
Editorial extensions
If this is right
- Two-point simultaneous measurements from hot-wire, PIV, or LDA arrays can directly yield the spacing, length, and inclination of near-wall coherent structures without subjective visualization-based detection.
- VVCS supplies a common metric for comparing coherent-structure geometry across smooth walls, riblet surfaces, compressible channels, and open-channel flows, so drag-reduction and compressibility effects reduce to measurable shifts in correlation-structure scales.
- Models of wall turbulence can use VVCS-derived spacings and lengths as input parameters, replacing ad hoc eddy shapes with statistical footprints tied to measured data.
- The limiting VVCS at the wall provides reference scales that collapse mean velocity and fluctuation profiles across Mach numbers, extending the semi-local transformation picture for compressible wall turbulence.
- Applications to optimal perturbations and DNS suggest VVCS can track the lift-up and bursting dynamics connecting near-wall and outer regions.
Reading between the lines
- Not tested in the paper: systematically varying $R_0$ and checking whether VVCS geometry tracks instantaneous vortex-core statistics would sharpen or qualify the 'robust' claim.
- A synthetic-field experiment the paper does not run: generate random arrangements of counter-rotating vortex pairs with the measured VVCS spacings and ask how much of the correlation tensor is explained by linear superposition of independent vortices; the leftover would measure genuine nonlinear organization.
- If VVCS regions are statistical footprints, they should predict conditional averages of instantaneous events; a conditional-average test conditioned on VVCS membership would settle whether low-speed streaks are generated by the inferred vortex-pair picture.
Signed reviews
Editorial analysis
A structured set of objections, weighed in public.
Referee Report
Summary. This manuscript is presented as a review of two-point correlation techniques for identifying and quantifying coherent structures in turbulent shear flows. It surveys Eulerian and Lagrangian space-time correlations, two-point spatial correlations, and cross-correlations, and then devotes the second half to the velocity-vorticity correlation structure (VVCS), covering its definition, topology, spatial relation to a reference point, physical interpretation, and applications to compressible channel flow, open-channel flow, and riblet-mounted surfaces. The paper concludes with remarks on the state of the field and future directions.
Significance. If its central claims were established, the paper would be a useful compact guide to two-point statistical methods and would promote VVCS as a practical tool for extracting geometric properties of coherent motions from experimental and numerical data. The survey does bring together a broad set of references, and the inclusion of independent applications by other groups (Farano et al., Bai et al., and Li & Liu) partially mitigates the otherwise heavy reliance on the author's own prior work. However, the central assertion that VVCS is robust and efficient is not supported by the evidence presented, because the method depends on an arbitrarily chosen correlation threshold and no sensitivity analysis is given. The manuscript also contains factual and notational errors in the review sections, which further reduce its reliability as a survey.
major comments (4)
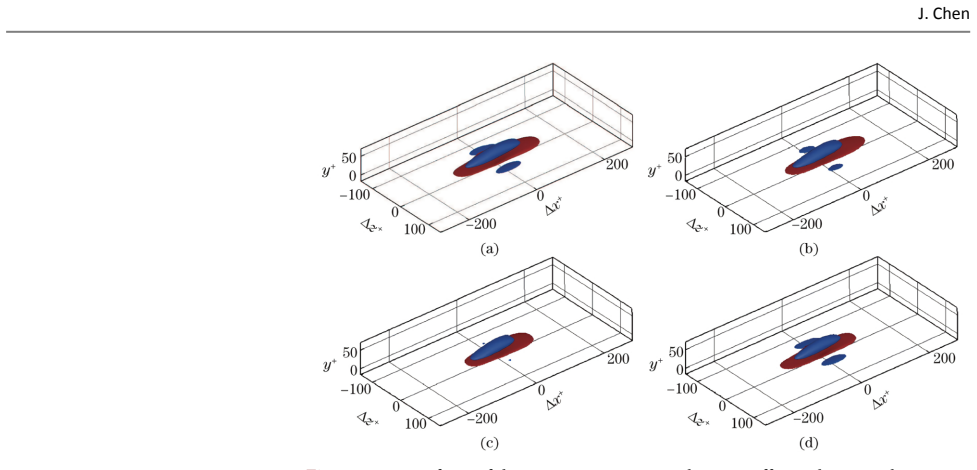
- [Section 3.1, Figure 3] The definition of VVCS as the set of points where R_ij >= R0, with 0 <= R0 <= 1, leaves the threshold R0 free, yet Figure 3 uses R11 = 0.07 without justification or sensitivity analysis. Since all the geometric quantities reported later, including spanwise spacing, streamwise length, inclination angle, and the quadruple-to-dipole topological transition, are read off thresholded iso-surfaces, the claim in Section 3.4 that VVCS is a robust method is unsupported. This is also in tension with Section 3.1, where the paper criticizes other methods for being 'easily influenced by the subjectiveness while determining the threshold value.' A sensitivity study varying R0 over a plausible range, with the resulting changes in D_z^+(y^+) and in the topology reported, is needed before the central claim can stand.
- [Section 3.4] The paper explicitly concedes that 'the statistical structure may not exist in the instantaneous field, so the scenario of low-speed streak generation directly interpreted by statistical structures is not rigorous,' yet it then asserts that VVCS accurately captures the geometrical features of near-wall coherent structures (Section 3.1) and uses those geometries to interpret riblet drag mechanisms (Section 3.5). The gap between thresholded correlation geometry and instantaneous coherent motions is acknowledged but not resolved. Without independent validation, such as conditional averaging or comparison with instantaneous structure detection, the physical interpretations built on VVCS geometry remain speculative rather than established.
- [Section 2.2] Afzal (1983) is described as having 'conducted DNS of the boundary layer subjected to strong adverse pressure gradient,' but reference [27] is an analytical study, not a direct numerical simulation. This factual error should be corrected. In the same section, z is used as a wall-normal coordinate in the caption and text ('at 0.5z δ') while the nomenclature and Equation (1) define z as the spanwise coordinate and y as the wall-normal coordinate. This inconsistency makes the description of Ganapathisubramani et al. (2005) difficult to follow and should be fixed throughout.
- [Section 3.5] The quantitative statement that the linear function of D_z^+(y^+) has a slope of 0.39 in comparison with 0.31 in compressible turbulent channel flow [16] is not reproducible as written: the fitted quantity, the fit range, the uncertainty, and the underlying data are not defined. This matters because the slope comparison is used to draw a physical conclusion about riblets and spanwise motion. The authors should either provide the full fitting details and uncertainty estimates or clearly attribute the numbers to the cited reference without presenting them as a new quantitative result.
minor comments (4)
- [Figure 3 caption] The caption contains an incomplete sentence fragment ('Δ 200 x+ =') and an apparent sign error: the red surface is described as defined by the positive threshold 'R11 = -0.07', while the text and context indicate R11 = 0.07.
- [General formatting] The manuscript still contains publication placeholders (Received/Accepted/Published dates, DOI, page numbers), and several equations and references have layout artifacts from the conversion process; these should be cleaned before any resubmission.
- [References] Reference [35] is cited as 'Klewicki, Falco, and Foss (1990)' in the text but the reference list entry instead begins 'Klewicki, J.C., Gendrich, C.P., Foss, J.F. and Falco, R.E.'; the author names should be made consistent.
- [Section 3.1] The sentence 'While velocity fluctuation u_i at a reference location r y' is grammatically incomplete; it should be rephrased to clearly state that the reference point is fixed and the correlation field is evaluated as a function of the separation vector.
Circularity Check
No significant circularity: the review's VVCS claims are definitional in geometry but empirically validated by DNS and independently supported by other groups.
full rationale
This paper is a review rather than a new derivation, and its central claim about VVCS does not reduce to its own inputs. In Section 3.1, VVCS is explicitly defined as the thresholded regions of the two-point cross-correlation coefficient, R_ij >= R_0, so the reported geometrical measures (spanwise spacing, streamwise length, inclination angle, topology) are indeed read off the iso-surfaces by construction. However, the paper does not present this as a prediction from first principles; it presents VVCS as a data-analysis method whose usefulness is asserted from prior DNS studies and from independent applications by other groups (refs 53, 54, 55). The author's own prior publications (refs 16, 45, 46, 48) are cited to introduce and motivate the method, but the load-bearing validation is not exclusively self-referential: Farano et al., Bai et al., and Li and Liu independently applied VVCS and obtained consistent structural information. The paper also explicitly concedes in Section 3.4 that the statistical structure 'may not exist in the instantaneous field,' which weakens the physical interpretation but is a limitation statement, not a circular step. No fitted parameter is renamed as a prediction, no uniqueness theorem is imported from the authors' prior work, and no ansatz is smuggled in via citation. The threshold dependence of VVCS is a robustness concern, not a circularity concern. Therefore the derivation chain is self-contained and the appropriate finding is no significant circularity.
Assumptions & free parameters
assumptions (4)
- domain assumption Ensemble averages and two-point correlations are meaningful statistical descriptors of turbulent flows.
- ad hoc to paper The threshold R0 (0<=R0<=1) defining VVCS regions is a valid discriminative criterion.
- domain assumption The cited DNS and experimental datasets are accurately represented.
- domain assumption Coherent structures exist and dominate turbulent transport.
Cite this review
Pith. "Pith review of Two-Point Statistics of Coherent Structure in Turbulent Flow." pith.science (2026). https://pith.science/paper/55S4JM3Q
@misc{pith2026190805422,
  author       = {Pith},
  title        = {Pith review of: Two-Point Statistics of Coherent Structure in Turbulent Flow},
  year         = {2026},
  howpublished = {\url{https://pith.science/paper/55S4JM3Q}},
  note         = {Machine review of arXiv:1908.05422}
}
read the original abstract
This review summarizes the coherent structures (CS) based on two-point correlations and their applications, with a focus on the interpretation of statistic CS and their characteristics. We review studies on this topic, which have attracted attention in recent years, highlighting improvements, expansions, and promising future directions for two-point statistics of CS in turbulent flow. The CS is one of typical structures of turbulent flow, transporting energy from large-scale to small-scale structures. To investigate the CS in turbulent flow, a large amount of two-point correlation techniques for CS identification and visualization have been, and are currently being, intensively studied by researchers. Two-point correlations with examples and comparisons between different methods are briefly reviewed at first. Some of the uses of correlations in both Eulerian and Lagrangian frames of reference to obtain their properties at consecutive spatial locations and time events are surveyed. Two-point correlations, involving space-time correlations, two-point spatial correlations, and cross correlations, as essential to theories and models of turbulence and for the analyses of experimental and numerical turbulence data are then discussed. The velocity-vorticity correlation structure (VVCS) as one of the statistical CS based on two-point correlations is reiterated in detail. Finally, we summarize the current understanding of two-point correlations of turbulence and conclude with future issues for this field.
Figures


Figures from the paper (2 more)


Reference graph
Works this paper leans on
-
[27]
(1983) Analysis of a Turbulent Boundary Layer Subjected to a Strong A d- verse Pressure Gradient
Afzal, N. (1983) Analysis of a Turbulent Boundary Layer Subjected to a Strong A d- verse Pressure Gradient. International Journal of Engineering Science, 21, 563-576. https://doi.org/10.1016/0020-7225(83)90104-0
-
[16]
Chen, J., Hussain, F., Pei, J. and She , Z.-S. (2014) Velocity -Vorticity Correlation Structure in Turbulent Channel Flow. Journal of Fluid Mechanics, 742, 291-307. https://doi.org/10.1017/jfm.2014.3
-
[1]
(1952) Mechanism of Turbulence
Theodorsen, T. (1952) Mechanism of Turbulence. In: Proceedings of the 2nd Mid- western Conference on Fluid Mechanics, 1-19
work page 1952
-
[2]
(1956) The Structure of Turbulent Shear Flow
Townsend, A.A. (1956) The Structure of Turbulent Shear Flow . 2nd Edition, Cam- bridge University Press, Cambridge
work page 1956
-
[3]
(1981) Organized Motion in Turbulent Flow
Cantwell, B.J. (1981) Organized Motion in Turbulent Flow. Annual Review of Fluid Mechanics, 13, 457-515. https://doi.org/10.1146/annurev.fl.13.010181.002325
-
[4]
Fujisawa, N. and Gotoh, F. (1992) Visualization Study of the Flow in and around a Savonius Rotor. Experiments in Fluids, 12, 407-412. https://doi.org/10.1007/BF00193888
-
[5]
Iio, S., Takahashi, K., Haneda, Y. and Ikeda, T. (2008) Flow Visualization of Vortex Structure in a Pulsed Rectangular Jet. Journal of Visualization, 11, 125-132. https://doi.org/10.1007/BF03181927
-
[6]
Budiman, A.C., Mitsudharmadi, H., Bouremel, Y., Winoto, S.H. and Low , H.T. (2015) Visualization of Pre-Set Vortices in Boundary Layer Flow over Wavy Surface in Rectangular Channel. Journal of Visualization, 18, 669-677. https://doi.org/10.1007/s12650-014-0252-z
Show all 58 references
-
[7]
and Hargather , M.J
Settles, G.S. and Hargather , M.J. (2017) A Review of Recent Developments in Schlieren and Shadowgraph Techniques. Measurement Science and Technology, 28, Article ID: 042001. https://doi.org/10.1088/1361-6501/aa5748
2017 doi
-
[8]
and Runstadler , P.W
Kline, S.J., Reynolds, W.C., Schraub, F.A. and Runstadler , P.W. (1967) The Struc- ture of Turbulent Boundary Layers. Journal of Fluid Mechanics, 30, 741-773. https://doi.org/10.1017/S0022112067001740
1967 doi
-
[9]
and Funatani , S
Fujisawa, N. and Funatani , S. (2000) Simultaneous Measurement of Temperature and Velocity in a Turbulent Thermal Convection by the Extended Range Scanning Liquid Crystal Visualization Technique. Experiments in Fluids, 29, S158-S165. https://doi.org/10.1007/s003480070017
2000 doi
-
[10]
and She, Z.-S
Chen, J., Shi, X.-T., Wang, T.-J. and She, Z.-S. (2013) Wavy Structures in Compres- sible Mixing Layers. Acta Mechanica Sinica, 29, 633-640. https://doi.org/10.1007/s10409-013-0076-4
2013 doi
-
[11]
and Uchiyama , T
Iio, S., Hirashita, K., Katayama, Y., Haneda, Y., Ikeda, T. and Uchiyama , T. (2013) Jet Flapping Control with Acoustic Excitation. Journal of Flow Control , Measure- ment & Visualization, 1, 49-56. https://doi.org/10.4236/jfcmv.2013.12007
2013
-
[12]
(1986) Coherent Structures and Turbulence
Hussain, A.K.M.F. (1986) Coherent Structures and Turbulence. Journal of Fluid Mechanics, 173, 303-356. https://doi.org/10.1017/S0022112086001192
1986 doi
-
[13]
and Moin , P
Adrian, R.J. and Moin , P. (1988) Stochastic Estimation of Organized Turbulent Structure: Homogeneous Shear Flow. Journal of Fluid Mechanics, 190, 531-559. https://doi.org/10.1017/S0022112088001442
1988 doi
-
[14]
and George , W.K
Glauser, M.N. and George , W.K. (1992) Application of Multipoint Measurements for Flow Characterization. Experimental Thermal and Fluid Science, 5, 617-632. https://doi.org/10.1016/0894-1777(92)90018-Z
1992 doi
-
[15]
and Jimenez , J
Sillero, J.A. and Jimenez , J. (2014) Two-Point Correlations in Turbulent Boundary Layers and Channels up to δ + = 2000. Proceedings of 19th Australasian Fluid M e- chanics Conference, 9, 8-11
2014
-
[17]
and Zaki , T.A
Hwang, J., Lee, J., Sung, H.J. and Zaki , T.A. (2016) Inner -Outer Interactions of J. Chen DOI: 10.4236/***.2019.***** 18 Journal of Flow Control, Measurement & Visualization Large-Scale Structures in Turbulent Channel Flow. Journal of Fluid Mechanics, 790, 128-157. https://do...
2016 doi
-
[18]
and Proudman , I
Batchelor, G.K. and Proudman , I. (1954) The Effect of Rapid Distortion of a Fluid in Turbulent Motion. The Quarterly Journal of Mechanics and Applied Mathemat- ics, 7, 83-103. https://doi.org/10.1093/qjmam/7.1.83
1954 doi
-
[19]
and Yang, Y
He, G., Jin, G. and Yang, Y. (2016) Space-Time Correlations and Dynamic Coupling in Turbulent Flows. Annual Review of Fluid Mechanics, 49, 51-70. https://doi.org/10.1146/annurev-fluid-010816-060309
2016 doi
-
[20]
and Zhang , J.-B
He, G.-W. and Zhang , J.-B. (2006) Elliptic Model for Space -Time Correlations in Turbulent Shear Flows. Physical Review E, 73, Article ID: 055303. https://doi.org/10.1103/PhysRevE.73.055303
2006 doi
-
[21]
and He, G.-W
Zhao, X. and He, G.-W. (2009) Space-Time Correlations of Fluctuating Velocities in Turbulent Shear Flows. Physical Review E, 79, Article ID: 046316. https://doi.org/10.1103/PhysRevE.79.046316
2009 doi
-
[22]
and Hussain, A.K.M.F
Zaman, K.B.M.Q. and Hussain, A.K.M.F. (1981) Taylor Hypothesis and Large -Scale Coherent Structures. Journal of Fluid Mechanics, 112, 379
1981
-
[23]
and Rimestad, S
Krogstad, P.-Å., Kaspersen, J.H. and Rimestad, S. (1998) Convection Velocities in a Turbulent Boundary Layer. Physics of Fluids, 10, 949-957. https://doi.org/10.1063/1.869617
1998 doi
-
[24]
and She, Z.-S
Cao, Y., Chen, J. and She, Z.-S. (2008) The Nature of Near -Wall Convection Veloc- ity in Turbulent Channel Flow. Acta Mechanica Sinica, 24, 587-590. https://doi.org/10.1007/s10409-008-0182-x
2008 doi
-
[25]
and Hussain , F
Pei, J., Chen, J., She, Z.-S. and Hussain , F. (2012) Model for Propagation Speed in Turbulent Channel Flows. Physical Review E, 86, Article ID: 046307. https://doi.org/10.1103/PhysRevE.86.046307
2012 doi
-
[26]
(2018) Coherent Structures in Wall -Bounded Turbulence
Jiménez, J. (2018) Coherent Structures in Wall -Bounded Turbulence. Journal of Fluid Mechanics, 842, 1. https://doi.org/10.1017/jfm.2018.144
2018 doi
-
[28]
(1946) The Theory of Axisymmetric Turbulence
Batchelor, G.K. (1946) The Theory of Axisymmetric Turbulence. Proceedings of the Royal Society of London. Series A. Mathematical and P hysical Sciences, 186, 480-
1946
-
[29]
(1983) Constraints on the Invariant Functions of Axisymmetric Tur - bulence
Kerschen, E.J. (1983) Constraints on the Invariant Functions of Axisymmetric Tur - bulence. AIAA Journal, 21, 978-985. https://doi.org/10.2514/3.8186
1983 doi
-
[30]
and Kim, J
Zhu, Y., Antonia, R.A. and Kim, J. (1996) Two-Point Velocity and Vorticity Corr e- lations for Axisymmetric Turbulence. Physics of Fluids, 8, 838-840. https://doi.org/10.1063/1.868865
1996 doi
-
[31]
and Hamlington , P.E
Alexander, S.R. and Hamlington , P.E. (2015) Analysis of Turbulent Bending M o- ments in Tidal Current Boundary Layers. Journal of Renewable and Sustainable Energy, 7, Article ID: 063118. https://doi.org/10.1063/1.4936287
2015 doi
-
[32]
and M a- rusic, I
Ganapathisubramani, B., Hutchins, N., Hambleton, W.T., Longmire, E.K. and M a- rusic, I. (2005) Investigation of Large- Scale Coherence in a Turbulent Boundary Layer Using Two-Point Correlations. Journal of Fluid Mechanics, 524, 57-80. https://doi.org/10.1017/S0022112004002277
2005 doi
-
[33]
(1989) Velocity-Vorticity Correlations Related to the Gradients of the Reynolds Stresses in Parallel Turbulent Wall Flows
Klewicki, J.C. (1989) Velocity-Vorticity Correlations Related to the Gradients of the Reynolds Stresses in Parallel Turbulent Wall Flows. Physics of Fluids A: Fluid D y- namics, 1, 1285-1288. https://doi.org/10.1063/1.857354 J. Chen DOI: 10.4236/***.2019.***** 19 Journal of Fl...
1989 doi
-
[34]
(1987) The Wall Region of a Turbulent Boundary Layer
Phillips, W.R.C. (1987) The Wall Region of a Turbulent Boundary Layer. Physics of Fluids, 30, 2354. https://doi.org/10.1063/1.866125
1987 doi
-
[35]
and Falco , R.E
Klewicki, J.C., Gendrich, C.P., Foss, J.F. and Falco , R.E. (1990) On the Sign of the Instantaneous Spanwise Vorticity Component in the Nea r-Wall Region of Turb u- lent Boundary Layers. Physics of Fluids A: Fluid Dynamics, 2, 1497-1500. https://doi.org/10.1063/1.857599
1990 doi
-
[36]
and Zhang , Z
Wang, L., Huang, W., Xu, C., Shen, L. and Zhang , Z. (2019) Relationship between Wall Shear Stresses and Streamwise Vortices. Applied Mathematics and Mechanics, 40, 381-396. https://doi.org/10.1007/s10483-019-2448-8
2019 doi
-
[37]
and Li, W
Guo, S. and Li, W. (2010) The Effect of Near -Wall Vortices on Wall Shear Stress in Turbulent Boundary Layers. Engineering, 2, 190-196. https://doi.org/10.4236/eng.2010.23027
2010
-
[38]
and He, G
Deng, S., Pan, C., Wang, J. and He, G. (2018) On the Spatial Organization of Hai r- pin Packets in a Turbulent Boundary Layer at Low- to-Moderate Reynolds Number. Journal of Fluid Mechanics, 844, 635-668. https://doi.org/10.1017/jfm.2018.160
2018 doi
-
[39]
and Fujisawa, N
Oguma, Y., Yamagata, T. and Fujisawa, N. (2013) Measurement of Sound Source Distribution around a Circular Cylinder in a Uniform Flow by Combined Particle Image Velocimetry and Microphone Technique. Journal of Wind Engi neering and Industrial Aerodynamics, 118, 1-11. https://d...
2013 doi
-
[40]
(2003) Multiscale Interactions between Surface Shear Stress and V e- locity in Turbulent Boundary Layers
Venugopal, V. (2003) Multiscale Interactions between Surface Shear Stress and V e- locity in Turbulent Boundary Layers. Journal of Geophysical Research, 108, 4613. https://doi.org/10.1029/2002JD003025
2003 doi
-
[41]
(1981) Conditional Sampling in Turbulence Measurement
Antonia, R.A. (1981) Conditional Sampling in Turbulence Measurement. Annual Review of Fluid Mechanics, 13, 131-156. https://doi.org/10.1146/annurev.fl.13.010181.001023
1981
-
[42]
(2010) Dynamic Mode Decomposition of Numerical and Experimental Data
Schmid, P.J. (2010) Dynamic Mode Decomposition of Numerical and Experimental Data. Journal of Fluid Mechanics, 656, 5-28. https://doi.org/10.1017/S0022112010001217
2010 doi
-
[43]
(1993) The Proper Orthogonal Decomposition in the Analysis of Tu r- bulent Flows
Berkooz, G. (1993) The Proper Orthogonal Decomposition in the Analysis of Tu r- bulent Flows. Annual Review of Fluid Mechanics, 25, 539-575. https://doi.org/10.1146/annurev.fl.25.010193.002543
1993
-
[44]
and Brodkey, R.S
Wallace, J.M., Eckelmann, H. and Brodkey, R.S. (1972) The Wall Region in Turbu- lent Shear Flow. Journal of Fluid Mechanics, 54, 39-48. https://doi.org/10.1017/S0022112072000515
1972 doi
-
[45]
and Fu , S
Chen, J., Pei, J., She, Z.S., Hussain, F., Li, J. and Fu , S. (2011) , Velocity-Vorticity Correlation Structure in Turbulent Channel Flow. Recent Progresses in Fluid D y- namics Research : Proceeding of the Sixth International Conference on Fluid M e- chanics, 1376, 87-89
2011
-
[46]
and She , Z
Pei, J., Chen, J., Fazle, H. and She , Z. (2013) New Scaling for Compressible Wall Turbulence. Science China Physics, Mechanics and Astronomy, 56, 1770-1781. https://doi.org/10.1007/s11433-013-5147-9
2013 doi
-
[47]
and Bradshaw , P
Huang, P.G., Coleman, G.N. and Bradshaw , P. (1995) Compressible Turbulent Channel Flows: DNS Results and Modelling. Journal of Fluid Mechanics, 305, 185-
1995
-
[48]
and Fu , S
Pei, J., Chen, J., She, Z.S., Hussain, F., Li, J. and Fu , S. (2011), Mach Number D e- pendence of Near Wall Structure in Compressible Channel Flows. AIP Conference Proceedings, 1376, 146-148. https://doi.org/10.1063/1.3651859
2011 doi
-
[49]
and Moser , R.D
Coleman, G.N., Kim, J. and Moser , R.D. (1995) A Numerical Study of Turbulent J. Chen DOI: 10.4236/***.2019.***** 20 Journal of Flow Control, Measurement & Visualization Supersonic Isothermal -Wall Channel Flow. Journal of Fluid Mechanics , 305, 159-
1995
-
[50]
(2007) Hairpin Vortex Organization in Wall Turbulence
Adrian, R.J. (2007) Hairpin Vortex Organization in Wall Turbulence. Physics of Fluids, 19, Article ID: 041301. https://doi.org/10.1063/1.2717527
2007 doi
-
[51]
and She, Z.-S
Cao, Y.-H., Pei, J., Chen, J. and She, Z.-S. (2008) Compressibility Effects in Turb u- lent Boundary Layers. Chinese Physics Letters, 25, 3315-3318. https://doi.org/10.1088/0256-307X/25/9/059
2008 doi
-
[52]
and De Palma, P
Farano, M., Cherubini, S., Robinet, J.-C. and De Palma, P. (2017) Optimal Bursts in Turbulent Channel Flow. Journal of Fluid Mechanics, 817, 35-60. https://doi.org/10.1017/jfm.2017.107
2017 doi
-
[53]
and Robinet, J.-C
Farano, M., Cherubini, S., De Palma, P. and Robinet, J.-C. (2018) Nonlinear Optim- al Large-Scale Structures in Turbulent Channel Flow. European Journal of Mechan- ics-B/Fluids, 72, 74-86. https://doi.org/10.1016/j.euromechflu.2018.04.016
2018 doi
-
[54]
and Guo, A
Bai, X., Zhang, W., Fang, Q., Wang, Y., Zheng, J. and Guo, A. (2019) The Visualiza- tion of Turbulent Coherent Structure in Open Channel Flow. Journal of Hydrod y- namics, 31, 266-273. https://doi.org/10.1007/s42241-019-0026-0
2019 doi
-
[55]
and Liu, H
Li, W. and Liu, H. (2019) Two-Point Statistics of Coherent Structures in Turbulent Flow over Riblet-Mounted Surfaces. Acta Mechanica Sinica, 35, 457-471. https://doi.org/10.1007/s10409-018-0828-2 J. Chen DOI: 10.4236/***.2019.***** 21 Journal of Flow Control, Measurement & Vis...
2019 doi
-
[183]
https://doi.org/10.1017/S0022112095004587
-
[218]
https://doi.org/10.1017/S0022112095004599
-
[502]
https://doi.org/10.1098/rspa.1946.0060
1946
Reviewed August 14, 2026 · model on record in the stance chip above.
Discussion (0). Continue with ORCID to comment.