REVIEW 4 major objections 5 minor 51 references
Robust Design and Analysis of Clinical Trials With Non-proportional Hazards: A Straw Man Guidance from a Cross-pharma Working Group
T0 review · 4 major / 5 minor · reviewed 2026-08-14 · deepseek-v4-flash
Pith's one-line read This paper proposes the MaxCombo test—the maximum of four Fleming-Harrington weighted log-rank statistics—as a primary analysis for confirmatory trials with non-proportional hazards, with design and sample-size guidance to match.
desk verdict MaxCombo is a genuinely useful straw-man proposal, but as written the test is internally inconsistent: the p-value is an upper-tail maximum while the design boundary is a lower-tail cutoff. read the letter →
The pith
A machine-rendered reading of the paper's core claim, the machinery that carries it, and where it could break.
The reading
What carries the argument
The central object is the MaxCombo statistic $Z_{max} = \max\{G^{0,0}, G^{0,1}, G^{1,1}, G^{1,0}\}$, where each $G^{\rho,\gamma}$ is a Fleming-Harrington weighted log-rank statistic; the weights emphasize early events ($\rho$), late events ($\gamma$), or both. The load-bearing identity is the covariance formula $\eta_{ij} = V(G_{(\rho_i+\rho_j)/2,(\gamma_i+\gamma_j)/2}) / \sqrt{V(G_{\rho_i,\gamma_i}) V(G_{\rho_j,\gamma_j})}$, which turns the joint null distribution of the four statistics into an estimable multivariate normal and lets the design compute an adjusted boundary without per-trial simulation. Around this identity the paper builds an iterative design procedure: simulate one large null trial to estimate the correlation matrix, solve for the per-component significance level, size each of the four tests with a published weighted-log-rank sample-size formula, and confirm the operating characteristics by simulation. For trials with an interim analysis, the same framework uses the independent-increments property to correlate the interim log-rank statistic with the final MaxCombo statistic.
What would settle it
Simulate a null trial with no treatment effect but with a survival or censoring pattern that departs from the assumed piecewise-exponential setup (for example, a cure fraction or heavy late censoring), apply the paper's Appendix D boundary and MaxCombo p-value calculation, and check whether the one-sided rejection rate stays at 2.5%; a material excess would show the calibration depends on the assumed null correlation matrix.
Extended reading notes
Core claim
The paper's central claim is that the MaxCombo test—the maximum of four correlated Fleming-Harrington weighted log-rank statistics $G^{0,0}$, $G^{0,1}$, $G^{1,1}$, and $G^{1,0}$—is suitable as the primary analysis test in a confirmatory trial when non-proportional hazards are a real possibility. Under the null hypothesis the four statistics are asymptotically multivariate normal, so a one-sided p-value can be obtained by integrating a four-dimensional normal density above the observed maximum, and the significance boundary can be adjusted using their correlation matrix rather than a conservative Bonferroni correction. Simulation and three reconstructed trial examples are used to argue that the test controls type I error at 2.5%, has strong power for delayed, crossing, early-separation, and mixed non-proportional-hazard patterns, and loses only modest power relative to the log-rank test under proportional hazards. The paper pairs the test with a three-step analysis strategy (test the null, assess proportional hazards, then report either the hazard ratio or a set of time-dependent summaries) and a simulation-based design procedure for sample size and interim boundaries.
Load-bearing premise
The design treats the correlation matrix of the four test statistics, estimated from one large simulated null trial under assumed piecewise-exponential survival, enrollment, and follow-up, as the true correlation matrix of the actual trial; if the real null survival or censoring pattern differs materially, the significance boundary and final p-value can be miscalibrated.
Editorial extensions
If this is right
- A trial facing uncertain non-proportional hazards can pre-specify MaxCombo as the primary test and still control one-sided type I error at 2.5%.
- In the delayed-effect design example, MaxCombo needs 472 patients and 372 events versus 690 patients and 544 events for the log-rank test, a substantial saving.
- Designs should specify minimum follow-up (roughly twice the control median) alongside event count, because MaxCombo power depends on follow-up, not just events.
- For a trial with an interim log-rank analysis, the final MaxCombo boundary can be adjusted using the independent-increments correlation between the interim statistic and the four final statistics.
- Under proportional hazards with a modest benefit, MaxCombo can lose power relative to the log-rank test, so the paper recommends reserving it for settings where non-proportional hazards are plausible.
Reading between the lines
- One implication not developed in the paper is that the practical bottleneck for MaxCombo will be regulator agreement on the simulation plan and the null correlation matrix in advance, not the test statistic itself.
- A natural extension would be to let the data at the final analysis determine the correlation matrix from the observed event and censoring pattern instead of fixing it at the design stage, and to study how sensitive the reported p-value is to that choice.
- The same maximum-of-correlated-weighted-log-rank construction could be applied to a larger or differently chosen set of weights; everything needed for the p-value would follow from the same covariance identity, and the operating characteristics would need rerunning.
- A testable refinement motivated by the paper's examples is to treat the MaxCombo test as a gatekeeper and then quantify how much the treatment-effect estimate changes across the four component weights, exposing whether the smallest p-value also corresponds to a clinically meaningful effect.
Signed reviews
Editorial analysis
A structured set of objections, weighed in public.
Referee Report
Summary. This paper proposes the MaxCombo test, defined as the maximum of four correlated Fleming-Harrington weighted log-rank statistics (G0,0, G0,1, G1,1, G1,0), as a robust primary analysis for confirmatory clinical trials with potential non-proportional hazards (NPH). It presents an analysis workflow (test of the null, assessment of proportional hazards, and adaptive treatment-effect summaries), a design approach with sample-size calculation based on an adjusted significance boundary and an iterative simulation step, an interim-analysis strategy, and three illustrative applications from published oncology trials. The authors claim that MaxCombo controls type I error at 2.5% and provides robust power across PH, delayed effect, crossing survival, early separation, and mixtures of NPH patterns, and they frame the proposal as a 'straw man' guidance for discussion.
Significance. If the proposal were internally consistent and its operating characteristics were fully supported, the paper would provide valuable, practical guidance for an important methodological need: a pre-specified primary test with robust power under various non-proportional-hazards patterns while controlling type I error at the conventional level. The paper draws on established asymptotic results (Karrison 2016), provides worked examples and a concrete design algorithm, and explicitly acknowledges the limitations of single summary measures under NPH. However, the central test definition is marred by a sign/direction inconsistency between the formal definition and the numerical cutoffs and examples, and the main robust-power evidence is delegated to a companion paper by the same working group. These issues currently prevent the manuscript from fulfilling its stated goal of a directly implementable guidance.
major comments (4)
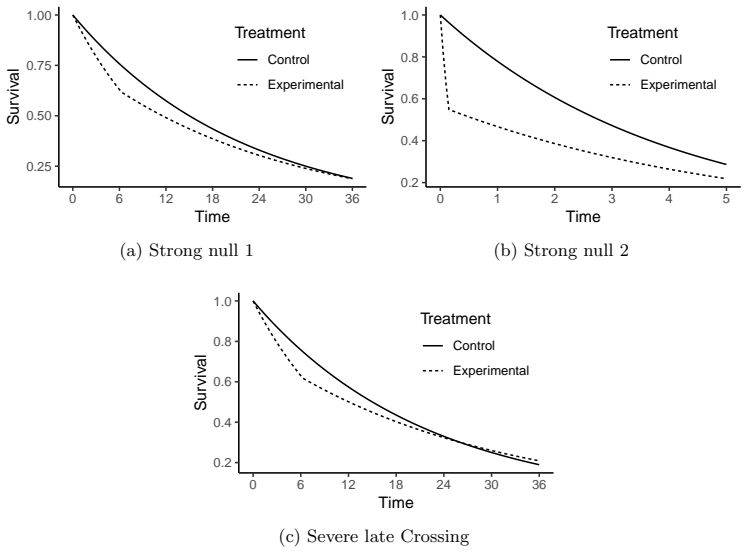
- [Appendix A vs. Appendix D] The definition of the MaxCombo test is internally inconsistent. Appendix A defines Zmax = max{G0,0, G0,1, G1,0, G1,1} and gives the one-sided p-value as P(Zmax > zmax|H0) = 1 - Φ_4(zmax), which is an upper-tail procedure (large positive values are significant). Appendix D, however, solves Φ_4(Zcutoff, 0, ΣH0) ≤ 0.025 and obtains Zcutoff = -2.286, a lower-tail critical value for the maximum: rejection occurs when the maximum is below -2.286, i.e., when all four statistics are simultaneously strongly negative. For a maximum of four positively correlated normals, the one-sided 2.5% upper-tail cutoff is approximately +2.0, not -2.286. If negative values of the Fleming-Harrington statistics are meant to favor treatment, the appropriate combination is the minimum (or the negative of the maximum), not the maximum as written. The worked examples in Table 2 (e.g., IM211 row: selected G0,1 with p=0.002 and MaxCombo p=0.005) are consistent with a minimum-p/lower-tail procedure, contradicting the stated 'max' definition. Because Section 3.1 uses the -2.286 boundary for sample-size calculation and the final p-value is tied to the same statistic, a practitioner following the equations literally cannot implement a test with the claimed operating characteristics. This is a load-bearing inconsistency, independent of the correlation-matrix calibration issue.
- [Section 3.1, Step 2 and Appendix D] The correlation matrix of the four Fleming-Harrington statistics is estimated from a single large simulated null trial with an assumed piecewise-exponential control survival, enrollment rate, and follow-up pattern, and is then treated as the true correlation matrix when computing the adjusted significance boundary and the final MaxCombo p-value. If the actual trial's null survival, censoring, or dropout pattern differs materially from the simulation assumptions, the boundary and p-value can be miscalibrated. The paper does not provide sensitivity analyses, an analytic characterization of the correlation as a function of the underlying censoring pattern, or a conservative fallback. Given that the proposal is for confirmatory regulatory use, the claim of type I error control at 2.5% needs stronger justification than a single simulation scenario.
- [Section 2.1.1 and Section 3.3] The core evidence for robust power and type I error control is delegated to Lin, Lin, Roychoudhury et al. (2020), a companion paper by the same working group. This manuscript itself reports only a limited set of strong-null simulations (Section 2.1.2) and the worked design example (Section 3.3). For a self-contained guidance paper that states the MaxCombo test 'fulfills the necessary regulatory standards,' the reader needs either a summary of the companion's operating characteristics, or at least a verification of the design example's power and type I error under the stated assumptions, rather than a citation. The single simulation check in Section 3.3 ('we confirm type I error and power using simulation') is not described in enough detail to be independently reproducible.
- [Appendix C and Appendix D] The same direction inconsistency appears in the interim-analysis boundary equations. Appendix C states the final boundary condition as P(ZI > zI|H0) + P(ZI ≤ zI, ZF_max > zF_max|H0) ≤ 0.025, which is an upper-tail formulation with zI positive. Appendix D instead writes P(ZI < -2.34|H0) + P(ZI > -2.34, MF < zF|H0) ≤ 0.025, using a negative interim boundary and a lower-tail condition on MF. The sign of the interim efficacy boundary and the direction of the final condition are thus inconsistent between the two appendices, which further complicates implementation.
minor comments (5)
- [Section 1.1] The phrase 'non-proportional hazard is a possibility' in the abstract and elsewhere should be 'non-proportional hazards' for consistency.
- [Section 2.3] The examples use reconstructed and unstratified data, while the published results are stratified; the paper acknowledges this, but it would be helpful to state explicitly that the reported p-values are not directly comparable to the original trial analyses.
- [Section 3.3] The sentence 'Further details of the sample size calculation including correlation matrix for null distribution are provided in Appendix D' is followed by another sentence about interim analysis; reordering for clarity would help.
- [Section 2.1.2] In the strong-null 1 description, 'The curves meet at the 36 month.' has a grammatical error and should probably read 'at 36 months.'
- [Appendix B] The simultaneous confidence interval formula 'HRMaxCombo ± C*×SE(HRMaxCombo)' is written before defining C*; the notation should be introduced before the formula.
Circularity Check
Robustness claim rests on a companion self-citation, and the MaxCombo definition is internally inconsistent between an upper-tail max p-value and a lower-tail design boundary; the central operating-characteristics claim is therefore not fully derived within the paper.
-
self citation load bearing
[Section 2.1.1, paragraph on simulation study; echoed in Section 4.]
"An extensive simulation study under the null hypothesis and different treatment effect scenarios was performed by the cross-pharma working group (Lin, Lin, Roychoudhury et al. (2020)) to understand the statistical operating characteristics (type I error and power) of MaxCombo test. ... In summary, the MaxCombo test fulfills the necessary regulatory standards and is suitable for a confirmatory trial with potential NPH."
The paper's headline conclusion that MaxCombo 'fulfills the necessary regulatory standards' is justified by citing a companion simulation study by the same cross-pharma working group, with overlapping authorship (Roychoudhury and Anderson are authors of both this paper and Lin et al. 2020). The present paper's own simulations only assess strong-null and severe-late-crossing rejection rates; they do not independently produce the PH, delayed-effect, and crossing-survival power comparisons that are used to conclude robustness. The cited work is not reproduced or machine-checked in this paper, and its assumptions include exactly the MaxCombo test whose operating characteristics are claimed.
-
self definitional
[Appendix A p-value formula vs Appendix D boundary and Section 3.3, Step 2.]
"P (Zmax>z max|H0) = P (max(G0,0,G 0,1,G 1,0,G 1,1)>z max|H0) = 1 − ∫ zmax −∞ ∫ zmax −∞ ∫ zmax −∞ ∫ zmax −∞ φ4(ω, 0, Γ)dω ... Therefore, the boundary for MaxCombo (Zcutoff ) is obtained by solving the equation below; Φ4(Zcutoff, 0, ΣH0)≤ 0.025 ... This yields Zcutoff = -2.286."
Appendix A defines the MaxCombo statistic as the maximum of four FH statistics and evaluates an upper-tail probability, rejecting for large positive zmax. Appendix D and Section 3.3 instead compute the boundary by solving the lower-tail CDF at -2.286, rejecting for a sufficiently negative maximum. These two definitions cannot define the same test. The sample-size boundary, the final p-value, and the claimed type I error and power operating characteristics are computed under the second convention, while the paper's stated statistic and p-value formula are the first.
full rationale
The main derivation chain--null multivariate normality of the four FH statistics, the correlation-matrix formula, the boundary search, and the Hasegawa sample-size calculation--is anchored in an external asymptotic result (Karrison 2016) and a standard design formula, so it is not circular by construction. The simulation-based estimate of the correlation matrix is an acknowledged design calibration rather than a prediction, and confirming type I error by simulating the same null model is normal numerical design practice. The principal circularity risk is the load-bearing self-citation: the paper's robustness and 'regulatory standards' conclusion is assigned to a companion paper by the same working group rather than demonstrated inside this paper. Separately, there is a serious self-definitional break between the upper-tail max p-value in Appendix A and the lower-tail cutoff -2.286 in Appendix D; this is a contradiction between two stated definitions and prevents the claimed operating characteristics from being a consequence of the paper's own equations. These issues make the paper only partially circular: the external Karrison anchor and the paper's own strong-null simulations give it independent content, but the central claim is not fully self-contained.
Assumptions & free parameters
free parameters (4)
- MaxCombo weight set (rho,gamma) = (0,0),(0,1),(1,0),(1,1) =
four exponent pairs
- Modified MaxCombo weight set (0,0),(0,0.5),(0.5,0.5),(0.5,0) =
four exponent pairs
- Minimum follow-up recommendation: twice the control median =
2 times control median
- Futility threshold HR > 1.5 =
1.5
assumptions (5)
- standard math The four Fleming-Harrington weighted log-rank statistics follow an asymptotic multivariate normal distribution under the null with the correlation structure given by Karrison (2016).
- domain assumption Independent increments (Tsiatis 1982) hold for the interim log-rank statistic and the final MaxCombo statistics.
- domain assumption The empirical correlation matrix from one large simulated null trial with piecewise-exponential survival and planned enrollment and follow-up equals the correlation matrix of the actual trial.
- ad hoc to paper Strong null and severe late crossing scenarios are unlikely in confirmatory trials and would be stopped early by a data monitoring committee.
- domain assumption Patient-level data reconstructed from published Kaplan-Meier curves using the Guyot et al. (2012) method faithfully represent the original trials for the worked examples.
Cite this review
Pith. "Pith review of Robust Design and Analysis of Clinical Trials With Non-proportional Hazards: A Straw Man Guidance from a Cross-pharma Working Group." pith.science (2026). https://pith.science/paper/5ILS2AKC
@misc{pith2026190807112,
  author       = {Pith},
  title        = {Pith review of: Robust Design and Analysis of Clinical Trials With Non-proportional Hazards: A Straw Man Guidance from a Cross-pharma Working Group},
  year         = {2026},
  howpublished = {\url{https://pith.science/paper/5ILS2AKC}},
  note         = {Machine review of arXiv:1908.07112}
}
read the original abstract
Loss of power and clear description of treatment differences are key issues in designing and analyzing a clinical trial where non-proportional hazard is a possibility. A log-rank test may be very inefficient and interpretation of the hazard ratio estimated using Cox regression is potentially problematic. In this case, the current ICH E9 (R1) addendum would suggest designing a trial with a clinically relevant estimand, e.g., expected life gain. This approach considers appropriate analysis methods for supporting the chosen estimand. However, such an approach is case specific and may suffer lack of power for important choices of the underlying alternate hypothesis distribution. On the other hand, there may be a desire to have robust power under different deviations from proportional hazards. Also, we would contend that no single number adequately describes treatment effect under non-proportional hazards scenarios. The cross-pharma working group has proposed a combination test to provide robust power under a variety of alternative hypotheses. These can be specified for primary analysis at the design stage and methods appropriately accounting for combination test correlations are efficient for a variety of scenarios. We have provided design and analysis considerations based on a combination test under different non-proportional hazard types and present a straw man proposal for practitioners. The proposals are illustrated with real life example and simulation.
Figures


Figures from the paper (1 more)

Reference graph
Works this paper leans on
-
[1]
Nonparametric estimation from incomplete observations
Kaplan E and Meier P. Nonparametric estimation from incomplete observations. Journal of the American Statistical Association 1958; 53(282): 457--481
work page 1958
-
[2]
Asymptotically efficient rank invariant test procedures
Peto R and Peto J. Asymptotically efficient rank invariant test procedures. Journal of the Royal Statistical Society Series A (General) 1972; : 185--207
work page 1972
-
[3]
Regression models and life-tables
Cox D. Regression models and life-tables. Journal of the Royal Statistics Society, Series B 1972; 34: 187--220
work page 1972
-
[4]
Statistical issues and challenges in immuno-oncology
Chen TT. Statistical issues and challenges in immuno-oncology. Journal for ImmunoTherapy of Cancer 2013; 1(18): 1--9
work page 2013
-
[5]
Kaufman PA, Awada A, Twelves C et al. Phase III open-label randomized study of eribulin mesylate versus capecitabine in patients with locally advanced or metastatic breast cancer previously treated with an anthracycline and a taxane. Journal of Clinical Oncology 2015; 33(6): 594--601
work page 2015
-
[6]
Nivolumab versus docetaxel in advanced nonsquamous non–small-cell lung cancer
Borghaei H, Paz-Ares L, Horn L et al. Nivolumab versus docetaxel in advanced nonsquamous non–small-cell lung cancer. New England Journal of Medicine 2015; 373(17): 1627--1639
work page 2015
-
[7]
Herbst RS, Baas P, Kim DW et al. Pembrolizumab versus docetaxel for previously treated, pd-l1-positive, advanced non-small-cell lung cancer ( KEYNOTE-010 ): a randomised controlled trial. The Lancet 2016; 387(10027): 1540 -- 1550
work page 2016
-
[8]
A class of rank test procedures for censored survival data
Harrington D and Fleming T. A class of rank test procedures for censored survival data. Biometrika 1982; 69(3): 553--566
work page 1982
Show all 51 references
-
[9]
Cox analysis of survival data with non-proportional hazard functions
Schemper M. Cox analysis of survival data with non-proportional hazard functions. The Statistician 1992; : 455--465
1992
-
[10]
Designing therapeutic cancer vaccine trials with delayed treatment effect
Xu Z, Zhen B, Park Y et al. Designing therapeutic cancer vaccine trials with delayed treatment effect. Statistics in Medicine 2017; 36(4): 592--605
2017
-
[11]
Designing cancer immunotherapy trials with random treatment time-lag effect
Xu Z, Park Y, Zhen B et al. Designing cancer immunotherapy trials with random treatment time-lag effect. Statistics in Medicine 2018
2018
-
[12]
Modestly weighted logrank tests
Magirr D and Burman CF. Modestly weighted logrank tests. Statistics in Medicine 2019; 38(20): 3782--3790
2019
-
[13]
Analyzing survival curves at a fixed point in time
Klein JP, Logan B, Harhoff M et al. Analyzing survival curves at a fixed point in time. Statistics in Medicine 2007; 26(24): 4505--4519
2007
-
[14]
The use of restricted mean survival time to estimate the treatment effect in randomized clinical trials when the proportional hazards assumption is in doubt
Royston P and Parmar MK. The use of restricted mean survival time to estimate the treatment effect in randomized clinical trials when the proportional hazards assumption is in doubt. Statistics in medicine 2011; 30(19): 2409--2421
2011
-
[15]
Moving beyond the hazard ratio in quantifying the between-group difference in survival analysis
Uno H, Claggett B, Tian L et al. Moving beyond the hazard ratio in quantifying the between-group difference in survival analysis. Journal of Clinical Oncology 2014; 32(22): 2380--2385
2014
-
[16]
Predicting the restricted mean event time with the subject's baseline covariates in survival analysis
Tian L, Zhao L and Wei LJ. Predicting the restricted mean event time with the subject's baseline covariates in survival analysis. Biostatistics 2014; 15(2): 222--233
2014
-
[17]
Weighted kaplan-meier statistics: A class of distance tests for censored survival data
Pepe MS and Fleming TR. Weighted kaplan-meier statistics: A class of distance tests for censored survival data. Biometrics 1989; 45(2): 497--507
1989
-
[18]
Alternative analysis methods for time to event endpoints under nonproportional hazards: A comparative analysis
Lin RS, Lin J, Roychoudhury S et al. Alternative analysis methods for time to event endpoints under nonproportional hazards: A comparative analysis. Statistics in Biopharmaceutical Research 2020; 12(2): 187--198
2020
-
[19]
Long-term survival with non-proportional hazards: results from the Dutch gastric cancer trial
Putter H, Sasako M, Hartgrink HH et al. Long-term survival with non-proportional hazards: results from the Dutch gastric cancer trial. Statistics in Medicine 2005; 24(18): 2807--2821
2005
-
[20]
Testing treatment effect in randomized clinical trials with possible nonproportional hazards
Callegaro A and Spiessens B. Testing treatment effect in randomized clinical trials with possible nonproportional hazards. Statistics in Biopharmaceutical Research 2017; 9(2): 204--211
2017
-
[21]
On the versatility of the combination of the weighted log-rank statistics
Lee SH. On the versatility of the combination of the weighted log-rank statistics. Computational Statistics and Data Analysis 2007; 51(12): 6557--6564
2007
-
[22]
Some versatile tests based on the simultaneous use of weighted logrank and weighted kaplan-meier statistics
Chi Y and Tsai MH. Some versatile tests based on the simultaneous use of weighted logrank and weighted kaplan-meier statistics. Communications in Statistics - Simulation and Computation 2001; 30(4): 743--759
2001
-
[23]
A two-sample censored-data rank test for acceleration
Breslow NE, Edler L and Berger J. A two-sample censored-data rank test for acceleration. Biometrics 1984; 40(4): 1049--1062
1984
-
[24]
Some versatile tests based on the simultaneous use of weighted log-rank statistics
Lee JW. Some versatile tests based on the simultaneous use of weighted log-rank statistics. Biometrics 1996; 52(2): 721--725
1996
-
[25]
Comparing treatments in the presence of crossing survival curves: An application to bone marrow transplantation
Logan BR, Klein JP and Zhang MJ. Comparing treatments in the presence of crossing survival curves: An application to bone marrow transplantation. Biometrics 2008; 64(3): 733--740
2008
-
[26]
Improved logrank-type tests for survival data using adaptive weights
Yang S and Prentice R. Improved logrank-type tests for survival data using adaptive weights. Biometrics 2010; 66(1): 30--38
2010
-
[27]
Versatile tests for comparing survival curves based on weighted log-rank statistics
Karrison T. Versatile tests for comparing survival curves based on weighted log-rank statistics. Stata Journal 2016; 16(3): 678--690
2016
-
[28]
Linear regression with censored data
Buckley J and James I. Linear regression with censored data. Biometrika 1979; 66(3): 429--436
1979
-
[29]
Linear rank tests with right censored data
Prentice RL. Linear rank tests with right censored data. Biometrika 1978; 65(1): 167--179
1978
-
[30]
Innovative estimation of survival using log-normal survival modelling on accent database
Chapman JW, O'Callaghan CJ, Hu N et al. Innovative estimation of survival using log-normal survival modelling on accent database. British Journal of Cancer 2013; 108(4): 784--790
2013
-
[31]
Generalized pairwise comparisons of prioritized outcomes in the two-sample problem
Buyse M. Generalized pairwise comparisons of prioritized outcomes in the two-sample problem. Statistics in Medicine 2010; 29(30): 3245--3257
2010
-
[32]
Per\' o n J, Roy P, Ozenne B et al. The Net Chance of a Longer Survival as a Patient-Oriented Measure of Treatment Benefit in Randomized Clinical Trials Measurement of the Net Chance of a Longer SurvivalMeasurement of the Net Chance of a Longer Survival . JAMA Oncology 2016; 2...
2016
-
[33]
International Conference on Harmonization ( I C H E9 ): Statistical principles for clinical trials 1998; ://www.ich.org/fileadmin/Public_Web_Site/ICH_Products/Guidelines/Efficacy/E9/Step4/E9_Guideline.pdf
1998
-
[34]
Journal of Computational and Graphical Statistics 1992; 1(2): 141--149
Numerical computation of multivariate normal probabilities. Journal of Computational and Graphical Statistics 1992; 1(2): 141--149
1992
-
[35]
Methods for accommodating nonproportional hazards in clinical trials: Ready for the primary analysis? Journal of Clinical Oncology 2019; 37(35): 3455--3459
Freidlin B and Korn EL. Methods for accommodating nonproportional hazards in clinical trials: Ready for the primary analysis? Journal of Clinical Oncology 2019; 37(35): 3455--3459
2019
-
[36]
Monitoring for lack of benefit: A critical component of a randomized clinical trial
Freidlin B and Korn EL. Monitoring for lack of benefit: A critical component of a randomized clinical trial. Journal of Clinical Oncology 2009; 27(4): 629--633
2009
-
[37]
The consequences of proportional hazards based model selection
Campbell H and Dean C. The consequences of proportional hazards based model selection. Statistics in Medicine 2014; 33(6): 1042--1056
2014
-
[38]
Proportional hazards tests and diagnostics based on weighted residuals
Grambsch P and Theneau T. Proportional hazards tests and diagnostics based on weighted residuals. Biometrika 1994; 81(3): 515--526
1994
-
[39]
The estimation of average hazard ratios by weighted cox regression
Schemper M, Wakounig S and Heinze G. The estimation of average hazard ratios by weighted cox regression. Statistics in Medicine 2009; 28(19): 2473--2489
2009
-
[40]
Estimating average regression effect under non-proportional hazards
Xu R and O'Quigley J. Estimating average regression effect under non-proportional hazards. Biostatistics 2000; 1(4): 423--439
2000
-
[41]
Powles T, Dur\' a n I, van der Heijden MS et al. Atezolizumab versus chemotherapy in patients with platinum-treated locally advanced or metastatic urothelial carcinoma (imvigor211): a multicentre, open-label, phase 3 randomised controlled trial. The Lancet 2018; 391(10122): 748--757
2018
-
[42]
Enhanced secondary analysis of survival data: reconstructing the data from published kaplan-meier survival curves
Guyot P, Ades AE, Ouwens MJ et al. Enhanced secondary analysis of survival data: reconstructing the data from published kaplan-meier survival curves. BMC Medical Research Methodology 2012; 12(1): 9
2012
-
[43]
Cohen EEW, Souli \'e res D, Le Tourneau C et al. Pembrolizumab versus methotrexate, docetaxel, or cetuximab for recurrent or metastatic head-and-neck squamous cell carcinoma ( KEYNOTE-040 ): a randomised, open-label, phase 3 study. The Lancet 2019; 393(10167): 156--167
2019
-
[44]
Moore MJ, Goldstein D, Hamm J et al. Erlotinib plus gemcitabine compared with gemcitabine alone in patients with advanced pancreatic cancer: A phase iii trial of the national cancer institute of canada clinical trials group. Journal of Clinical Oncology 2007; 25(15): 1960--1966
2007
-
[45]
Group sequential tests for long-term survival comparisons
Logan BR and Mo S. Group sequential tests for long-term survival comparisons. Lifetime Data Analysis 2015; 21(2): 218--240
2015
-
[46]
Sample size determination for the weighted log-rank test with the fleming–harrington class of weights in cancer vaccine studies
Hasegawa T. Sample size determination for the weighted log-rank test with the fleming–harrington class of weights in cancer vaccine studies. Pharmaceutical Statistics 2014; 13(2): 128--135
2014
-
[47]
Group sequential monitoring based on the weighted log-rank test statistic with the fleming–harrington class of weights in cancer vaccine studies
Hasegawa T. Group sequential monitoring based on the weighted log-rank test statistic with the fleming–harrington class of weights in cancer vaccine studies. Pharmaceutical Statistics 2016; 15(5): 412--419
2016
-
[48]
Repeated significance testing for a general class of statistics used in censored survival analysis
Tsiatis AA. Repeated significance testing for a general class of statistics used in censored survival analysis. Journal of the American Statistical Association 1982; 77(380): 855--861
1982
-
[49]
Interim analysis: The alpha spending function approach
Demets DL and Lan KKG. Interim analysis: The alpha spending function approach. Statistics in Medicine 1994; 13(13‐14): 1341--1352
1994
-
[50]
nphsim: https://github.com/keaven/nphsim
-
[51]
Modeling Survival Data: Extending the C ox Model
Terry M Therneau and Patricia M Grambsch . Modeling Survival Data: Extending the C ox Model . New York: Springer, 2000. ISBN 0-387-98784-3
2000
Reviewed August 14, 2026 · model on record in the stance chip above.
Discussion (0). Continue with ORCID to comment.