REVIEW 2 major objections 5 minor 41 references
The first astrophysical result of HISAKI: a search for the EUV He I lines a massive cool core cluster at z=0.7
T0 review · 2 major / 5 minor · reviewed 2026-08-14 · deepseek-v4-flash
Pith's one-line read The first extragalactic EUV search for neutral helium lines finds almost no 30,000-K gas in the massive cool-core cluster RCS2327, implying AGN feedback quenches cooling at z=0.7.
desk verdict A genuine observational first whose abstract overclaims: the He I non-detection is consistent with steady cooling at ~1 sigma, so the feedback conclusion needs reframing. read the letter →
The pith
A machine-rendered reading of the paper's core claim, the machinery that carries it, and where it could break.
The reading
What carries the argument
The central object is the pair of neutral helium lines He I alpha (rest 58.43 nm) and He I beta (53.70 nm), both peaking in emissivity at about 3.16e4 K. At z=0.6986 these lines shift to 99.25 nm and 91.21 nm, longward of the Galactic Lyman limit, making them observable from orbit. The argument is carried by comparing the observed non-detection with the line flux expected from a steady cooling flow, computed via the Edgar and Chevalier (1986) cooling-flow line luminosity formula using the cluster's deprojected X-ray temperature and density profiles from Chandra and the cooling rate of 411 solar masses per year. The upper limits on line flux are converted to gas mass and volume using AtomDB line emissivities and the assumption of pressure equilibrium with the hot intracluster medium.
What would settle it
A single EUV observation with higher spectral resolution or a blank-field pointing at the same sky coordinates that detects He I $\alpha$ at a flux near the steady-cooling expectation of 3.7e-17 erg/s/$cm^{2}$, or an independent airglow model that shows the interpolated background is biased low, would overturn the conclusion that cooling is suppressed.
Extended reading notes
Core claim
The central claim is that the amount of gas at $10^{4}$ to $10^{5}$ K in the core of RCS2327 is far smaller than a steady cooling flow would produce. Using the non-detection of the He I $\beta$ line, the paper derives a 1-$\sigma$ upper limit of 7.8e-16 erg/s/$cm^{2}$, which translates, under pressure equilibrium with the hot gas, into a warm-gas mass no greater than 2.9 million solar masses within the central 74 kpc, occupying a volume below 1.2e6 $pc^{3}$ and a filling factor below 1e-6. Because the cluster's X-ray-derived cooling rate is 400 solar masses per year, the absence of the expected 30,000-K gas implies that cooling is suppressed, consistent with heating by the active galactic nucleus. The paper also notes that the substantial systematic uncertainty, dominated by background subtraction, prevents a firm rule-out of steady cooling.
Load-bearing premise
The entire upper-limit analysis rests on the accuracy of the background subtraction at the redshifted He I wavelengths, where the spatial variation of geocoronal airglow is interpolated from four bright lines at other wavelengths and 40 local background regions; any bias in that interpolation directly shifts the measured fluxes and the derived mass and volume limits.
Editorial extensions
If this is right
- If the upper limits hold, steady-state radiative cooling of the hot intracluster medium in massive high-redshift cool-core clusters is suppressed by more than an order of magnitude at 30,000 K.
- The warm gas that does exist must be concentrated in small filaments with radius below 100 pc rather than filling the cool core, consistent with the multiphase gas structures seen in nearby clusters like Perseus and Virgo.
- The absence of 10^4-5 K gas tightens the link between the hot and cold phases: either thermal conduction is quenched, or turbulent mixing produces gas near 10^5 K that outshines the 3e4 K gas.
- A low t_cool/t_ff ratio alone is not sufficient to guarantee condensation; there may be a delay before thermal instability produces cold gas, or the cluster may not satisfy the instability condition.
- EUV line spectroscopy becomes a viable probe of intermediate-temperature gas in distant clusters, provided targets are chosen with redshifts that shift the lines out of Galactic absorption.
Reading between the lines
- If this method is sound, small EUV spectrometers on planetary missions can be repurposed to constrain the multiphase gas content of z~0.7 clusters, a regime largely inaccessible to current X-ray spectrometers.
- Applying the same technique to a small sample of cool-core clusters at similar redshifts could map how the warm-gas fraction varies with cluster mass and cooling rate, testing whether feedback efficiency changes across cosmic time.
- A future EUV mission with higher spectral resolution and better airglow rejection could turn the upper limits into a detection or a much tighter bound, directly testing the steady-cooling expectation of about 3.7e-17 erg/s/cm^2 for He I alpha.
- The comparison with Perseus suggests a testable corollary: if the warm-gas deficit is generic, then the multiphase filaments in nearby clusters may be fueled by mergers rather than by residual cooling of the intracluster medium.
Signed reviews
Editorial analysis
A structured set of objections, weighed in public.
Referee Report
Summary. The paper reports the first extragalactic observation with the Hisaki EUV spectrometer, targeting RCS2 J232727.6-020437, a massive cool-core cluster at z=0.6986. The authors search for redshifted He I alpha and He I beta lines as tracers of 10^4-5 K gas, using Chandra data to measure the hot ICM and derive a cooling rate of 411 M_sun/yr. They compare the measured EUV fluxes with predictions from a steady cooling-flow model based on Edgar & Chevalier and report non-detections, from which they derive upper limits on the mass and volume of warm gas. The paper is careful in its data reduction and systematic-error treatment, but the sensitivity of the He I observations is too low to test the steady cooling-flow model, and the abstract's claim that the warm-gas amount is smaller than expected is not supported by the quoted limits. The paper itself concedes in Section 4.2 that the steady cooling flow cannot be firmly ruled out.
Significance. If the central claim were established, this would be a pioneering result: the first astrophysical use of Hisaki, the first He I line search in a galaxy cluster, and the first direct probe of 10^4-5 K gas in a z~0.7 cool-core cluster. The analysis is commendable for its transparency: the expected fluxes are computed from a forward cooling-flow model using the Chandra-measured cooling rate rather than fitted to the He I data, and the systematic uncertainties are estimated from 40 different background regions. However, the current sensitivity is insufficient to distinguish between steady cooling and suppressed cooling: the 1-sigma upper limit on He I alpha is only about twice the predicted steady-cooling flux, and the He I beta limit is about two orders of magnitude above the prediction. The result is therefore best viewed as a demonstration of feasibility and as weak upper limits, not as evidence that feedback is efficient.
major comments (2)
- [Section 3.1, Section 4.2, Abstract] The central claim in the Abstract and in Section 5 that RCS2327 contains less 10^4-5 K gas than expected from uninhibited cooling is not supported by the reported uncertainties. In Section 3.1 the measured He I alpha flux is -6.9 +/- 3.1(stat) +/- 7.0(sys) x 10^-16 erg/s/cm^2, so the 1-sigma upper limit (statistical and systematic added in quadrature) is approximately 7.5 x 10^-17 erg/s/cm^2, only about twice the steady-cooling prediction F(He I alpha) = 3.67 x 10^-17 quoted in Section 4.2. The He I beta limit is roughly 200 times the predicted flux. The non-detection is therefore consistent with the steady cooling-flow model at the ~1-sigma level, and it cannot 'demonstrate' that feedback is efficient. The paper itself concedes this in Section 4.2 ('we can not firmly rule out the cooling flow in a steady state'), so the Abstract and Section 5 need to be revised to present the result as a weak upper limit rather than as evidence of a deficit.
- [Section 4.1] The upper limits on the warm-gas mass (no more than 2.9 x 10^6 M_sun) and volume (less than 1.2 x 10^6 pc^3) are valid upper limits, but they do not constrain the steady cooling-flow model because the predicted He I beta flux in that model is 3.85 x 10^-18 erg/s/cm^2, a factor of about 200 below the 1-sigma upper limit used to derive these bounds. The subsequent discussion in Sections 4.1.1-4.1.3 and the filament sketch in Figure 8 implicitly treat the upper limits as evidence for a real absence of warm gas; this interpretation should be explicitly flagged as contingent on much deeper observations.
minor comments (5)
- [Section 3.1] The text says 'access the systematic uncertainties' but should read 'assess the systematic uncertainties'; similarly, 'SunyaevZeldovich' in Section 1 should be 'Sunyaev-Zeldovich' and 'Asplund at al.' should be 'Asplund et al.'.
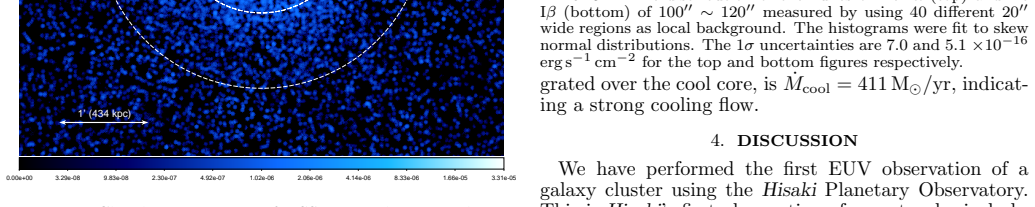
- [Figure 3] The red and blue markers for the expected steady-cooling fluxes would be more informative if accompanied by horizontal lines showing the 1-sigma and 2-sigma upper-limit levels, given the large systematic uncertainties.
- [Section 4.2, Eq. (3)] The parameter k in Eq. (3) is not defined in the text; please define it explicitly.
- [Section 4.2] The choice s = 0.5 for the cooling mode is not accompanied by a sensitivity check; a brief statement of how the predicted fluxes change for s = 0 and s = 1 would help the reader assess the robustness of the comparison.
- [Section 2.1, Figure 5] Please clarify whether any of the 40 background regions used for the systematic estimate overlap the source extraction region (100-120 arcsec); the listed examples such as 40-60 arcsec appear adjacent, but the full set should be described and any overlap explicitly excluded.
Circularity Check
No significant circularity: the expected He I fluxes are computed from a Chandra-derived cooling rate and atomic data, independently of the Hisaki measurements.
full rationale
The paper's central comparison is not circular. The measured He I alpha and He I beta fluxes in Section 3.1 are observed quantities, with statistical and systematic uncertainties estimated from the data itself (including 40 local-background realizations). The expected fluxes in Section 4.2 are derived from the steady cooling flow model of Edgar & Chevalier (1986), Eq. 3, using the cooling rate Mdot_cool = 411 M_sun/yr obtained from Chandra X-ray spectra via Eq. 2 in Section 3.2, together with AtomDB line emissivities and elemental abundances. No parameter of this predicted flux is fitted to the Hisaki He I lines; the prediction is therefore an independent forward calculation. The mass and volume upper limits in Section 4.1 are likewise direct conversions of the measured He I beta upper limit through the line cooling function and an assumed pressure equilibrium, not quantities that presuppose the conclusion. The only self-citations, Su et al. 2017a,b in Section 4.1.3, support an interpretive discussion of turbulent mixing and are not load-bearing for the main non-detection argument. The skeptic's objection that the 1-sigma upper limit is larger than the predicted flux is a sensitivity or statistical-overclaim concern, not a circularity: the derivation chain does not reduce the prediction to the measurement by construction. The paper is self-contained against the external atomic and X-ray inputs it cites.
Assumptions & free parameters
free parameters (2)
- Mdot_cool =
411 M_sun/yr
- s (cooling mode parameter) =
0.5
assumptions (3)
- domain assumption He I line emissivities and the cooling function are accurately given by AtomDB and the cited atomic databases.
- domain assumption The warm gas at ~3e4 K is in pressure equilibrium with the hot X-ray emitting ICM.
- domain assumption The cluster's own interstellar medium is optically thin to the redshifted He I lines at 91.21 and 99.25 nm.
Cite this review
Pith. "Pith review of The first astrophysical result of HISAKI: a search for the EUV He I lines a massive cool core cluster at z=0.7." pith.science (2026). https://pith.science/paper/5KVN2J3G
@misc{pith2026190810891,
  author       = {Pith},
  title        = {Pith review of: The first astrophysical result of HISAKI: a search for the EUV He I lines a massive cool core cluster at z=0.7},
  year         = {2026},
  howpublished = {\url{https://pith.science/paper/5KVN2J3G}},
  note         = {Machine review of arXiv:1908.10891}
}
abstract
Molecular cold gas and star formation have been observed at centers of cool-core clusters, albeit at a level much smaller than expected from the classic cooling model. Feedback from the supermassive black hole is likely to have prevented hot gas from cooling. However, the exact cooling and heating processes are poorly understood. The missing key piece is the link between the hot gas ($10^7$\,K) and cold gas ($10^3$\,K). Using the extreme ultraviolet spectrometer onboard {\sl Hisaki}, we explore a distant galaxy cluster, RCS2 J232727.6-020437, one of the most massive cool-core clusters with a cooling rate of $400$\,M$_{\odot}$\,yr$^{-1}$. We aim to detect gas at intermediate temperatures ($3\times10^4$\,K) emitting He I$\alpha$ and He I$\beta$ at rest wavelengths of 58.4 nm and 53.7 nm, respectively. Our target resides at $z=0.6986$, for which these He I lines shift away from the absorption of the Galaxy. Our findings show that the amount of $10^{4-5}$\,K gas at the center of this cluster is smaller than expected if cooling there was uninhibited, which demonstrates that feedback both operates and is efficient for massive clusters at these epochs.
Figures


Figures from the paper (5 more)



Reference graph
Works this paper leans on
- [1]
-
[2]
Asplund, M., Grevesse, N., Jacques S. A. 2006, NuPhA, 777, 1
work page 2006
-
[3]
Begelman, M. C. & Fabian, A. C. 1990, MNRAS, 244, 26
work page 1990
-
[4]
Bregman, J. N., Fabian, A. C., Miller, E. D, et al. 2006, ApJ, 642, 759
work page 2006
-
[5]
2013, ApJ, 779, 127 Conselice C
Chiang, Y.-K., Overzier, R., & Gebhardt, K. 2013, ApJ, 779, 127 Conselice C. J. & Gallagher III J. S. 1999, AJ 117, 75 Conselice C. J., Gallagher III J. S., Wyse R. F. G., 2001, ApJ, 122, 2
work page 2013
-
[6]
Young, P. R. 1997, A&AS, 125, 149
work page 1997
-
[7]
Edgar, R. J. & Chevalier, R. A. 1986, ApJ, 310, 27
work page 1986
-
[8]
Edge, A. C. 2001, MNRAS, 328, 762
2001
Show all 41 references
-
[9]
C.; Sanders, J
Fabian, A. C.; Sanders, J. S.; Ettori, S. et al. 2000, MNRAS, 318, 65
2000
-
[10]
C., Mushotzky, R
Fabian, A. C., Mushotzky, R. F., Nulsen, P. E. J. et al. 2001, MNRAS, 321, 20L
2001
-
[11]
J., Chatzikos, M., Guzm´ an, F
Ferland, G. J., Chatzikos, M., Guzm´ an, F. et al. 2017 Rev. Mex. Astron. Astrofis., 53, 385
2017
-
[12]
& Jones, C
Forman, W. & Jones, C. 1982, ARA&A, 20, 547 Forman W., Kellogg E., Gursky, H. et al. 1972, ApJ, 178, 309 Hitomi Collaboration, Aharonian, F., Akamatsu, H., et al. 2016, Natur, 535, 117
1982
-
[13]
T., McNamara, B
Hogan, M. T., McNamara, B. R., Pulido, F. A. et al. 2017 ApJ 851, 66
2017
-
[14]
Gaspari, M., Ruszkowski, M., & Oh, S. P. 2013, MNRAS, 432, 3401
2013
-
[15]
B., et al
Gendron-Marsolais, M., Hlavacek-Larrondo, J., Martin, T. B., et al. 2018, MNRAS, 479, L28
2018
-
[16]
G., Gladders, M
Gilbank, D. G., Gladders, M. D., Yee, H. K. C. et al. 2011 AJ, 141, 94
2011
-
[17]
P., Leenaarts, J., Carlsson, M
Golding, T. P., Leenaarts, J., Carlsson, M. 2017, A&A, 597, 102
2017
-
[18]
Kalberla, P. M. W., Burton, W. B., Hartmann, D. et al. 2005 A&A 440 775
2005
-
[19]
2017, JGRA, 122, 1269
Kuwabara, M., Yoshioka, K., Murakami, G., et al. 2017, JGRA, 122, 1269
2017
-
[20]
Kimura, T., Yamazaki, A., Yoshioka, K. et al. 2019 JSWSC, 9A 8
2019
-
[21]
Labrosse, N., Gouttebroze, P., Vial, J. -C. 2007, A&A, 463, 117,
2007
-
[22]
R., Dere, K
Landi, E., Young, P. R., Dere, K. P. et al. 2013, ApJ, 763, 86
2013
-
[23]
McDonald, M., Veilleux, S., Rupke, D. S. N. et al. 2010, ApJ, 721, 2
2010
-
[24]
2012, MNRAS, 419, 3319
McCourt, M., Sharma, P., & Quataert, E., et al. 2012, MNRAS, 419, 3319
2012
-
[25]
& Switzer, E
McQuinn, M. & Switzer, E. R. 2010, MNRAS, 408, 1945
2010
-
[26]
McNamara, B. R. & Nulsen, P. E. J. 2007, ARA&A, 45, 117
2007
-
[27]
R., Russell, H
McNamara, B. R., Russell, H. R., Nulsen, P. E. J. et al. 2016 ApJ 830, 79 O’Dea, C. P., Baum, S. A., Privon, G et al. 2008, ApJ, 681, 1035
2016
-
[28]
R., Cowie, L., Davidsen, A
Oegerle, W. R., Cowie, L., Davidsen, A. et al. 2001, ApJ, 560, 187
2001
-
[29]
K., Fabian, A
Panagoulia, E. K., Fabian, A. C., & Sanders, J. S. 2014, MNRAS, 438, 2341
2014
-
[30]
R., Kahn, S
Peterson, J. R., Kahn, S. M., Paerels, F. B. S. et al. 2003, ApJ, 590, 207
2003
-
[31]
& Vogel, S
Reimers, D. & Vogel, S. 1993 A&A 276 13
1993
-
[32]
R., McNamara, B
Russell, H. R., McNamara, B. R., Edge, A. C., et al. 2014, ApJ, 784, 78
2014
-
[33]
R., McNamara, B
Russell, H. R., McNamara, B. R., Fabian, A. C., et al. 2016, MNRAS, 458, 3134
2016
-
[34]
R., McDonald, M., McNamara, B
Russell, H. R., McDonald, M., McNamara, B. R., et al. 2017, ApJ, 836, 130 Salom´ e, P., Combes, F., Edge, A. C. et al. 2006, A&A, 454, 437
2017
-
[35]
D., Marrone, D
Sharon, K., Gladders, M. D., Marrone, D. P. et al. 2015, ApJ, 814, 21
2015
-
[36]
A & Zel’dovich, Y
Sunyaev, R. A & Zel’dovich, Y. B. 1972 CoASP 4 173
1972
-
[37]
N., McNamara, B
Vantyghem, A. N., McNamara, B. R., Russell, H. R., et al. 2016, ApJ, 832, 148
2016
-
[38]
Wang, T., Elbaz, D., Daddi, E. et al. 2016, ApJ, 828, 56
2016
-
[39]
R., Churazov, E
Werner, N., McNamara, B. R., Churazov, E. et al. 2019, SSRv, 215, 5
2019
-
[40]
Yoshioka, K., Murakami, G., Yamazaki, A. et al. 2013, P&SS, 85, 250
2013
-
[41]
Yoshikawa, I., Yoshioka, K., Murakami, G. et al. 2014, SSRv, 184, 237
2014
Reviewed August 14, 2026 · model on record in the stance chip above.
Discussion (0). Continue with ORCID to comment.