REVIEW 4 major objections 4 minor 1 cited by
MM-DREX: Multimodal-Driven Dynamic Routing of LLM Experts for Financial Trading
T0 review · 4 major / 4 minor · reviewed 2026-08-05 · deepseek-v4-flash
Pith's one-line read A vision-language model reads candlestick charts and time-series data to route capital between four specialized trading strategies, and the authors report it outperforms 15 baselines across stocks, futures, and cryptocurrency markets.
desk verdict Interesting architecture, untrustworthy numbers—the B&H baseline is defined as a look-ahead rule and the reported crypto MDD doesn't match the data. read the letter →
The pith
A machine-rendered reading of the paper's core claim, the machinery that carries it, and where it could break.
The reading
What carries the argument
The dynamic router: a vision-language model (a 72-billion-parameter VLM adapted with low-rank adapters) that fuses a candlestick chart image with a standardized window of OHLCV and technical-indicator time series, then outputs a softmax weight vector over four experts. The four heterogeneous experts are specialized heads—trend, reversal, breakout, positioning—each with its own policy and value head but sharing the same multimodal representation. The SFT-RL hybrid training is the mechanism that makes the two parts work together: supervised fine-tuning gives the router market-classification priors, and a PPO-style clipped objective with a reward combining excess return, Sharpe ratio, drawdown
What would settle it
Re-run the reported experiments with a per-trade cost of 10 basis points, a realistic slippage model, and position-size caps on illiquid futures and crypto, then compare total return and Sharpe ratio against FinAgent, PPO, and the technical baselines. If the gap over the best baseline on each market shrinks to within one standard error, the claimed outperformance fails.
Extended reading notes
Core claim
MM-DREX's central claim is that dynamic, multimodal routing is what makes an expert ensemble work in trading. The router, initialized by supervised fine-tuning on a three-way market classification task (uptrend, downtrend, consolidation) and then refined by reinforcement learning, allocates real-time weights to four independently trained experts. Each expert emits a sub-strategy from a small action space (e.g., moving-average crossover, Bollinger reversion, volume breakout, long-only or cash), and the final decision is a weighted aggregation. A group-relative reward pushes experts away from each other so they do not collapse into the same policy. In the paper's experiments, this design beats
Load-bearing premise
The load-bearing premise is that the backtest results, which assume zero transaction costs, no slippage, and no liquidity constraints, represent the strategy's real-world edge; the paper lists adding costs, liquidity constraints, and latency as future work.
Editorial extensions
If this is right
- If MM-DREX's reported results hold, the router-plus-experts division becomes a template for adaptive LLM agents in any domain where states change regimes, not just finance.
- Dynamic routing is the load-bearing component: the ablation claims a 45.3% larger maximum drawdown under uniform weighting, so any deployment should preserve adaptive weights rather than a fixed mixture.
- Visual modality is not decorative in this architecture: dropping chart images is reported to cut directional accuracy by about 6.5 percentage points and to worsen drawdown substantially.
- The group-relative reward gives a concrete way to keep specialized policies diverse, directly addressing the homogeneous-expert failure of earlier mixture-of-experts trading models.
- The multimodal dataset spanning 62 assets across five markets could serve as a shared benchmark for evaluating LLM trading agents, provided its regime labels are trusted.
Reading between the lines
- If realistic per-trade costs and liquidity caps were applied, the absolute returns would shrink; whether MM-DREX keeps its edge is an open empirical question the paper does not test.
- The 60.21% regime-classification accuracy is close to the 60% directional accuracy the authors measured for top multimodal LLMs, suggesting the system's advantage may come from diversification across experts rather than from superhuman forecasting.
- A natural extension the paper leaves implicit is to apply the same routing mechanism at the portfolio level—selecting assets and position sizes—rather than only weighting strategies for a single asset.
- The dual-annotation regime labels rely on three human traders plus technical indicators; a stress test would be to see whether routing degrades when labels are generated by noisy or adversarial annotations.
Signed reviews
Editorial analysis
A structured set of objections, weighed in public.
Referee Report
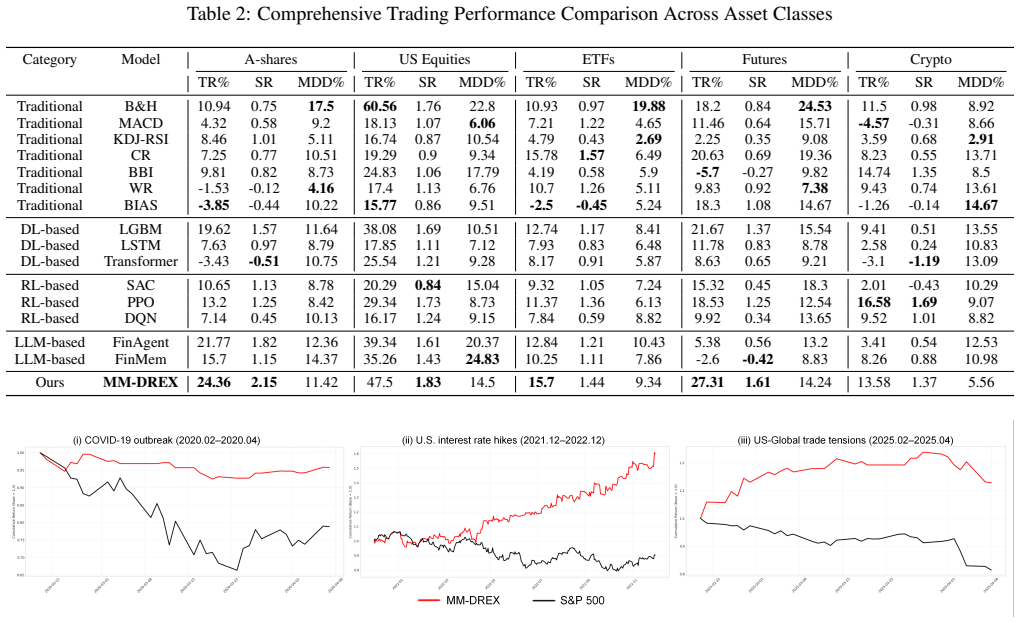
Summary. The paper proposes MM-DREX, an LLM/VLM-based trading framework that decouples market-state perception from strategy execution. A dynamic router fuses candlestick images, technical time series, and textual summaries to allocate weights among four hand-designed trading experts (trend, reversal, breakout, positioning), and the system is trained with a two-stage SFT-RL procedure. The authors evaluate MM-DREX on a self-constructed multi-asset dataset covering US equities, A-shares, ETFs, futures, and cryptocurrencies, and claim that it significantly outperforms 15 baselines on total return, Sharpe ratio, and maximum drawdown. The paper also reports ablations for routing mechanisms and visual/temporal modalities, plus crisis-event comparisons against the S&P 500. The architectural idea is coherent and the cross-market dataset is a useful contribution, but the empirical evidence as presented is not robust enough to support the central outperformance claim.
Significance. If the reported results were reliable, the paper would make a meaningful contribution: the explicit separation of a VLM-based router from heterogeneous, interpretable trading experts is a plausible way to address regime shifts, and the hybrid SFT-RL training scheme is a reasonable solution to jointly optimizing modules with different objectives. The dataset spanning five asset classes across multiple markets is also valuable as a multimodal benchmark. However, the significance is currently conditional. The central claim rests on a backtest whose baselines are not reproducibly defined, whose hyperparameters are selected using the final test data, and whose returns ignore transaction costs and slippage. In addition, no statistical significance tests or multiple-seed results are provided. These are not cosmetic issues: they directly affect whether Table 2 can be read as evidence of outperformance. The paper should be credited for including explicit interpretability traces and for a detailed appendix with algorithmic descriptions, but these strengths do not compensate for the empirical validity gaps.
major comments (4)
- [Appendix D, Eq. (D.4); Table 2] The B&H baseline is defined as h_B&H = sign(P_{t+1} - P_t), i.e., a one-step look-ahead perfect-foresight rule. If this rule were actually backtested, the cumulative returns would compound daily directional moves and would be far larger than the values reported in Table 2. If it was instead implemented as a long-only buy-and-hold strategy, the appendix does not describe the tested strategy. Independently, the reported crypto B&H MDD of 8.92% is inconsistent with a long-only BTC/ETH portfolio over the stated chronological 60/20/20 split, since the 2024-2025 test window includes drawdowns well above that level. Because every relative improvement in Table 2 is measured against baselines, this reproducibility failure undermines the empirical core of the paper.
- [Appendix C; Section 'Dataset Construction'] The choice of input window (T_in=100), prediction horizon (T_pred=90), and teacher model (GPT-o3) is made by evaluating 12 multimodal LLMs on 37 assets randomly selected from the same dataset, with no indication that this evaluation is restricted to a separate validation partition. Since the final test set is then used for MM-DREX's evaluation, the test set has been used for hyperparameter/model selection. This is a form of test-set leakage that makes the reported test performance optimistically biased and invalidates the 'out-of-sample' framing.
- [Section 'Experiments'; Section 'Conclusion and Future Work'] The backtest assumes zero transaction costs, no slippage, and no liquidity constraints; the paper explicitly lists incorporating these as future work. For a system that rebalances according to daily router weights and switches among expert rules, these frictions are first-order rather than second-order. Without at least a sensitivity analysis covering conservative cost/slippage assumptions, the reported returns are not financially realizable and the outperformance claim cannot be interpreted as evidence for practical trading.
- [Table 2 and Ablation Studies] All performance numbers are single point estimates. No standard errors, confidence intervals, significance tests, or multiple random seeds are reported for MM-DREX or the RL baselines. Given the stochasticity of RL training and VLM inference, the claim that MM-DREX 'significantly outperforms' 15 baselines is unsupported by any inferential statistic. In addition, the expert strategies in Appendix A contain numerous hand-set thresholds and parameters, and no sensitivity analysis is provided to show that the reported advantage is robust to these choices.
minor comments (4)
- [Section 'Problem Formulation'] The discounted return G_t is written as an infinite sum with an unexplained index variable K; the finite-horizon POMDP would be clearer if the horizon and discounting were stated precisely.
- [Appendix E, first paragraph] The model name is spelled 'MMD-DREX' in the first sentence; should be 'MM-DREX'.
- [Figure 3 and Table 5] The crisis benchmark is described as 'S&P 500 index' in the text and table, but the dataset specification in Table 1 does not include an index asset; the relationship between the crisis-evaluation assets and the main dataset should be clarified.
- [Appendix A] The pseudo-code is useful but some algorithmic details are underspecified, e.g., 'recent breakout, MA divergence, pullback' and 'strong buy signals' are not formally defined. This limits reproducibility of the expert strategies.
Circularity Check
Partial validation-loop circularity: the router's input/output window is selected on a test-phase sample from the same dataset, then the same test split is reported as out-of-sample prediction; no equation-level or self-citation circularity elsewhere.
-
fitted input called prediction
[Appendix C ('Multimodal LLMs' Financial Forecasting Capabilities') and Experiments ('Dataset Construction','Implementation Details')]
"We randomly selected 37 assets as test phase dataset from our comprehensive dataset of 62 financial instruments... Based on these comprehensive results, we selected o3’s 100-day analytical period with 90-day forecasting horizon as the foundation for our supervised fine-tuning (SFT) training dataset. ... MM-DREX adopts this configuration as the standard window setting... the first 60% of data allocated for training, 20% for validation, and the remaining 20% reserved for testing."
The configuration (T_in=100, T_pred=90) is chosen by measuring directional accuracy on a 'test phase dataset' drawn from the same 62-asset corpus, and the paper then reports Table 4's directional accuracy (60.21%) on the reserved test split. The reported test accuracy is therefore not an independent prediction of the configuration's quality: it is the selection outcome, since the configuration was adopted because the test-phase evaluation gave ~60% accuracy. This closes the validation loop through the test data and makes the reported test-set metrics partially fitted to the evaluation set by construction.
full rationale
No equation-level derivation is circular: the trading experts are rule-based, the router is trained with SFT labels from GPT-o3 and PPO-style RL on training-period data, and the final portfolio is a weighted combination of expert outputs. The main circularity concern is the window-selection procedure in Appendix C, which uses a 'test phase dataset' from the same 62-asset dataset to choose T_in/T_pred before reporting results on the reserved 20% test split; this is a partial validation-loop leak rather than a full equivalence. It is not load-bearing self-citation: the only candidate (FinMem) is used as a baseline, not as a premise. The Buy-and-Hold baseline definition in Appendix D.4 (h=sign(P_{t+1}-P_t)) is internally inconsistent and a reproducibility/correctness risk, but that is a benchmark-implementation error, not a circular derivation. The zero-transaction-cost assumption is a stated limitation (Future Work), not circularity. Because the central trading-return comparisons still have independent content (train/test split, external baselines), the appropriate score is 4 rather than 6+.
Assumptions & free parameters
free parameters (13)
- MA Cross fast period =
5
- MA Cross slow period =
20
- MA Cross ATR multiplier =
1.5
- Momentum lookback =
10
- Momentum entry threshold =
0.02
- Turtle entry/exit periods =
20/10
- Bollinger std multiplier =
1.8
- RSI oversold/overbought =
35/65
- KDJ thresholds =
J 10/90, K 20/80
- Volume breakout multiplier =
1.5
- ATR breakout multipliers =
entry 1.5, exit 0.75, stop 1.2
- RL discount factor and clipping =
0.99 / 0.15
- Market regime label thresholds =
MA5/MA20, ADX=15, 50% day majority
assumptions (5)
- domain assumption Financial markets evolve as a Partially Observable Markov Decision Process (POMDP) with stationary transition and observation kernels.
- domain assumption Technical indicators (MA, MACD, RSI, KDJ, Bollinger, ATR) contain predictive information about future price movements.
- domain assumption The pre-trained VLM (Qwen2.5-VL-72B) provides reliable chart understanding and multimodal reasoning.
- domain assumption No transaction costs, slippage, or market impact.
- domain assumption The market regime labels produced by technical indicators plus three institutional traders are ground truth for SFT.
Cite this review
Pith. "Pith review of MM-DREX: Multimodal-Driven Dynamic Routing of LLM Experts for Financial Trading." pith.science (2026). https://pith.science/paper/5L2CUMQX
@misc{pith2026250905080,
  author       = {Pith},
  title        = {Pith review of: MM-DREX: Multimodal-Driven Dynamic Routing of LLM Experts for Financial Trading},
  year         = {2026},
  howpublished = {\url{https://pith.science/paper/5L2CUMQX}},
  note         = {Machine review of arXiv:2509.05080}
}
read the original abstract
The inherent non-stationarity of financial markets and the complexity of multi-modal information pose significant challenges to existing quantitative trading models. Traditional methods relying on fixed structures and unimodal data struggle to adapt to market regime shifts, while large language model (LLM)-driven solutions - despite their multi-modal comprehension - suffer from static strategies and homogeneous expert designs, lacking dynamic adjustment and fine-grained decision mechanisms. To address these limitations, we propose MM-DREX: a Multimodal-driven, Dynamically-Routed EXpert framework based on large language models. MM-DREX explicitly decouples market state perception from strategy execution to enable adaptive sequential decision-making in non-stationary environments. Specifically, it (1) introduces a vision-language model (VLM)-powered dynamic router that jointly analyzes candlestick chart patterns and long-term temporal features to allocate real-time expert weights; (2) designs four heterogeneous trading experts (trend, reversal, breakout, positioning) generating specialized fine-grained sub-strategies; and (3) proposes an SFT-RL hybrid training paradigm to synergistically optimize the router's market classification capability and experts' risk-adjusted decision-making. Extensive experiments on multi-modal datasets spanning stocks, futures, and cryptocurrencies demonstrate that MM-DREX significantly outperforms 15 baselines (including state-of-the-art financial LLMs and deep reinforcement learning models) across key metrics: total return, Sharpe ratio, and maximum drawdown, validating its robustness and generalization. Additionally, an interpretability module traces routing logic and expert behavior in real time, providing an audit trail for strategy transparency.
Figures


Figures from the paper (5 more)


Forward citations
Cited by 1 Pith paper
-
TradingMoE: Routing the Right Experts in Evolving Markets
A query-key router plus a sparse expert-selection-update mechanism lets a frozen LLM adapt its mixture-of-experts routing to trading context, beating 22 baselines in backtests.
Reference graph
Works this paper leans on
-
[1]
Moving Average State Relative order of MA10, 20, 100 “Bullish order” / “Bearish order” / “Mixed”
- [2]
-
[3]
V olatility Change ATR(14) vs. its past 14-day mean “Increasing volatility” / “Decreasing volatility” / “Stable volatility” Table 14: Market summary descriptions. Figure 7: Model Architecture Appendix F Experiment Supplementary Materials In this section, we provide additional experimental materials to supplement the main paper, including detailed input pr...
work page 2020
-
[191]
Technical Indicators: MA10/MA20, ADX/+DI/-DI, MACD, RSI, KDJ, Bollinger Bands, Volume
-
[202]
Chart Patterns: Candlestick patterns, support/resistance, trend signals
-
[213]
Price Prediction: 90-day target price, price range, key levels
-
[224]
Trend Assessment: 90-day trend evolution, risk factors 23 24Return JSON format: 25{{ 26"current_market_state": {{ 27"ma5_vs_ma20": "MA5 vs MA20 relationship (above/below/close)", 28"estimated_adx_strength": "ADX strength (strong/medium/weak)", 29"estimated_di_direction": "+DI vs -DI relationship", 30"current_trend_assessment": "Current trend (uptrend/down...
-
[281]
Trend consistency across different time periods
Show all 22 references
-
[292]
Technical patterns (e.g., head and shoulders, double bottom)
-
[303]
Support and resistance levels
-
[314]
Volume characteristics
-
[336]
Precise numerical values from the time series data
-
[347]
period": {period}, 39
Focus solely on technical indicators; Exclude fundamental analysis 35 36Please return in JSON format with the following fields: 37{{ 38"period": {period}, 39"current_closing_price": "closing price of the last candlestick", 40"predictions": {{ 41"1 day": {{ 42"predicted_price":...
-
[681]
Add return field showing percentage change from current_closing_price to predicted_price
-
[692]
Include current_closing_price from the last available candlestick
-
[703]
Return value should show 4 decimal places for prices and 2 decimal places for return (e.g ., 0.0523 for 5.23%)
-
[714]
Include confidence score (0-1) for each prediction
-
[725]
Provide detailed reasoning for each prediction that combines both visual chart patterns and numerical time series analysis
-
[736]
Maintain all original analysis dimensions
-
[747]
Uptrend" 12- Downtrend≥50% of next 90 days→
If time series data is provided, reference specific data points, trends, and numerical patterns in your analysis 75 76Please ensure the response is in valid JSON format with proper numeric formatting.""" Testing Results We conducted comprehensive evaluations across 12 state-of...
-
[2023]
Xiao, Y .; Sun, E.; Luo, D.; and Wang, W
BloombergGPT: A Large Language Model for Fi- nance.arXiv preprint arXiv:2303.17564. Xiao, Y .; Sun, E.; Luo, D.; and Wang, W. 2024. Tradin- gAgents: Multi-agents LLM financial trading framework. arXiv preprint arXiv:2412.20138. Xie, Q.; Han, W.; Zhang, X.; Lai, Y .; Peng, M.; ...
2024 arXiv
-
[2024]
overbought
FinMem: A Performance-Enhanced LLM Trading Agent with Layered Memory and Character Design.Pro- ceedings of the AAAI Spring Symposium on AI in FinTech. Zhang, W.; Zhao, L.; Xia, H.; Sun, S.; Qin, M.; and Li, X. 2024. A Multimodal Foundation Agent for Financial Trading: Tool-Aug...
2024
Reviewed August 5, 2026 · model on record in the stance chip above.
Discussion (0). Continue with ORCID to comment.