REVIEW 3 major objections 3 minor 50 references
The Dust in M31
T0 review · 3 major / 3 minor · reviewed 2026-08-14 · deepseek-v4-flash
Pith's one-line read Standard dust models overpredict M31 starlight absorption by at least a factor of 2.5.
desk verdict A careful measurement paper whose most novel claim—the R–beta anti-correlation—needs a synthetic joint-recovery test before it can be used as a dust-model constraint. read the letter →
The pith
A machine-rendered reading of the paper's core claim, the machinery that carries it, and where it could break.
The reading
What carries the argument
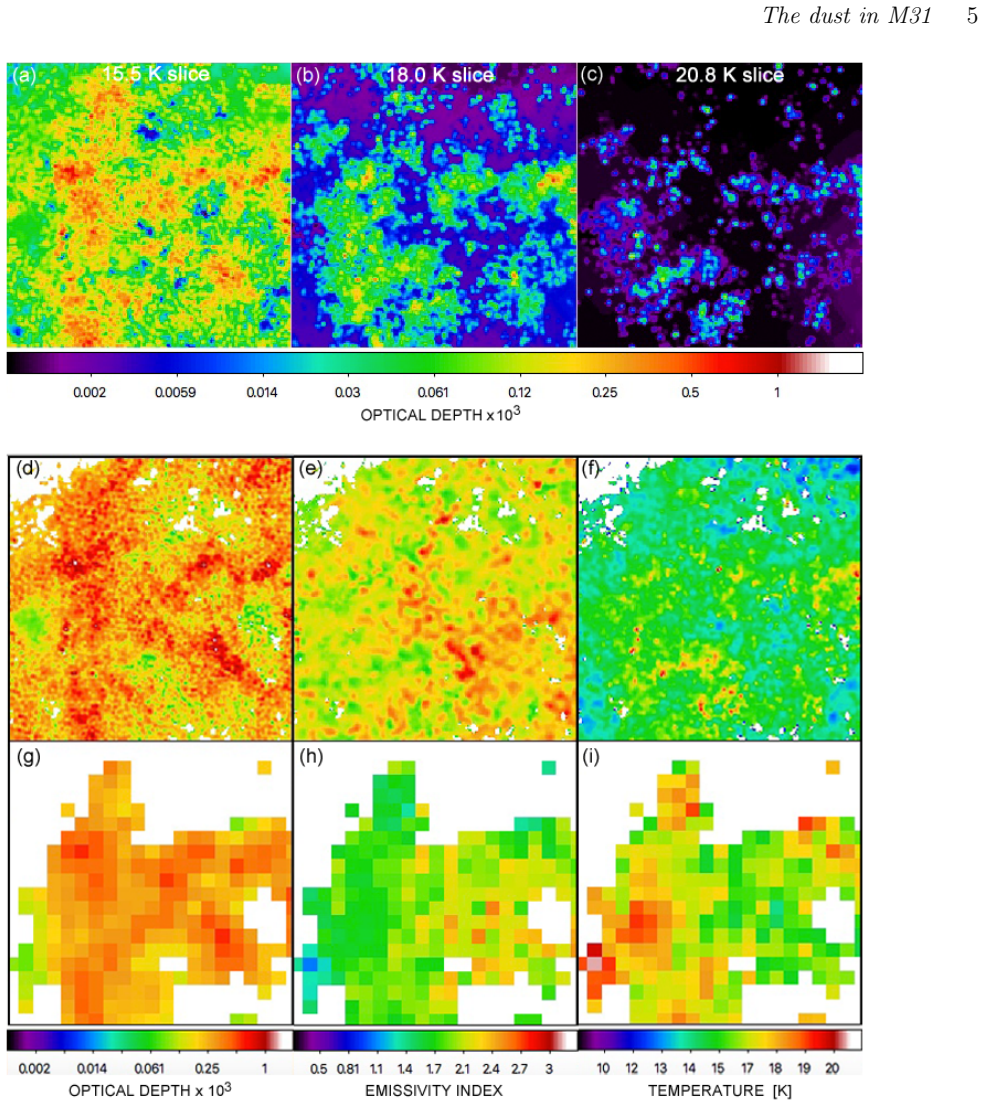
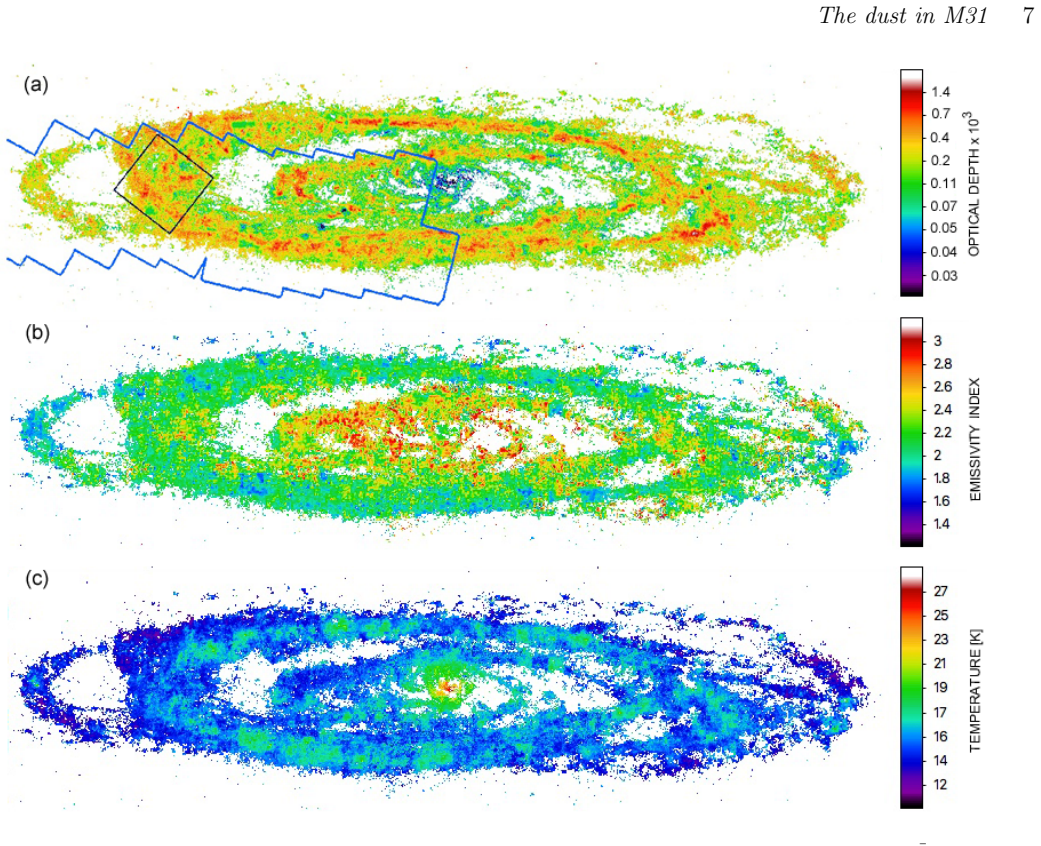
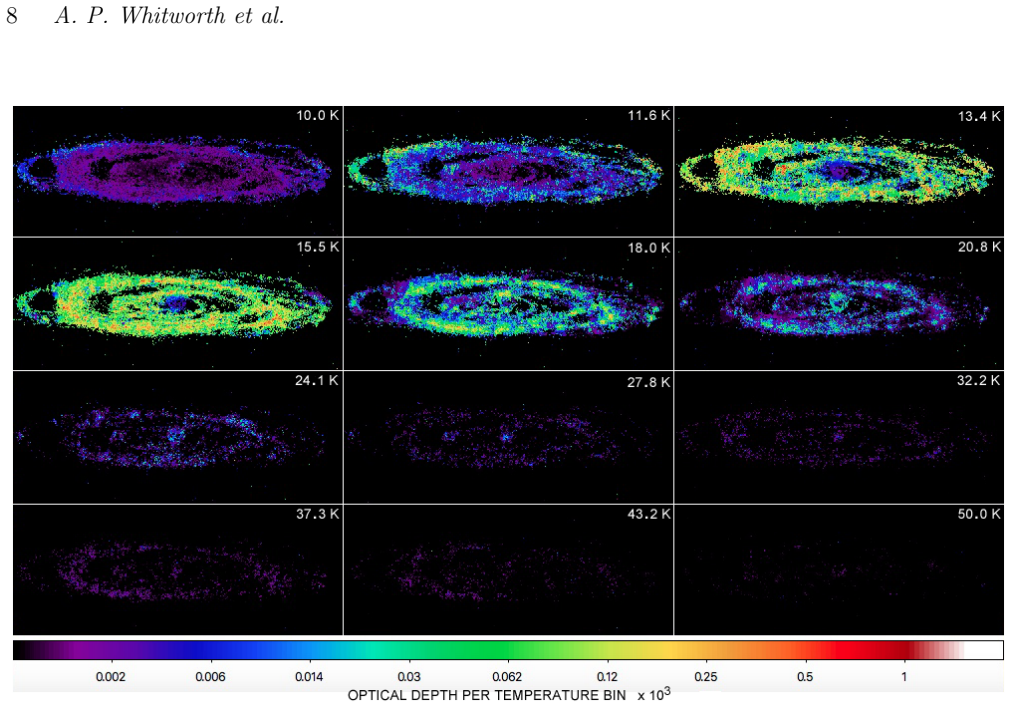
The load-bearing object is the ratio $R=\tau_{1.1}/\tau_{300}$, comparing a near-infrared extinction optical depth at 1.1 µm with a far-infrared emission optical depth at 300 µm on matched 31 pc pixels; its model counterpart is $R_{\rm model}=\kappa_{1.1}/\kappa_{300}$, computed from the dust opacity coefficients of candidate grain models. The comparison is made possible by the ppmap procedure, a Bayesian image-reconstruction method that separates the 300 µm optical depth into emissivity-index and temperature bins and yields the optical-depth-weighted mean emissivity index $\bar{\beta}$, and by a near-infrared extinction map from the reddening of red giant branch stars that provides $\tau_{1.1}$. Two analytic distributions carry the compact-source argument: a log-normal column-density PDF with a single power-law tail (Eq. 6.2) and a turbulent core mass function $dN/dm\propto m^{-7/3}$ (Eq. 6.5). The newly reported result is the linear relation $R_{\rm obs}\simeq 2042(\pm24)-557(\pm10)\bar{\beta}$ (Eq. 5.2).
What would settle it
Point a far-infrared interferometer or a few-pc-resolution sub-millimetre camera at one of M31's star-forming rings and measure how much of the 300 µm flux comes from compact, unresolved cores; if more than 60% of the emission is in sources that are too small to lie in front of the red giant branch stars, Explanation B is restored and the central claim collapses. Equivalently, a measurement of the column-density PDF at pc resolution showing a prominent power-law tail with $\alpha<1.5$ and $\varphi>0.5$ would also revive the compact-source explanation.
Extended reading notes
Core claim
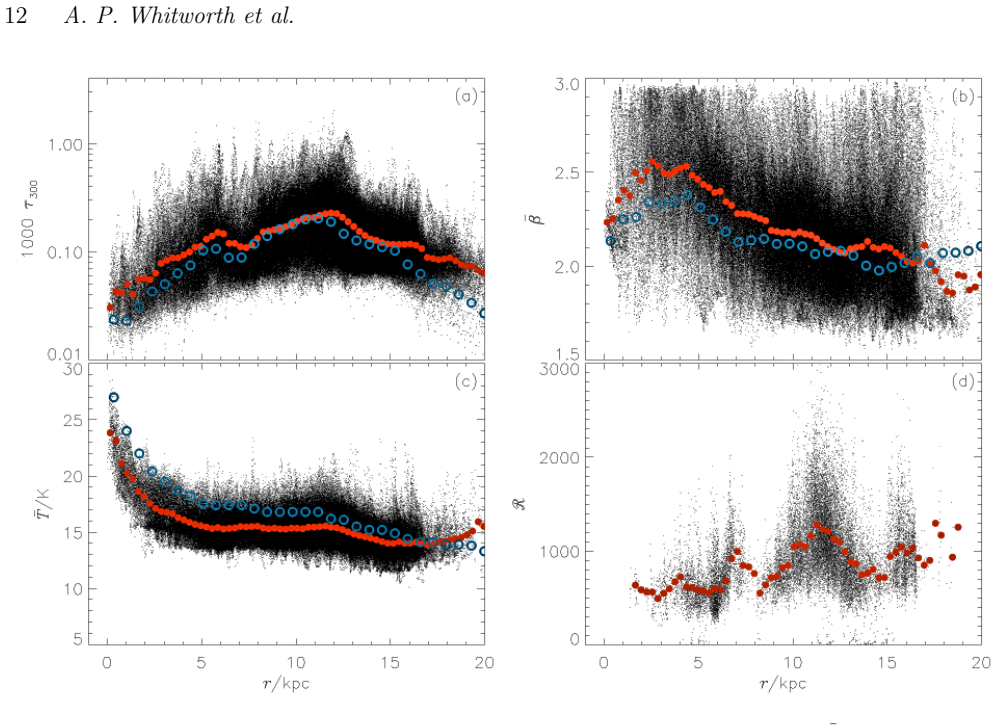
The central claim is that the dust in M31 absorbs and emits with an opacity ratio that is incompatible with the bulk of current theoretical dust models, and that the incompatibility is real rather than a measurement artifact. On the same 31 pc scale, $R_{\rm obs}\equiv\tau_{1.1}/\tau_{300}$ sits at 500–1500, whereas the model ratio $R_{\rm model}\equiv\kappa_{1.1}/\kappa_{300}$ is 2500–4000; only one observationally calibrated model comes close to the observed values. The paper finds that the far-infrared optical depth $\tau_{300}$ is consistent with an independent, completely different analysis, so Explanation A is unlikely; and it presents two analytic arguments—one based on the tail of the column-density probability distribution, one based on the turbulent core mass function—to show that hiding at least 60% of the 300 µm-emitting dust in compact sources is implausible. Consequently the real possibility is Explanation C: existing dust models need revision. In addition, the paper establishes an empirical anti-correlation between $R_{\rm obs}$ and the optical-depth-weighted mean emissivity index, Eq. (5.2), which any revised model would have to reproduce.
Load-bearing premise
The load-bearing premise is that the compact dust population in M31 can be described by a log-normal column-density PDF with a single power-law tail and by a turbulent core mass function $dN/dm\propto m^{-7/3}$; if the real compact dust has a different distribution, the conclusion that at least 60% of the far-infrared-emitting dust cannot hide in compact sources would not follow.
Editorial extensions
If this is right
- If the discrepancy is real, the far-infrared mass opacity $\kappa_{300}$ in standard dust models must be roughly a factor 2.5 higher (or $\kappa_{1.1}$ lower) to match M31, so dust masses derived from far-infrared fluxes of external galaxies would shrink correspondingly.
- Smaller far-infrared-derived dust masses would relax the requirement for extremely rapid dust formation in high-redshift galaxies.
- Revised dust models must explain both observed locations $(\bar{\beta},R_{\rm obs})\sim(2.0,\,1000)$ and $(2.5,\,500)$ in the ratio–emissivity plane; the second location is not covered by any commonly used model.
- The anti-correlation $R_{\rm obs}=2042(\pm24)-557(\pm10)\bar{\beta}$ provides a direct, quantitative test target for dust models, and the paper's single-size grain grid identifies a few minerals that populate the high-$\bar{\beta}$, low-$R$ end.
- The result extends the known dust energy balance problem to a galaxy-wide, resolved scale, pointing to a common origin in dust models.
Reading between the lines
- If confirmed, the anti-correlation could be used as an environmental probe: measuring $R_{\rm obs}$ in other nearby galaxies might trace where grain growth, destruction, or coagulation shifts the dust population along the $\bar{\beta}$–$R$ relation.
- The same pixel-scale comparison could be made inside the Milky Way with infrared extinction surveys and far-infrared emission maps; a similar low ratio would show that the model deficit is universal, while a higher ratio would single out M31's conditions.
- The compact-source rejection depends on two idealized distribution shapes; direct sub-arcsecond far-infrared imaging of an M31 star-forming ring is a concrete, decisive test of whether more than 60% of the 300 µm flux is confined to unresolved cores.
- One testable extension of Eq. (5.2) is to predict the ratio at other wavelengths, e.g. comparing $\tau_{1.1}$ with $\tau_{250}$ or $\tau_{500}$, which would tell whether the model shortfall is a special property of the 300 µm opacity or a general far-infrared error.
Signed reviews
Editorial analysis
A structured set of objections, weighed in public.
Referee Report
Summary. The paper applies the PPMAP Bayesian deconvolution procedure to Herschel PACS/SPIRE maps of M31 to derive maps of the 300-micron emission optical depth tau_300, the optical-depth-weighted mean emissivity index betabar, and the dust temperature Tbar at roughly 31 pc resolution. Combining tau_300 with the near-IR extinction optical depth tau_1.1 from Dalcanton et al. (2015), the authors measure the ratio R_obs = tau_1.1/tau_300 and find values in the range 500-1500, well below theoretical model values R_model = kappa_1.1/kappa_300 of roughly 2500-4000. They argue that Explanation A, namely that tau_300 is inaccurate, is unlikely because the PPMAP results agree with those of Draine et al. (2014), and they present two analytic arguments against Explanation B, namely that a large fraction of the emitting dust is hidden in compact sources. The paper therefore concludes that existing dust models may need revision. It also reports a new anti-correlation, R_obs = 2042 +/- 24 - (557 +/- 10) betabar (Eq. 5.2), which it presents as a challenging constraint on interstellar dust models.
Significance. If the central claims hold, the paper provides a valuable local-Universe constraint on dust emission models and contributes to the well-known dust energy balance problem. The empirical comparison is careful in several respects: tau_1.1 comes from an independent external analysis, tau_300 is cross-checked against the independent Draine et al. (2014) radial profiles, and a wide range of literature dust models is tabulated for comparison. The claimed R_obs-betabar anti-correlation, if real, would be a sharp new constraint on the mixing of dust populations in M31. However, the new anti-correlation is derived from PPMAP products on both axes and is not supported by a synthetic joint-recovery test, and the two arguments against compact dust sources rely on idealized functional forms. The central conclusion is therefore defensible but not yet fully secured.
major comments (3)
- [Section 5, Eq. (5.2)] The anti-correlation R_obs = 2042 - 557 betabar is computed from PPMAP-derived quantities on both axes: R_obs has tau_300 in the denominator, and betabar is a tau_300-weighted mean over the same 48 (beta,T) components. Any PPMAP reconstruction error that redistributes optical depth among beta bins will change tau_300 and betabar jointly, and the well-known beta-T degeneracy could plausibly produce a spurious slope of this sign. The paper quotes uncertainties on betabar (~0.1) and Tbar (~3%) from separate tests, but it does not show that the joint recovery of (tau_300, betabar) is unbiased, nor that an input model with no intrinsic R-beta anti-correlation would not recover a slope near -557. Because Eq. (5.2) is presented as the paper's new challenging constraint, this missing synthetic test is load-bearing and should be supplied.
- [Section 6.1, Eq. (6.2)] The argument that compact sources cannot hide at least 60% of the emitting dust depends on assuming a column-density PDF that is a boxcar log-normal plus a single power-law tail with parameters (sigma, phi, alpha). As written, Eq. (6.2) is internally inconsistent: eta = Sigma/tildeSigma is a positive-definite quantity, yet the boxcar extends to eta = -sigma. If eta is intended to be ln(Sigma/tildeSigma), the PDF and the ratios in Eqs. (6.3)-(6.4) need to be re-derived. More importantly, a different compact-source population—one whose clump mass function does not produce a simple power-law tail, or one with a different relation between column density and far-IR emission—would not be excluded by this argument, so Explanation B would remain viable.
- [Section 6.2, Eq. (6.5)] The second argument assumes the turbulent-core mass function dN/dm proportional to m^(-7/3) holds down to arbitrarily small masses and equates compact far-IR emitters with non-prestellar cores. The deduced limit m_MIN <~ 8e-7 solar masses (Eq. 6.10) follows from combining this mass function with a Milky Way high-mass star formation rate applied to M31. If the actual compact dust population is not described by this core mass function—for example, if it consists of unresolved clumps with a different mass spectrum—the claimed unlikelihood of Explanation B does not follow. The argument should be tied more directly to M31's observed core and star-formation properties, or its sensitivity to the assumed mass function should be demonstrated.
minor comments (3)
- [Section 4, text near Fig. 4] The text 'the map at beta2 = 2.0 K actually represents dust...' should read 'beta2 = 2.0' rather than '2.0 K', since K is a temperature unit and does not apply to the emissivity index.
- [Section 5, discussion of Fig. 7] The statement that 'the ppmap results are essentially model independent' is too strong; PPMAP still assumes optically thin emission, a discrete beta grid, and beta independent of T, as described in Section 3. The wording should be tempered to 'relatively free of the assumptions of the standard single-temperature fit.'
- [Figure 5 caption] The x-axis label in the caption reads 'beta, beta'; it should be a single symbol, presumably betabar, to avoid confusion with the beta values of the theoretical models.
Circularity Check
No significant circularity: the central ratio uses an independent near-IR extinction map, and Eq. 5.2 is an empirical fit rather than a construction from the model inputs.
full rationale
The paper's main claim compares tau_1.1 from Dalcanton et al. (2015) with tau_300 from PPMAP. tau_1.1 is an external, independent data product, and the PPMAP tau_300 map is cross-checked against the independent Draine et al. (2014) analysis. The theoretical R_model values are taken from published dust models (Table 2 and Appendix D), not derived in this paper. The anti-correlation R_obs = 2042 - 557 betabar (Eq. 5.2) is presented as a least-squares fit to the pixel data; it is not obtained by substituting the definition of betabar into R_obs, and no equation in the paper reduces R to betabar by construction. The PPMAP method is self-cited (Marsh et al. 2015, 2018), but the current paper does not rely on an unverified assertion from those papers: PPMAP is a separately published procedure and its output is compared with an independent algorithm. The lack of a synthetic joint-recovery test for R and betabar is a potential systematic-uncertainty concern, but it is not a logical circularity under the standards of this analysis.
Assumptions & free parameters
free parameters (5)
- PPMAP beta grid boundaries and spacing =
beta in [1.25, 3.25]; discrete values 1.5, 2.0, 2.5, 3.0
- PPMAP temperature grid boundaries and spacing =
T in [9.3 K, 53.8 K]; twelve log-spaced values 10.0 to 50.0 K
- PPMAP stopping criterion =
global reduced chi-squared just below 1.0
- Linear regression coefficients in Eq. 5.2 =
intercept 2042 +/- 24, slope -557 +/- 10
- 5-sigma detection threshold =
>5 sigma in each Herschel band and in tau_1.1
assumptions (7)
- domain assumption Far-IR dust emission is optically thin along the analyzed lines of sight
- domain assumption Dust far-IR opacity follows a power law with a single emissivity index beta per dust component, and beta is independent of temperature
- domain assumption tau_1.1 from Dalcanton et al. (2015) measures the total line-of-sight dust column, assuming a log-normal distribution of extinctions and a dust scale height much smaller than the RGB star scale height
- ad hoc to paper The column-density PDF is well approximated by a log-normal (replaced by a boxcar) plus a single power-law tail with parameters (sigma, phi, alpha)
- domain assumption The turbulent core mass function follows dN/dm proportional to m^{-7/3} and essentially all high-mass cores form high-mass stars
- domain assumption M31 distance is 0.78 Mpc
- domain assumption The conversion factors A_1.1 = 0.3266 A_V and A_1.6 = 0.2029 A_V hold for the RGB population
Cite this review
Pith. "Pith review of The Dust in M31." pith.science (2026). https://pith.science/paper/5NSSDFYK
@misc{pith2026190803458,
  author       = {Pith},
  title        = {Pith review of: The Dust in M31},
  year         = {2026},
  howpublished = {\url{https://pith.science/paper/5NSSDFYK}},
  note         = {Machine review of arXiv:1908.03458}
}
read the original abstract
We have analysed Herschel observations of M31, using the PPMAP procedure. The resolution of PPMAP images is sufficient (31 pc on M31) that we can analyse far-IR dust emission on the scale of Giant Molecular Clouds. By comparing PPMAP estimates of the far-IR emission optical depth at 300 microns (tau_300), and the near-IR extinction optical depth at 1.1 microns (tau_1.1) obtained from the reddening of RGB stars, we show that the ratio R_OBS.tau = tau_1.1/tau_300 falls in the range 500 to 1500. Such low values are incompatible with many commonly used theoretical dust models, which predict values of R_MODEL.kappa = kappa_1.1/kappa_300 (where kappa is the dust opacity coefficient) in the range 2500 to 4000. That is, unless a large fraction, at least 60%, of the dust emitting at 300 microns is in such compact sources that they are unlikely to intercept the lines of sight to a distributed population like RGB stars. This is not a new result: variants obtained using different observations and/or different wavelengths have already been reported by other studies. We present two analytic arguments for why it is unlikely that at least 60% of the emitting dust is in sufficiently compact sources. Therefore it may be necessary to explore the possibility that the discrepancy between observed values of R_OBS.tau and theoretical values of R_MODEL.kappa is due to limitations in existing dust models. PPMAP also allows us to derive optical-depth weighted mean values for the emissivity index, beta = - dln(kappa_lambda)/dln(lambda), and the dust temperature, T, denoted betabar and Tbar. We show that, in M31, R_OBS.tau is anti-correlated with betabar according to R_OBS.tau = 2042(+/-24)-557(+/-10)betabar. If confirmed, this provides a challenging constraint on the nature of interstellar dust in M31.
Figures
Figures from the paper (5 more)



Reference graph
Works this paper leans on
-
[1]
Clayton G. C., Gordon K. D., Bianchi L. C., Massa D. L., Fitzpatrick E. L., Bohlin R. C., Wolff M. J., 2015, , 815, 14
work page 2015
-
[2]
Dalcanton J. J. et al. , 2015, , 814, 3
work page 2015
-
[3]
Dorschner J., Begemann B., Henning T., Jaeger C., Mutschke H., 1995, , 300, 503
work page 1995
- [4]
-
[5]
Draine B. T. et al. , 2014, , 780, 172
work page 2014
- [6]
- [7]
-
[8]
Dunne L., Eales S., Ivison R., Morgan H., Edmunds M., 2003, , 424, 285
work page 2003
Show all 50 references
-
[9]
Fabian D., Henning T., J \"a ger C., Mutschke H., Dorschner J., Wehrhan O., 2001, , 378, 228
2001
-
[10]
Fritz J. et al. , 2012, , 546, A34
2012
-
[11]
Gordon K. D. et al. , 2014, , 797, 85
2014
-
[12]
Griffin M. J. et al. , 2010, , 518, L3
2010
-
[13]
Groves B. et al. , 2012, , 426, 892
2012
-
[14]
S., Brooke T
Hanner M. S., Brooke T. Y., Tokunaga A. T., 1998, , 502, 871
1998
-
[15]
Henning T., Begemann B., Mutschke H., Dorschner J., 1995, , 112, 143
1995
-
[16]
Henning T., Stognienko R., 1996, , 311, 291
1996
-
[17]
Jaeger C., Dorschner J., Mutschke H., Posch T., Henning T., 2003, , 408, 193
2003
-
[18]
J., Dorschner J., Henning T., Mutschke H., Waters L
Jaeger C., Molster F. J., Dorschner J., Henning T., Mutschke H., Waters L. B. F. M., 1998, , 339, 904
1998
-
[19]
Jaeger C., Mutschke H., Begemann B., Dorschner J., Henning T., 1994, , 292, 641
1994
-
[20]
P., 2012, , 540, A2
Jones A. P., 2012, , 540, A2
2012
-
[21]
P., Fanciullo L., K \"o hler M., Verstraete L., Guillet V., Bocchio M., Ysard N., 2013, , 558, A62
Jones A. P., Fanciullo L., K \"o hler M., Verstraete L., Guillet V., Bocchio M., Ysard N., 2013, , 558, A62
2013
-
[22]
Kirkpatrick A. et al. , 2014, , 789, 130
2014
-
[23]
K \"o hler M., Jones A., Ysard N., 2014, , 565, L9
2014
-
[24]
T., 1993, , 402, 441
Laor A., Draine B. T., 1993, , 402, 441
1993
-
[25]
Lewis A. R. et al. , 2015, , 805, 183
2015
-
[26]
T., 2001, , 554, 778
Li A., Draine B. T., 2001, , 554, 778
2001
-
[27]
A., Whitworth A
Marsh K. A., Whitworth A. P., Lomax O., 2015, , 454, 4282
2015
-
[28]
A., Whitworth A
Marsh K. A., Whitworth A. P., Smith M. W. L., Lomax O., Eales S. A., 2018, , 480, 3052
2018
-
[29]
S., 1990, , 28, 37
Mathis J. S., 1990, , 28, 37
1990
-
[30]
L., Edmunds M
Morgan H. L., Edmunds M. G., 2003, , 343, 427
2003
-
[31]
S., 1992, , 261, 567
Ossenkopf V., Henning T., Mathis J. S., 1992, , 261, 567
1992
-
[32]
Padoan P., Nordlund ., 2002, , 576, 870
2002
-
[33]
Pegourie B., 1988, , 194, 335
1988
-
[34]
Pilbratt G. L. et al. , 2010, , 518, L1
2010
-
[35]
, 2014, , 564, A45
Planck Collaboration et al. , 2014, , 564, A45
2014
-
[36]
, 2015, , 582, A28
Planck Collaboration et al. , 2015, , 582, A28
2015
-
[37]
, 2016, , 596, A109
Planck Collaboration et al. , 2016, , 596, A109
2016
-
[38]
Poglitsch A. et al. , 2010, , 518, L2
2010
-
[39]
Posch T., Kerschbaum F., Fabian D., Mutschke H., Dorschner J., Tamanai A., Henning T., 2003, , 149, 437
2003
-
[40]
M., Corsi C
Rich R. M., Corsi C. E., Cacciari C., Federici L., Fusi Pecci F., Djorgovski S. G., Freedman W. L., 2005, , 129, 2670
2005
-
[41]
M., Marsh K
Richardson J. M., Marsh K. A., 1991, in Maximum Entropy and Bayesian Methods, Smith C. R., Erickson G., Neudorfer P. O., eds., Springer, p. 213
1991
-
[42]
G., 1991, , 377, 526
Rouleau F., Martin P. G., 1991, , 377, 526
1991
-
[43]
Saftly W., Baes M., De Geyter G., Camps P., Renaud F., Guedes J., De Looze I., 2015, , 576, A31
2015
-
[44]
Schneider N. et al. , 2015 a , , 453, L41
2015
-
[45]
Schneider N. et al. , 2015 b , , 575, A79
2015
-
[46]
Smith M. W. L. et al. , 2012, , 756, 40
2012
-
[47]
Tabatabaei F. S. et al. , 2014, , 561, A95
2014
-
[48]
Williams B. F. et al. , 2014, , 215, 9
2014
-
[49]
G., Mennella V., Colangeli L., Bussoletti E., 1996, , 282, 1321
Zubko V. G., Mennella V., Colangeli L., Bussoletti E., 1996, , 282, 1321
1996
-
[50]
write newline
" write newline "" before.all 'output.state := FUNCTION fin.entry write newline FUNCTION new.block output.state before.all = 'skip after.block 'output.state := if FUNCTION new.sentence output.state after.block = 'skip output.state before.all = 'skip after.sentence 'output.stat...
Reviewed August 14, 2026 · model on record in the stance chip above.
Discussion (0). Continue with ORCID to comment.