REVIEW 4 major objections 6 minor 15 references
SN 2014C: a metamorphic supernova exploded in the intricate and hydrogen-rich surroundings
T0 review · 4 major / 6 minor · reviewed 2026-08-12 · deepseek-v4-flash
Pith's one-line read With daily-cadence observations from the first month, this paper shows that SN 2014C's light curve departs from pure radioactive decay about 20 days after explosion, requiring an early interaction with hydrogen-rich circumstellar material.
desk verdict New early-time data and a robust H-alpha identification, but the 20-day interaction timing is prior-driven and not uniquely established. read the letter →
The pith
A machine-rendered reading of the paper's core claim, the machinery that carries it, and where it could break.
The reading
What carries the argument
The central tool is the bolometric light curve built from template-subtracted UBVRI photometry and compared with the Arnett radioactive-decay model. The residual excess over that model is interpreted with an ejecta-CSM interaction model, termed the CSIRD model, which adds shock-powered luminosity to radioactive decay and includes a gamma-ray leakage factor. Markov chain Monte Carlo fitting yields the ejecta mass, nickel mass, CSM density, and interaction start time. The velocity evolution of the 6200 Å absorption works as the diagnostic that separates high-velocity H-alpha from photospheric Si II, and the colors and light-curve shape identify the onset of the extra energy source.
What would settle it
A direct test would fit a magnetar spin-down model, with the same explosion date and reddening, to the bolometric light curve; if it reproduces the excess at least as well as the CSM-interaction model, the early-interaction timing claim would not be uniquely supported. Alternatively, a sensitive X-ray or radio observation designed to detect the shock at day 20 would confirm or rule out ongoing interaction.
Extended reading notes
Core claim
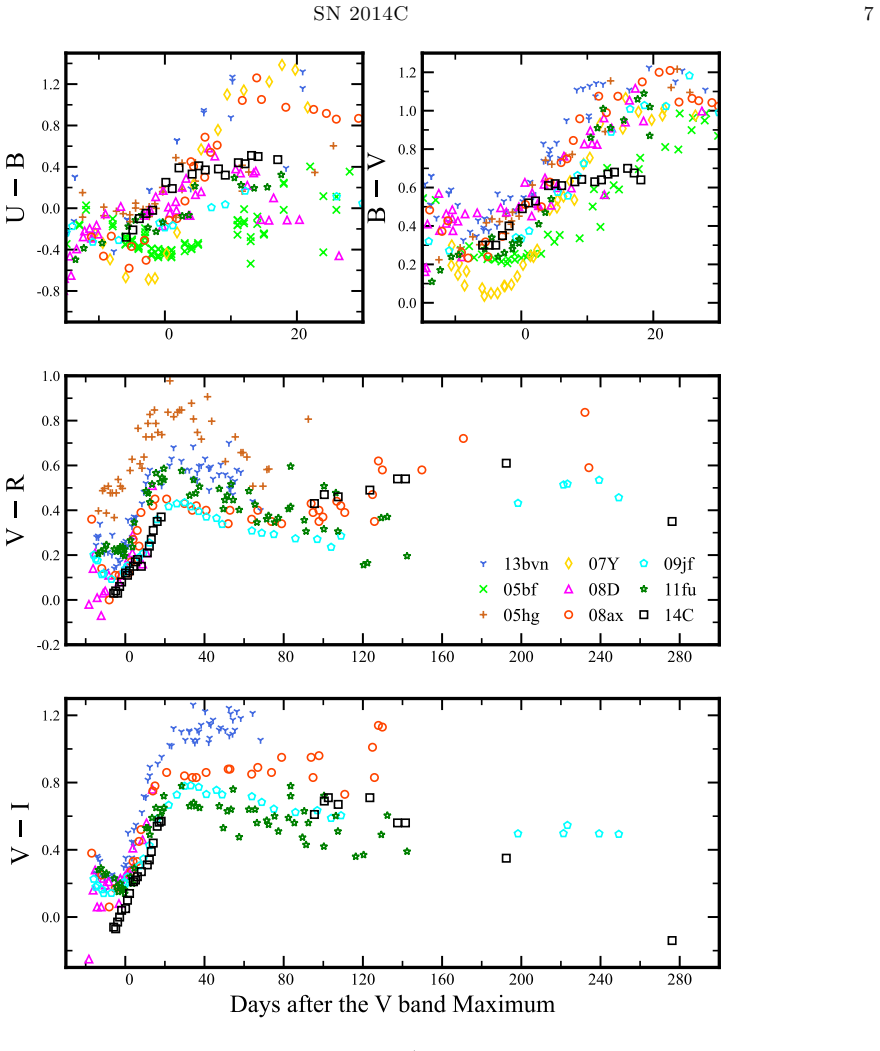
SN 2014C was a Type Ib supernova with an unusually high peak luminosity (about 4.3 × $10^{42}$ erg $s^{-1}$), a fast rise time near 11.6 days, and a slow decline compared with typical Type Ib events. The absorption feature near 6200 Å is high-velocity H-$\alpha$ in the outer ejecta, not Si II, as shown by its velocity evolution over the first 20 days; this means a small amount of hydrogen remained in the progenitor envelope. The bolometric light curve follows a radioactive-decay model with 0.14 solar masses of 56Ni for roughly the first 15 days, then shows an excess starting at about 20 days after explosion. A hybrid model combining radioactive decay and ejecta-CSM interaction fits the full light curve with an ejecta mass of about 2.2 solar masses and an interaction onset at about 19.9 days. The authors conclude that SN-CSM interaction began much earlier than the emergence of IIn-like nebular features, which are first seen near day 100.
Load-bearing premise
The load-bearing premise is that the light-curve excess beginning around 20 days is powered by ejecta hitting circumstellar material, rather than by an alternative energy source such as a magnetar; the authors note their model is only one possible explanation.
Editorial extensions
If this is right
- The peak-luminosity nickel mass of 0.14 solar masses is an upper limit: if part of the peak brightness comes from interaction, less 56Ni is needed.
- The inner edge of the dense hydrogen-rich shell lies at roughly 4 × 10^14 cm from the explosion, with denser material near 10^16 cm reached around day 100.
- The progenitor was not fully stripped: high-velocity H-alpha in the outer ejecta shows a small hydrogen envelope remained at explosion.
- The implied mass-loss rate of order 0.2 solar masses per year at 1000 km s^-1 points to an eruptive or binary mass-loss history rather than steady Wolf-Rayet or red-supergiant winds.
- The interaction already supplies extra light by day 20, so classifying SN 2014C as a pure Ib during its first months misses the engine that shapes its luminosity.
Reading between the lines
- An untested alternative is that a magnetar, rather than CSM interaction, powers the post-peak excess; fitting a magnetar spin-down model to the same bolometric light curve would settle whether the 20-day interaction onset is unique.
- Because the model assumes a spherical CSM, the inferred CSM mass and interaction time would shift if the shell is clumpy or torus-like, as some later observations suggest; testing with non-spherical geometry is a direct next step.
- The same analysis applied to other fast-rising Type Ib/c supernovae with dense early photometry could reveal that hidden early interaction is common, turning 'metamorphic' events into an extreme of a continuous population.
- A testable prediction is that sensitive X-ray and radio observations beginning near day 20 should catch the forward shock while it is still young; current non-detections only cover the first 20 days.
Editorial analysis
A structured set of objections, weighed in public.
Referee Report
Summary. The paper presents new high-cadence photometric and spectroscopic observations of SN 2014C covering the first month after explosion, with template-subtracted light curves and a dense spectral series. The authors classify it as a luminous, fast-rising Type Ib SN, argue that the ~6200 Å absorption is high-velocity Hα based on its velocity evolution, and derive M_Ni = 0.14 Msun from the peak bolometric luminosity using the Arnett relation. They show that this radioactive-decay model cannot reproduce the observed luminosity after τ ≈ 20 days, and they fit a combined radioactive-decay plus CSM-interaction (CSIRD) model that yields an interaction start time ti ≈ 20 days. They conclude that the SN-CSM interaction in SN 2014C likely begins much earlier than the emergence of IIn-like nebular Hα features at ~100 days, and they discuss the progenitor's complex H-rich surroundings.
Significance. The central photometric result—the divergence of the bolometric light curve from an Arnett model with M_Ni = 0.14 Msun after τ ≈ 20 days—is a robust, reddening-independent comparison because both the observed peak and the model scale with the adopted extinction and distance. The early-time spectral series is valuable, and the identification of the 6200 Å feature as high-velocity Hα using the evolution of its absorption velocity is convincing. The paper also provides a useful comparison of SN 2014C with other metamorphic SNe. If the early interaction timing is correct, it would significantly revise the picture of the CSM geometry around this famous object. However, the interpretation of the excess as CSM interaction is not uniquely established, and the paper itself concedes in Section 6 that the CSIRD model is 'only one possible explanation.' The manuscript is honest about its limitations, but the load-bearing timing claim needs additional support from model comparison and a non-circular treatment of the interaction-start prior.
major comments (4)
- [Section 5, Eq. (2) and preceding paragraph] The prior on the interaction start time is set as ti = 20 ± 5 days because 'the detection of interaction signals starting 20 days post-explosion indicates that the SN ejecta caught up with the H-rich CSM at that moment.' Since the same light-curve excess is what motivates the prior, the recovered ti = 19.9 d is not independent evidence for the timing. Refit the CSIRD model with a wide, uninformative prior on ti (e.g., uniform from 5 to 50 days) and report whether the posterior remains peaked near 20 days; also discuss the degeneracy between ti and the CSM density normalization.
- [Section 5, Fig. 14 and Section 6] The excess over the radioactive-decay model is attributed solely to ejecta-CSM interaction, but a magnetar spin-down model is not tested, even though the paper cites SN 2005bf as a possible magnetar-powered case. A magnetar with P ≈ 10–30 ms and B ≈ 10^14 G can produce a slowly declining excess after the radioactive peak, and the flat-to-blue colors at τ ≳ 20 days do not uniquely select CSM interaction. The manuscript itself concedes in Section 6 that the CSIRD model is 'only one possible explanation' and that interaction 'could have commenced earlier and intensified rapidly.' To support the abstract's timing claim, either fit a magnetar (or another alternative) model to the same bolometric light curve and show it is disfavored, or explicitly temper the claim to state that the excess requires an additional energy source whose origin is not uniquely determined.
- [Section 3.1 and Section 5] The explosion epoch is derived from fireball fitting as MJD 56658.91, but the paper notes that Margutti et al. (2017) estimated MJD 56656, roughly 3 days earlier. All phases τ are measured from the adopted explosion date, so the onset of the excess (τ ≈ 20 d) and the inferred CSM radius shift by up to ~3 days. The paper should propagate this uncertainty into the CSIRD fit, for example by treating the explosion epoch as a nuisance parameter with a prior spanning both estimates, and should state how ti and the resulting interaction radius change.
- [Section 5, Eq. (1) and Section 6] The 56Ni mass is first derived from the peak luminosity using Eq. (1) under the assumption that the peak is entirely radioactive, and then it is floated in the MCMC fit, which returns 0.14 ± 0.01 Msun. This posterior is essentially the input value and does not test the assumption. In Section 6 the authors state that the nickel mass derived from the peak 'may represent an upper limit,' but the CSIRD fit does not allow for a substantially lower M_Ni to compensate with CSM power at peak. Run the fit with a broader prior on M_Ni (e.g., 0.05–0.20 Msun) and report the marginalized posterior and its correlation with the CSM parameters.
minor comments (6)
- [Section 5, Eq. (1)] The formula for the nickel mass is typeset ambiguously; please write it explicitly as M_Ni = (L_max / 10^43 erg s^-1) / [6.45 exp(-t_r/τ_Ni) + 1.45 exp(-t_r/τ_Co)] in solar masses.
- [Section 5, Eq. (2)] The gamma-ray leakage factor A is introduced without derivation or reference. Please clarify what is new relative to the CSMRD model of Chatzopoulos et al. (2012, 2013) and state the units and convention for the deposition term (1 - exp(-A t^{-2})).
- [Section 5] The CSM mass is fixed to 1 Msun based on a range of literature values, but the text later notes that Orlando et al. (2024) infer 2.5 Msun. Please quantify how the inferred ti and CSM density normalization vary with the assumed M_CSM.
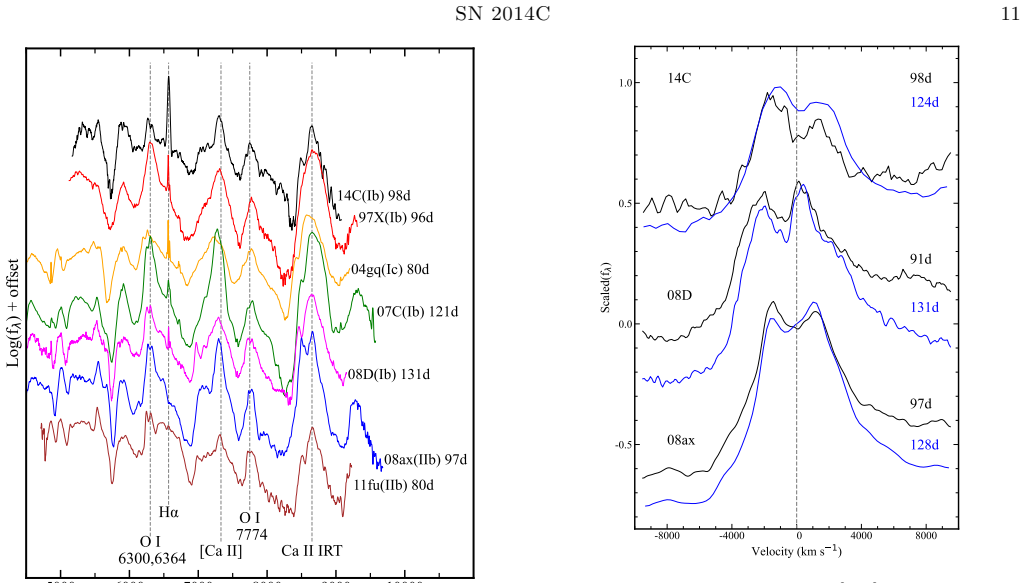
- [Figure 12 caption] The spectrum at t ≈ 1016 d is from Shivvers et al. (2019), not from this work; the caption should attribute it explicitly to avoid implying that it is a new observation from this paper.
- [Figure 14] The 'BB_cor' curve is not defined in the text or caption; please specify whether it is the integral of the blackbody fit and how it differs from the direct UBVRI integrated flux.
- [Table 1 and Table A5] The V-band rise time is listed as 11.47 d in Table 1 and the R-band rise time as 12.13 d in Table A5, while the text quotes t_rise ≈ 11.6 d for the bolometric rise; please reconcile these values or state which quantity each refers to.
Circularity Check
Early-interaction start time is prior-fed: ti=19.9 d is recovered from a prior set to 20±5 d using the same τ≳20 d light-curve excess the model is meant to explain.
-
fitted input called prediction
[Section 5 (Bolometric Light Curve and Modeling), paragraph after Eq. (2)]
"The detection of interaction signals starting 20 days post-explosion indicates that the SN ejecta caught up with the H-rich CSM at that moment. Hence, we set the prior on the initial time of interaction as ti = 20 ± 5 days."
The 'interaction signals starting 20 days post-explosion' are the same bolometric excess at τ ≳ 20 d relative to the radioactive-decay model that the CSIRD model is invoked to explain. Setting the MCMC prior for ti to 20 ± 5 d from this same excess ensures the recovered value will cluster near 20 d; the later quoted result ti = 19.9+3.34−3.25 d is therefore a restatement of the input prior, not an independent measurement. The abstract's new claim that SN–CSM interaction began about 20 d after explosion, earlier than the nebular Hα emergence, is thus supported by construction rather than by independent evidence.
full rationale
The central derivation chain has one genuine circular step. Section 5 identifies a bolometric excess at τ ≳ 20 d, declares it an 'interaction signal,' sets the CSIRD model prior to ti = 20 ± 5 d on that basis, and then reports a fitted ti = 19.9 d as support for early interaction. Because the prior is derived from the same excess the model is used to interpret, the recovered start time is not independent evidence for the abstract's headline claim that SN–CSM interaction began about 20 d after explosion. The paper is candid: in the Summary it concedes the combined model is 'only one possible explanation' and that interaction 'could have commenced earlier and intensified rapidly,' and it flags the 56Ni mass as an upper limit. That candor mitigates the circularity but does not remove it, because the ti result is still presented as a fitted constraint. Other parts of the paper are self-contained: the high-cadence photometry, template-subtracted light curves, the Hα versus Si ii discrimination via velocity evolution, and the nebular spectroscopy are independent observations. The magnetar alternative (SN 2005bf) is not modeled, but that is a model-degeneracy and correctness concern, not a circularity; it reinforces that the early-timing claim is not uniquely determined. No load-bearing self-citation or imported uniqueness theorem is present. Overall, there is partial circularity in the timing claim, while the bulk of the observational analysis stands independently.
Assumptions & free parameters
free parameters (7)
- Host-galaxy reddening E(B-V)host =
0.62 ± 0.10 mag; adopted total E(B-V) = 0.70 ± 0.10 mag
- Explosion epoch =
MJD 56658.91
- 56Ni mass =
0.14 ± 0.03 Msun
- Ejecta mass Mej =
2.22 (+0.69, -0.77) Msun
- CSM density normalization rho_CSM,0 =
1.81 (+1.57, -0.78) x 10^-14 g cm^-3
- Interaction start time t_i =
19.9 (+3.34, -3.25) d
- CSM interaction radiative efficiency =
0.2 (+0.3, -0.1)
assumptions (6)
- domain assumption The Arnett (1982) radioactive decay model is an appropriate baseline for the early bolometric light curve.
- domain assumption The CSM follows a steady stellar-wind density profile (rho ~ r^-2).
- ad hoc to paper The outer ejecta density is a power law with n=7 and transition radius x0=0.3.
- standard math The gamma-ray opacity of the ejecta is kappa_gamma = 0.027 cm2/g.
- domain assumption The bolometric luminosity can be recovered by black-body fitting to UBVRI photometry.
- domain assumption The SYN++ spectral synthesis code provides a reliable description of line formation for this SN.
Cite this review
Pith. "Pith review of SN 2014C: a metamorphic supernova exploded in the intricate and hydrogen-rich surroundings." pith.science (2026). https://pith.science/paper/5SO6X4TQ
@misc{pith2026241117008,
  author       = {Pith},
  title        = {Pith review of: SN 2014C: a metamorphic supernova exploded in the intricate and hydrogen-rich surroundings},
  year         = {2026},
  howpublished = {\url{https://pith.science/paper/5SO6X4TQ}},
  note         = {Machine review of arXiv:2411.17008}
}
abstract
We present photometric and spectroscopic observations of supernova (SN) 2014C, primarily emphasizing the initial month after the explosion at approximately daily intervals. During this time, it was classified as a Type Ib SN exhibiting a notably higher peak luminosity ($L_{\rm peak}\approx4.3\times10^{42}\rm erg\,s^{-1}$), a faster rise to brightness ($t_{\rm rise} \approx 11.6$ d), and a more gradual dimming ($\Delta m_{15}^{V} \approx 0.48$ mag) compared to typical SNe Ib. Analysis of the velocity evolution over the first $\sim$ 20 days after the explosion supports the view that the absorption near 6200\AA is due to high-velocity H$\alpha$ in the outer layers of the ejecta, indicating the presence of a small amount of hydrogen in the envelope of progenitor before the explosion. Assuming the peak luminosity is entirely attributed to radioactive decay, we estimate that 0.14 ${\rm M}_{\odot}$ of $^{56}$Ni was synthesized in the explosion. However, this amount of nickel could no longer maintain observed brightness approximately ten days after peak luminosity, suggesting additional energy sources beyond radioactive decay. This supplementary energy likely originates from interaction with the circumstellar medium (CSM). Consequently, the timing of the SN-CSM interaction in SN 2014C may occur much earlier than the emergence of IIn-like features during the nebular phase.
Figures


Figures from the paper (11 more)





Reference graph
Works this paper leans on
-
[1]
Anderson, G. E., Horesh, A., Mooley, K. P., et al. 2017, MNRAS, 466, 3648, doi: 10.1093/mnras/stw3310 Arnett, W. D. 1982, ApJ, 253, 785, doi: 10.1086/159681 Arnett, W. D., Bahcall, J. N., Kirshner, R. P., & Woosley, S. E. 1989, ARA&A, 27, 629, doi: 10.1146/annurev.aa.27.090189.003213 Astropy Collaboration, Robitaille, T. P., Tollerud, E. J., et al. 2013, ...
arXiv 2017
-
[2]
Bersten et al. (2014)
work page 2014
-
[3]
Fremling et al. (2014)
work page 2014
-
[4]
Folatelli et al. (2016)
work page 2016
-
[6]
Bianco et al. (2014)
work page 2014
-
[7]
Folatelli et al. (2006)
work page 2006
-
[9]
Stritzinger et al. (2018)
work page 2018
-
[10]
Stritzinger et al. (2009)
work page 2009
Show all 15 references
-
[11]
Mazzali et al. (2008)
2008
-
[12]
Modjaz et al. (2009)
2009
-
[13]
Valenti et al. (2011)
2011
-
[17]
Modjaz et al. (2014)
2014
-
[18]
Pastorello et al. (2008)
2008
-
[19]
Tsvetkov et al. (2009)
2009
-
[20]
(2024) T able A6.Reference of the SNe in Figure
Ferrari et al. (2024) T able A6.Reference of the SNe in Figure. 8 Star (a) pre-maximum (b) maximum (c) 7 d post maximum (d) 14 days post maximum iPTF13bvn Cao et al. (2013) Cao et al. (2013) ... Srivastav et al. (2014) SN 2004gq Modjaz et al. (2014) Modjaz et al. (2014) ... Mo...
2024
Reviewed August 12, 2026 · model on record in the stance chip above.
Discussion (0). Continue with ORCID to comment.