REVIEW 2 major objections 7 minor 1 cited by
Counting mass with Gaia: Mass Density of stars and stellar remnants in the solar neighborhood
T0 review · 2 major / 7 minor · reviewed 2026-08-06 · deepseek-v4-flash
Pith's one-line read A complete census of the 100-parsec sphere around the Sun puts the local mass density of stars and stellar remnants at $0.040^{+0.012}_{-0.006}\,M_\odot\,\mathrm{pc}^{-3}$ with the Kroupa IMF, and $0.037^{+0.012}_{-0.006}$ with the…
desk verdict A transparent, independent 100-parsec stellar mass density measurement that agrees with prior values; the unpropagated binary mass-ratio assumption is the main soft spot, but the result stands within errors. read the letter →
The pith
A machine-rendered reading of the paper's core claim, the machinery that carries it, and where it could break.
The reading
What carries the argument
The central object is the volume-corrected, binary-corrected stellar mass function built from the Gaia Catalogue of Nearby Stars. Per-star effective volumes weight each star by $V/V_{\mathrm{eff}}$, so that a magnitude-incomplete sample still yields a complete mass density; the ruwe-based binary flag adds the unseen companion mass; and a one-amplitude fit of the Kroupa or Chabrier IMF supplies the mass below $0.2\,M_\odot$ where the catalog is incomplete. The sum $\rho = (1/V)\sum_i M_i w_i$ with these weights carries the argument.
What would settle it
Use high-resolution astrometry or radial-velocity monitoring to measure the actual mass-ratio distribution of the roughly 24% of stars within 100 pc that are flagged as binaries by their ruwe value; if the average companion mass is not half the primary mass, the reported density shifts by roughly $0.0034\,M_\odot\,\mathrm{pc}^{-3}$ per unit change in the mean ratio, an offset comparable to the stated error. Alternatively, a complete census of stars below $0.2\,M_\odot$ in the 100 pc sphere would test the IMF-amplitude extrapolation that adds $0.0089$ or $0.0058\,M_\odot\,\mathrm{pc}^{-3}$.
Extended reading notes
Core claim
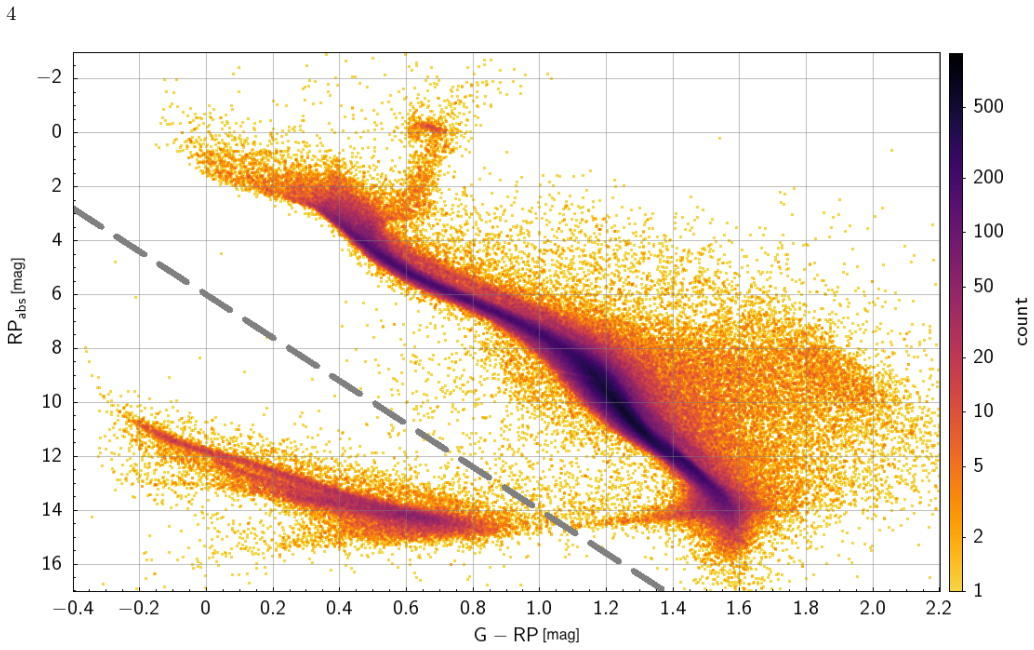
Using 302,449 stars from the Gaia Catalogue of Nearby Stars within 100 pc, the authors construct the observed stellar mass function by assigning individual masses from empirical mass-magnitude and mass-stellar-parameter relations. They correct for the finite Gaia magnitude window with per-star effective volumes, add the mass of unresolved binary companions flagged by ruwe (assuming companion mass equals half the primary mass, contributing $0.0034 \pm 0.0003\,M_\odot\,\mathrm{pc}^{-3}$), and extrapolate the mass below $0.2\,M_\odot$ by fitting the amplitude of the Kroupa and Chabrier initial mass functions. Adding the white-dwarf density of $0.00269\,M_\odot\,\mathrm{pc}^{-3}$ from a 40 pc sample and a neutron-star contribution below $0.001\,M_\odot\,\mathrm{pc}^{-3}$, they obtain the total $\rho_{100}$ values. They stress that the result is independent of any Galactic disk model and can be renormalized to a midplane density using any chosen vertical profile.
Load-bearing premise
The load-bearing premise is that every unresolved binary companion has exactly half the primary star's mass, and the uncertainty of that assumption is not propagated into the quoted errors.
Editorial extensions
If this is right
- The local baryonic density is now anchored observationally at $\rho_{100} = 0.040^{+0.012}_{-0.006}\,M_\odot\,\mathrm{pc}^{-3}$ (Kroupa) or $0.037^{+0.012}_{-0.006}\,M_\odot\,\mathrm{pc}^{-3}$ (Chabrier), independent of any assumed disk model.
- When a vertical density profile is assumed for comparison, the same $\rho_{100}$ converts to a midplane density of $0.041^{+0.012}_{-0.006}\,M_\odot\,\mathrm{pc}^{-3}$ with a sech$^2$ profile or $0.045^{+0.015}_{-0.007}\,M_\odot\,\mathrm{pc}^{-3}$ with an exponential profile (Kroupa IMF).
- The stellar budget decomposes as $0.025^{+0.012}_{-0.006}\,M_\odot\,\mathrm{pc}^{-3}$ for stars above $0.2\,M_\odot$, $0.0034 \pm 0.0003$ for unresolved binaries, $0.0089 \pm 0.0001$ (Kroupa) or $0.0058 \pm 0.0001$ (Chabrier) for the faint tail, $0.00269 \pm 0.00009$ for white dwarfs, and less than $0.001$ for neutron stars and black holes.
- Dynamical estimates of the local dark matter density can use this value directly as the baryonic input, replacing model-dependent disk assumptions in the subtraction of baryonic mass from the total dynamical mass.
Reading between the lines
- Editorial inference: the binary correction is the softest step; if future astrometric or spectroscopic surveys measure the mass-ratio distribution of ruwe-selected binaries and find a mean other than 0.5, the reported density would move by roughly $0.0034\,M_\odot\,\mathrm{pc}^{-3}$ per unit change in the mean ratio, an offset comparable to the stated error.
- Editorial inference: the paper's "model-free" claim applies to the integrated density $\rho_{100}$; the split at $0.2\,M_\odot$ and the IMF extrapolation below it do assume a particular IMF shape, so a future complete census of the faintest stars could revise the Kroupa versus Chabrier difference.
- Editorial inference: a practical consequence is for dark matter direct-detection experiments, whose expected event rates depend on the local dark matter density; combining this baryonic anchor with dynamical local-density measurements would sharpen that input.
- Editorial inference: the same volume-weighting recipe applied to future deeper infrared surveys could extend the method to a larger sphere or into the brown-dwarf regime, where the present catalog is incomplete.
Editorial analysis
A structured set of objections, weighed in public.
Referee Report
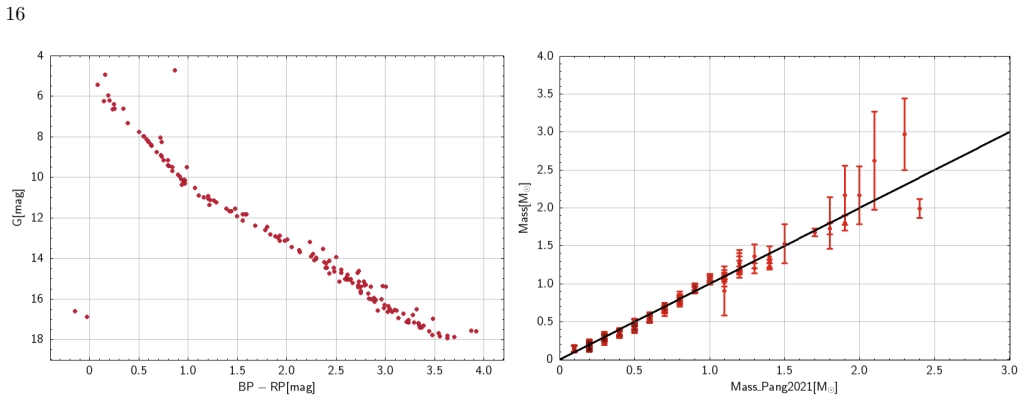
Summary. The paper estimates the local mass density of stars and stellar remnants inside a Sun-centered 100 pc sphere using the Gaia Catalogue of Nearby Stars (GCNS), supplemented by white-dwarf (O'Brien et al. 2023) and pulsar/neutron-star (Xie et al. 2024) literature data. Individual stellar masses are derived from empirical mass-magnitude relations (Giovinazzi & Blake 2022, with Kirkpatrick et al. 2024 as a cross-check) and from the Moya et al. (2018) relation between mass and stellar parameters; these are cross-validated against FLAME masses and Coma Berenices isochrone masses. Corrections are applied for volume incompleteness, unresolved binary companions, and the low-mass end of the stellar mass function, the last via fitted Kroupa and Chabrier IMFs. The central results are rho_100 = 0.040 (+0.012/-0.006) M_sun pc^-3 for the Kroupa IMF and rho_100 = 0.037 (+0.012/-0.006) M_sun pc^-3 for the Chabrier IMF, with conversions to midplane densities for two disk vertical profiles.
Significance. If the central value is correct, this is a competitive, largely observation-anchored determination of the baryonic mass density in the local 100 pc volume, useful for dynamical dark-matter inferences and for comparing with pre-Gaia values such as McKee et al. (2015). The paper is transparent and well cross-checked: the mass estimates are validated against FLAME and the K24 mass-magnitude relation with total-mass differences below 1%, and the Coma Berenices open-cluster comparison provides an independent isochrone-based test. The volume-completeness treatment is logical, and the authors are explicit about the main assumptions. The main gap is that two of the three largest corrections, the unresolved-binary term and the low-mass IMF extrapolation, carry systematic uncertainties that are discussed but not propagated into the quoted error bars; these terms together contribute roughly 0.012-0.014 M_sun pc^-3, i.e., about a third of the total, so the error budget is not yet complete.
major comments (2)
- [4.2, 5.2] The binary correction is the least secure component of the budget, and its systematic uncertainty is not propagated. The paper assumes q = 0.5 for every unresolved binary flagged by the ruwe threshold, adds 0.0034 ± 0.0003 M_sun pc^-3, and in Sect. 4.2 explicitly notes that the mass-ratio distribution is debated (flat vs. power-law, field vs. cluster). The quoted ±0.0003 is only the Monte Carlo scatter from mass and volume errors, not the uncertainty in q or in the binary identification itself. Because this term is ~8% of rho_100, the central value needs a quantitative sensitivity test. I ask the authors to recompute the correction with alternative mass-ratio distributions (e.g., flat, and q^gamma with gamma = 0.3-0.5) and with a perturbed binary fraction (e.g., ±30% or the range spanned by other ruwe-based estimates), and to add a corresponding systematic term to the error budget or quote the central value as a range. In addition, the ruwe proxy produces both false positives and missed short-period or equal-mass systems, and the mass derived from the blended light of an unresolved binary is not the primary-star mass used in the correction; these effects are not all bias-free, and their direction should be discussed.
- [4.3, 5.3] The low-mass correction is a fitted extrapolation, not a pure external constraint: the IMF amplitude is fitted to the observed, volume- and binary-corrected mass function above 0.2 M_sun and then the same IMF is integrated below 0.2 M_sun. The shape is external, so the procedure is not fully circular, but the stated uncertainty ±0.0001 M_sun pc^-3 is only the amplitude-fit statistical error. It does not include the IMF shape uncertainty, and the difference between the Kroupa and Chabrier results, 0.0089 vs. 0.0058 M_sun pc^-3 (0.0031 M_sun pc^-3, about 8% of rho_100), shows that shape uncertainty is comparable in size to the binary correction. I request a sensitivity analysis that repeats the integration for different fitting ranges (e.g., lower mass limits of 0.25 and 0.30 M_sun) and, ideally, an alternative anchored mass function such as the K24 empirical one; this would support the quoted error bars.
minor comments (7)
- [5.1] The sentence 'The mass of stars with RPabs > 4 is estimated as explained in Sect. 3.1, and for stars with RPabs < 4, the mass is derived in Sect. 3.1' should refer to Sect. 3.2 for the RPabs < 4 branch.
- [4.2, 5.6] Please correct the typos 'per say' to 'per se' and 'Haydes' to 'Hyades'.
- [3.2] In the sentence about deriving masses for stars without FLAME data, 'the stats without FLAME mass' should read 'the stars without FLAME mass'.
- [3.1, Eq. (3)] The notation 'phot rp mean f luxover error' is unclear; it should be 'phot_rp_mean_flux_over_error', and the standard deviation should be written as sigma = (2.5/ln 10) * (flux_error / mean_flux).
- [5.4] The statement that Arnaud & Rothenflug (1981) estimated the pulsar lifetime as 9 x 10^6 years looks inconsistent with typical pulsar ages; please verify the timescale or clarify what quantity is meant.
- [Abstract, 7] The word 'model-free' overstates the role of the IMF-based low-mass correction and the binary assumption; I suggest 'not requiring a global Galactic disk model' or 'largely data-anchored'.
- [Fig. 7] Please state the units of the ordinate in the caption of Fig. 7 (number per pc^3 per 0.01 M_sun bin, or mass density per bin), since the current axis label is ambiguous.
Circularity Check
No significant circularity: the central rho_100 is a direct volume-weighted census sum with external mass calibrations, and the IMF-based low-mass correction is a disclosed extrapolation anchored to complete data rather than a fit to its own output.
full rationale
The central derivation is not circular. The mass density of stars with m > 0.2 M_sun (0.025+0.012/-0.006 M_sun pc^-3) is computed directly from the GCNS census through Eq. (7), a volume-weighted sum of individual masses, where the individual masses come from external empirical relations (G22, K24, M18) cross-validated against each other and against FLAME masses with differences below 1% (Sects. 3.1-3.2, Appendix C). The closest candidate for circularity is the low-mass correction of Sects. 4.3 and 5.3, where the K01/C05 IMF amplitude is fitted to the observed mass function and then integrated from 0 to 0.2 M_sun to add 0.0089 or 0.0058 M_sun pc^-3. This is a calibrated extrapolation rather than a self-referential reduction: the fitted amplitude is anchored to the complete m > 0.2 M_sun portion of the data ('both functions agree well with our data for stars with mass m > 0.2M_sun'), the sub-0.2 M_sun shape is an external input from Kroupa (2001) and Chabrier (2005), and the m > 0.2 M_sun density is summed from the data rather than replaced by the IMF. No equation makes the predicted sub-0.2 M_sun density equal to the fitted input by construction, so the fitted-input-called-prediction pattern does not apply. The binary correction (q = 0.5 companion mass, Sect. 4.2) is an unpropagated modeling assumption affecting roughly 8% of the total; that is a systematic-uncertainty concern, not circularity, and likewise the 'model-free' label overstates the role of the adopted IMF shapes. The only self-citation is Vieira et al. (2023), shared by four of the five present authors, used in Sect. 5.5 to convert rho_100 into an example midplane value rho_0 through their sech^2 scale heights and thick-to-thin ratio; this conversion is explicitly illustrative and is not load-bearing for the central rho_100 result, and the cited parameters are themselves fits to external Gaia data. The paper is self-contained against external benchmarks: its masses reproduce the Coma Berenices isochrone masses (Appendix C), its mass function agrees with K24 above 0.2 M_sun (Fig. 9), and rho_100 is consistent with McKee et al. (2015), Bovy (2017), and Everall et al. (2022). Finding: no significant circularity.
Assumptions & free parameters
free parameters (5)
- Kroupa IMF amplitude k =
0.0140 ± 0.0001
- Chabrier IMF amplitude A =
0.093 ± 0.006
- Binary mass ratio q =
0.5
- Average WD mass for 27 stars without estimates =
0.6 Msun
- Pulsar average mass =
1.4 Msun
assumptions (6)
- domain assumption The GCNS is complete for G < 20.48 and has low contamination after the random forest cleaning.
- domain assumption Each star's weight w = V/V_eff correctly accounts for the finite volume in which it could have been observed.
- domain assumption For long-lived low-mass stars, the initial mass function is similar to the present-day mass function.
- domain assumption The white dwarf density derived from a 40-pc sphere (O'Brien et al. 2023) is representative of the 100-pc sphere.
- domain assumption Pulsars follow a sech^2 vertical distribution with scale height 0.28 kpc, and the star formation history of Snaith et al. (2015) is used to scale this to all neutron stars.
- domain assumption No interstellar extinction correction is needed for stars within 100 pc.
Cite this review
Pith. "Pith review of Counting mass with Gaia: Mass Density of stars and stellar remnants in the solar neighborhood." pith.science (2026). https://pith.science/paper/5VQ5EJRR
@misc{pith2026250706052,
  author       = {Pith},
  title        = {Pith review of: Counting mass with Gaia: Mass Density of stars and stellar remnants in the solar neighborhood},
  year         = {2026},
  howpublished = {\url{https://pith.science/paper/5VQ5EJRR}},
  note         = {Machine review of arXiv:2507.06052}
}
abstract
In the light of new full-sky surveys, many attempts of creating a consistent Galactic model were made. The main interest is to estimate the still poorly understood dark matter content. However, the results vary depending on methodology, assumptions, and baryonic distribution used. To understand this discrepancy, we take the first step by estimating the model-free local mass density of stars and stellar remnants. We use a complete sample from the Gaia Catalogue of Nearby Stars within 100 pc from the Sun, together with the data on the sample of the White Dwarfs and the recent estimate of the Neutron Stars concentration in the solar neighborhood. After correction for unresolved binary stars and accounting for missing low-mass stars, we find the local mass density of stars and stellar remnants in the solar neighborhood is $\rho_{100} = 0.040^{+0.012} _{ -0.006}M_\odot pc^{-3}$ with Kroupa IMF, and $\rho_{100} = 0.037^{+0.012}_{ -0.006}M_\odot pc^{-3}$ with Chabrier IMF.
Figures


Figures from the paper (8 more)


Forward citations
Cited by 1 Pith paper
-
An interstellar mission to the closest black hole?
If a black hole lies within about 20 light-years, a laser-propelled nanocraft could reach it in roughly a century and test Einstein's theory and event horizons.
Reference graph
Works this paper leans on
-
[1]
adobe:ns:meta/
thebibliography [1] 20pt to REFERENCES 6pt =0pt -12pt 10pt plus 3pt =0pt =0pt =1pt plus 1pt =0pt =0pt -12pt =13pt plus 1pt =20pt =13pt plus 1pt \@M =10000 =-1.0em =0pt =0pt 0pt =0pt =1.0em @enumiv\@empty 10000 10000 `\.\@m \@noitemerr \@latex@warning Empty `thebibliography' environment \@ifnextchar \@reference \@latexerr Missing key on reference command E...
2021
- [2]
-
[3]
2020, Monthly Notices of the Royal Astronomical Society, 496, 1922, 10.1093/mnras/staa1522
Belokurov, V., Penoyre, Z., Oh, S., et al. 2020, Monthly Notices of the Royal Astronomical Society, 496, 1922, 10.1093/mnras/staa1522
-
[4]
2017, , 470, 1360, 10.1093/mnras/stx1277
Bovy , J. 2017, , 470, 1360, 10.1093/mnras/stx1277
-
[5]
Castro-Ginard, Alfred , Penoyre, Zephyr , Casey, Andrew R. , et al. 2024, , 688, A1, 10.1051/0004-6361/202450172
-
[6]
2005, The Initial Mass Function 50 Years Later, 41
Chabrier, G. 2005, The Initial Mass Function 50 Years Later, 41
work page 2005
-
[7]
Clark, C. A., van Belle, G. T., Horch, E. P., et al. 2024, The Astronomical Journal, 167, 56, 10.3847/1538-3881/ad0bfd
-
[8]
Creevey, O. L. , Sordo, R. , Pailler, F. , et al. 2023, A&A, 674, A26, 10.1051/0004-6361/202243688
Show all 45 references
-
[9]
F., Malhan , K., Freese , K., Hattori , K., & Valluri , M
de Salas , P. F., Malhan , K., Freese , K., Hattori , K., & Valluri , M. 2019, , 2019, 037, 10.1088/1475-7516/2019/10/037
2019 doi
-
[10]
, Anders, F
Donada, J. , Anders, F. , Jordi, C. , et al. 2023, A&A, 675, A89, 10.1051/0004-6361/202245219
2023 doi
-
[11]
2013, , 51, 269, 10.1146/annurev-astro-081710-102602
Duch \^e ne , G., & Kraus , A. 2013, , 51, 269, 10.1146/annurev-astro-081710-102602
2013 doi
-
[12]
W., Boubert, D., & Grand, R
Everall, A., Belokurov, V., Evans, N. W., Boubert, D., & Grand, R. J. J. 2022, Monthly Notices of the Royal Astronomical Society, 511, 3863, 10.1093/mnras/stac305
2022 doi
-
[13]
2006, , 372, 1149, 10.1111/j.1365-2966.2006.10911.x
Flynn , C., Holmberg , J., Portinari , L., Fuchs , B., & Jahrei , H. 2006, , 372, 1149, 10.1111/j.1365-2966.2006.10911.x
2006
-
[14]
L., Sarro , L
Gaia Collaboration , Smart , R. L., Sarro , L. M., et al. 2021 a , , 649, A6, 10.1051/0004-6361/202039498
2021 doi
-
[15]
Gaia Collaboration , Brown, A. G. A. , Vallenari, A. , et al. 2021 b , A&A, 649, A1, 10.1051/0004-6361/202039657
2021 doi
-
[16]
, Romero-Gómez, M
Gaia Collaboration , Drimmel, R. , Romero-Gómez, M. , et al. 2023, A&A, 674, A37, 10.1051/0004-6361/202243797
2023 doi
-
[17]
A., Li, J
Ge, Q. A., Li, J. J., Hao, C. J., et al. 2024, The Astronomical Journal, 168, 25, 10.3847/1538-3881/ad5201
2024 doi
-
[18]
R., & Blake, C
Giovinazzi, M. R., & Blake, C. H. 2022, The Astronomical Journal, 164, 164, 10.3847/1538-3881/ac8cf7
2022 doi
-
[19]
Kapteyn , J. C. 1922, , 55, 302, 10.1086/142670
1922 doi
-
[20]
D., Marocco, F., Gelino, C
Kirkpatrick, J. D., Marocco, F., Gelino, C. R., et al. 2024, The Astrophysical Journal Supplement Series, 271, 55, 10.3847/1538-4365/ad24e2
2024 doi
-
[21]
, Kaczmarek, T
Korntreff, C. , Kaczmarek, T. , & Pfalzner, S. 2012, A&A, 543, A126, 10.1051/0004-6361/201118019
2012 doi
-
[22]
D., & Randall , L
Kramer , E. D., & Randall , L. 2016, , 829, 126, 10.3847/0004-637X/829/2/126
2016 doi
-
[23]
2001, , 322, 231, 10.1046/j.1365-8711.2001.04022.x
Kroupa , P. 2001, , 322, 231, 10.1046/j.1365-8711.2001.04022.x
2001
-
[24]
W., Dupuy, T., Kraus, A
Mann, A. W., Dupuy, T., Kraus, A. L., et al. 2019, The Astrophysical Journal, 871, 63, 10.3847/1538-4357/aaf3bc
2019 doi
-
[25]
F., Parravano , A., & Hollenbach , D
McKee , C. F., Parravano , A., & Hollenbach , D. J. 2015, , 814, 13, 10.1088/0004-637X/814/1/13
2015 doi
-
[26]
McMillan, P. J. 2011, Monthly Notices of the Royal Astronomical Society, 414, 2446, 10.1111/j.1365-2966.2011.18564.x
2011
-
[28]
McMillan , P. J. 2017, , 465, 76, 10.1093/mnras/stw2759
2017 doi
-
[29]
J., & Davies, G
Moya, A., Zuccarino, F., Chaplin, W. J., & Davies, G. R. 2018, The Astrophysical Journal Supplement Series, 237, 21, 10.3847/1538-4365/aacdae
2018 doi
-
[30]
W., Tremblay, P.-E., Klein, B
O’Brien, M. W., Tremblay, P.-E., Klein, B. L., et al. 2023, Monthly Notices of the Royal Astronomical Society, 527, 8687, 10.1093/mnras/stad3773
2023 doi
-
[31]
2021, The Astrophysical Journal, 912, 162, 10.3847/1538-4357/abeaac
Pang, X., Li, Y., Yu, Z., et al. 2021, The Astrophysical Journal, 912, 162, 10.3847/1538-4357/abeaac
2021 doi
-
[32]
Penoyre, Z., Belokurov, V., & Evans, N. W. 2022, Monthly Notices of the Royal Astronomical Society, 513, 5270, 10.1093/mnras/stac1147
2022 doi
-
[33]
, Drimmel, R
Poggio, E. , Drimmel, R. , Cantat-Gaudin, T. , et al. 2021, A&A, 651, A104, 10.1051/0004-6361/202140687
2021 doi
-
[34]
Read , J. I. 2014, Journal of Physics G Nuclear Physics, 41, 063101, 10.1088/0954-3899/41/6/063101
2014 doi
-
[35]
Reggiani , M., & Meyer , M. R. 2013, , 553, A124, 10.1051/0004-6361/201321631
2013 doi
-
[36]
, Ripamonti, E
Sartore, N. , Ripamonti, E. , Treves, A. , & Turolla, R. 2010, A&A, 510, A23, 10.1051/0004-6361/200912222
2010 doi
-
[37]
R., & Wu , C.-L
Schutz , K., Lin , T., Safdi , B. R., & Wu , C.-L. 2018, , 121, 081101, 10.1103/PhysRevLett.121.081101
2018 doi
-
[38]
I., Silverwood, H., et al
Sivertsson, S., Read, J. I., Silverwood, H., et al. 2022, Monthly Notices of the Royal Astronomical Society, 511, 1977, 10.1093/mnras/stac094
2022 doi
-
[39]
, Haywood, M
Snaith, O. , Haywood, M. , Di Matteo, P. , et al. 2015, A&A, 578, A87, 10.1051/0004-6361/201424281
2015 doi
-
[40]
Taylor , M. B. 2005, in Astronomical Society of the Pacific Conference Series, Vol. 347, Astronomical Data Analysis Software and Systems XIV, ed. P. Shopbell , M. Britton , & R. Ebert , 29
2005
-
[41]
2023, Galaxies, 11, 77, 10.3390/galaxies11030077
Vieira , K., Korchagin , V., Carraro , G., & Lutsenko , A. 2023, Galaxies, 11, 77, 10.3390/galaxies11030077
2023 doi
-
[42]
E., et al
Virtanen, P., Gommers, R., Oliphant, T. E., et al. 2020, Nature Methods, 17, 261, 10.1038/s41592-019-0686-2
2020 doi
-
[43]
Wallace, A. L. 2023, Monthly Notices of the Royal Astronomical Society, 527, 8718, 10.1093/mnras/stad3789
2023 doi
-
[44]
2019, , 623, A30, 10.1051/0004-6361/201834718
Widmark , A. 2019, , 623, A30, 10.1051/0004-6361/201834718
2019 doi
-
[45]
F., & Monari , G
Widmark , A., de Salas , P. F., & Monari , G. 2021, , 646, A67, 10.1051/0004-6361/202039852
2021 doi
-
[46]
T., Wang, J
Xie, J. T., Wang, J. B., Wang, N., Manchester, R., & Hobbs, G. 2024, The Astrophysical Journal Letters, 963, L39, 10.3847/2041-8213/ad2850
2024 doi
Reviewed August 6, 2026 · model on record in the stance chip above.
Discussion (0). Continue with ORCID to comment.