Trajectory-Integrated Accessibility Analysis of Public Electric Vehicle Charging Stations
Pith reviewed 2026-05-22 14:12 UTC · model grok-4.3
The pith
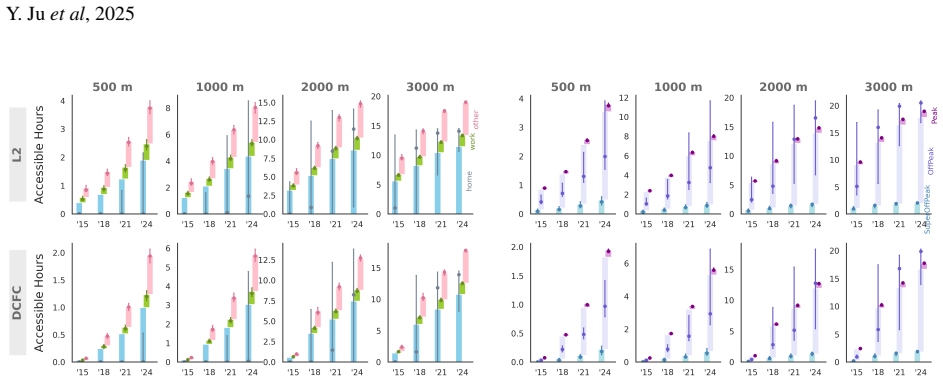
Bay Area residents have on average 7.5 hours daily when their locations fall within 1 km of a public Level 2 EV charger.
A machine-rendered reading of the paper's core claim, the machinery that carries it, and where it could break.
Core claim
The central claim is that integrating full individual trajectories with charger locations produces a more accurate accessibility measure than residential-only methods; under the June 2024 network, Bay Area residents experience 7.5 hours and 5.2 hours per day of proximity to public L2 and DCFC ports respectively, with access rising over ten years but marked by Gini indices of 0.38 (L2) and 0.44 (DCFC) across tracts and additional racial differences tied to mobility.
What carries the argument
The Trajectory-Integrated Public EVCS Accessibility (TI-acs) metric, which accumulates time intervals when an individual's recorded stay points lie within 1 km walking distance of a public charging port.
If this is right
- The metric captures charging opportunities that occur near workplaces and during grid off-peak hours rather than only at residences.
- Accessibility has grown steadily over the past decade as both the EV fleet and charger network expanded.
- Spatial inequality remains high, quantified by Gini coefficients of 0.38 for Level 2 and 0.44 for DC fast chargers across census tracts.
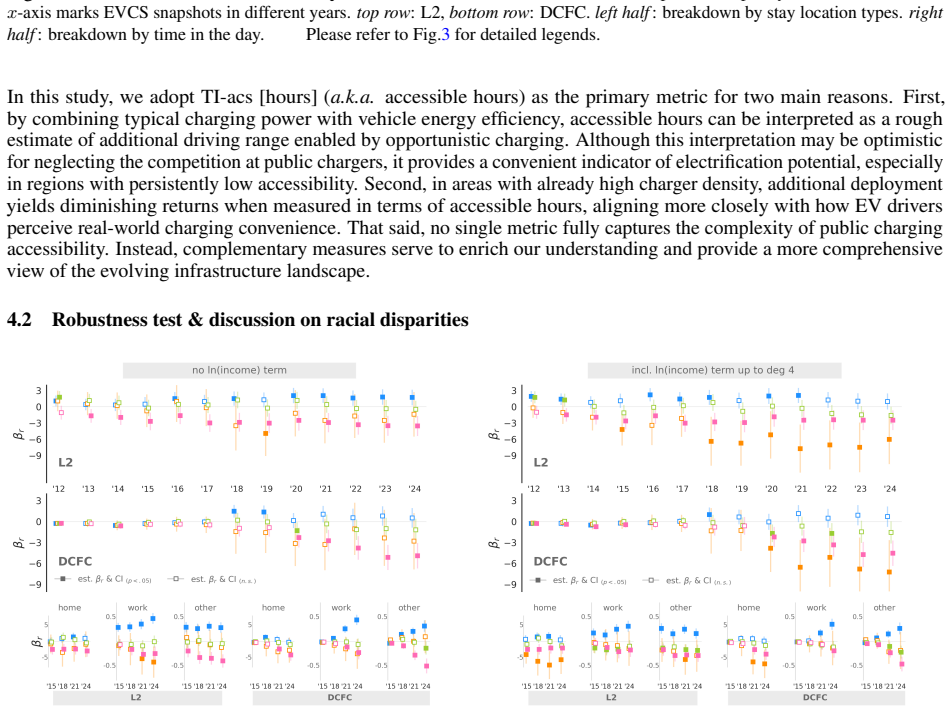
- Racial differences in access stem from both uneven charger density near homes and systematic differences in daily travel routes.
Where Pith is reading between the lines
- City planners could prioritize charger siting along high-volume corridors that currently show low TI-acs values.
- The same trajectory-integration method could be applied in other large metro areas that possess comparable mobile-device or GPS datasets.
- Equity policies might need to address mobility-pattern differences in addition to simply adding chargers in residential zones.
- Future versions of the metric could incorporate real-time charger occupancy or pricing to refine the effective access window.
Load-bearing premise
The one-week trajectory sample from the data providers represents typical long-term movement patterns for the entire six-million-resident population.
What would settle it
Re-running the calculation on a second independent week of trajectory data or on a larger resident sample and obtaining average daily access times differing by more than roughly one hour would undermine the reported averages.
Figures




read the original abstract
Electric vehicle (EV) charging infrastructure is crucial for advancing EV adoption, managing charging loads, and ensuring equitable transportation electrification. However, there remains a notable gap in comprehensive accessibility metrics that integrate the mobility of the users. This study introduces a novel accessibility metric, termed Trajectory-Integrated Public EVCS Accessibility (TI-acs), and uses it to assess public electric vehicle charging station (EVCS) accessibility for approximately 6 million residents in the San Francisco Bay Area based on detailed individual trajectory data in one week. Unlike conventional home-based metrics, TI-acs incorporates the accessibility of EVCS along individuals' travel trajectories, bringing insights on more public charging contexts, including public charging near workplaces and charging during grid off-peak periods. As of June 2024, given the current public EVCS network, Bay Area residents have, on average, 7.5 hours and 5.2 hours of access per day during which their stay locations are within 1 km (i.e. 10-12 min walking) of a public L2 and DCFC charging port, respectively. Over the past decade, TI-acs has steadily increased from the rapid expansion of the EV market and charging infrastructure. However, spatial disparities remain significant, as reflected in Gini indices of 0.38 (L2) and 0.44 (DCFC) across census tracts. Additionally, our analysis reveals racial disparities in TI-acs, driven not only by variations in charging infrastructure near residential areas but also by differences in their mobility patterns.
Editorial analysis
A structured set of objections, weighed in public.
Referee Report
Summary. The manuscript introduces the Trajectory-Integrated Public EVCS Accessibility (TI-acs) metric, which integrates individual travel trajectories with public EV charging station locations to measure accessibility beyond static home-based approaches. Applied to the San Francisco Bay Area using one week of detailed individual trajectory data, the study reports average daily access of 7.5 hours to Level 2 chargers and 5.2 hours to DC fast chargers within a 1 km threshold as of June 2024. It further documents steady increases in TI-acs over the past decade, spatial disparities via Gini indices of 0.38 (L2) and 0.44 (DCFC) across census tracts, and racial disparities driven by both infrastructure distribution and mobility patterns.
Significance. If the trajectory sample proves representative of Bay Area mobility patterns, the TI-acs metric offers a meaningful advance by capturing dynamic charging opportunities along daily paths and during off-peak periods, which static metrics miss. The reported quantitative averages, temporal trends, and disparity analyses could usefully inform infrastructure planning and equity assessments. The use of real trajectory data and the explicit contrast with home-based metrics are clear strengths.
major comments (2)
- [Abstract and Results] Abstract and Results section: The central claims of 7.5 hours (L2) and 5.2 hours (DCFC) average daily access for the full ~6 million residents are derived from one week of individual trajectory data. The manuscript provides no information on sample size, demographic or geographic representativeness, or validation against census mobility surveys, which directly undermines the population-level extrapolation.
- [Methods and Results] Methods and Results: The 1 km accessibility threshold is treated as given without sensitivity analysis or justification tied to actual walking behavior data; because the headline averages and Gini coefficients depend on this choice, the robustness of both the access-time and disparity findings requires explicit testing.
minor comments (2)
- [Methods] The mathematical definition of the TI-acs metric would be clearer if presented with an explicit equation or pseudocode in the Methods section rather than only in prose.
- [Figures] Figure captions and axis labels should explicitly state the time window (one week in June 2024) and the exact distance threshold used for all reported statistics.
Simulated Author's Rebuttal
We thank the referee for their constructive and detailed comments on our manuscript. We address each major comment below and describe the revisions we plan to incorporate.
read point-by-point responses
-
Referee: [Abstract and Results] Abstract and Results section: The central claims of 7.5 hours (L2) and 5.2 hours (DCFC) average daily access for the full ~6 million residents are derived from one week of individual trajectory data. The manuscript provides no information on sample size, demographic or geographic representativeness, or validation against census mobility surveys, which directly undermines the population-level extrapolation.
Authors: We acknowledge that the current version of the manuscript does not include explicit details on the trajectory dataset's sample size, demographic or geographic representativeness, or direct validation against census mobility surveys. In the revised manuscript, we will add a new subsection in the Methods section that reports the number of individuals and trajectories in the one-week sample, describes the data provider and collection method, discusses coverage across Bay Area counties and demographic groups, and includes any available comparisons to census or travel survey benchmarks. This addition will better support the population-level claims while remaining faithful to the data actually used. revision: yes
-
Referee: [Methods and Results] Methods and Results: The 1 km accessibility threshold is treated as given without sensitivity analysis or justification tied to actual walking behavior data; because the headline averages and Gini coefficients depend on this choice, the robustness of both the access-time and disparity findings requires explicit testing.
Authors: We agree that the robustness of the headline results would be strengthened by explicit sensitivity testing. In the revised manuscript, we will add a sensitivity analysis subsection that recomputes the average access times and Gini coefficients for alternative thresholds (500 m and 1.5 km) and report how the key findings change. We will also expand the justification for the 1 km choice by referencing empirical studies on acceptable walking distances to public amenities, while retaining the parenthetical note on approximate walking time already present in the abstract. revision: yes
Circularity Check
No significant circularity; analysis is direct computation from external inputs
full rationale
The paper introduces the TI-acs metric as an explicit integration of time spent within 1 km of EVCS locations along observed trajectories, then computes population-level averages directly from one week of external trajectory data and June 2024 EVCS locations. No equations or steps reduce to self-definition, fitted parameters renamed as predictions, or load-bearing self-citations; the reported 7.5 h / 5.2 h figures and Gini indices are straightforward aggregates of the input data rather than outputs forced by the method itself. The derivation chain remains self-contained against the supplied mobility traces and infrastructure records.
Axiom & Free-Parameter Ledger
free parameters (1)
- 1 km accessibility threshold
axioms (1)
- domain assumption Individual trajectory data accurately represents the mobility patterns of the 6 million residents.
invented entities (1)
-
TI-acs metric
no independent evidence
Forward citations
Cited by 1 Pith paper
-
Scalable Optimization for Mobility-Aware Coordinated Electric Vehicle Charging in Distribution Power Networks
MAC is a scalable ADMM-based optimization framework that couples EV charging over mobility horizons to minimize distribution network overload risks, showing major reductions in upgrade needs for a 30% EV Bay Area scenario.
Reference graph
Works this paper leans on
-
[1]
Charging up America: Assessing the growing need for US charging infrastructure through 2030
Gordon Bauer et al. “Charging up America: Assessing the growing need for US charging infrastructure through 2030”. In: White Paper ICCT (2021)
work page 2030
-
[2]
E Bibra et al. “Electric vehicle outlook 2022”. In: IEA. 2022
work page 2022
-
[3]
Modeling and Analyzing Urban Networks and Amenities with OSMnx
Geoff Boeing. “Modeling and Analyzing Urban Networks and Amenities with OSMnx”. In: (2024)
work page 2024
-
[4]
Inequitable access to distributed energy resources due to grid infrastructure limits in California
Anna M Brockway, Jennifer Conde, and Duncan Callaway. “Inequitable access to distributed energy resources due to grid infrastructure limits in California”. In: Nature Energy 6.9 (2021), pp. 892–903
work page 2021
-
[5]
Census Tracts and Block Numbering Areas
U.S. Census Bureau. “Census Tracts and Block Numbering Areas”. In:Geographic Areas Reference Manual. U.S. Census Bureau, 1994. Chap. 10
work page 1994
-
[6]
California Air Resources Board. Advanced Clean Cars II. https://ww2.arb.ca.gov/our-work/programs/ advanced-clean-cars-program/advanced-clean-cars-ii . Accessed: September 2024
work page 2024
-
[7]
California Air Resources Board clean vehicle rebate project
California Center for Sustainable Energy. California Air Resources Board clean vehicle rebate project. https: //cleanvehiclerebate.org/en/rebate-map. Accessed: June 2024
work page 2024
-
[8]
Electric Vehicle Chargers in California
California Energy Commission. Electric Vehicle Chargers in California. https://www.energy.ca.gov/ data - reports / energy - almanac / zero - emission - vehicle - and - infrastructure - statistics - collection/electric. Accessed: September 2024
work page 2024
-
[9]
California Energy Commission. New ZEV Sales in California . https : / / www . energy . ca . gov / data - reports / energy - almanac / zero - emission - vehicle - and - infrastructure - statistics - collection/new-zev. Accessed: September 2024
work page 2024
-
[10]
California State Geoportal. California Zip Codes . https : / / gis . data . ca . gov / datasets / CDEGIS :: california-zip-codes. Accessed: June 2024
work page 2024
-
[11]
Electric vehicle charging equity and accessibility: A comprehensive United States policy analysis
Gregory J Carlton and Selima Sultana. “Electric vehicle charging equity and accessibility: A comprehensive United States policy analysis”. In: Transportation Research Part D: Transport and Environment129 (2024), p. 104123
work page 2024
-
[12]
Salma Elmallah, Anna M Brockway, and Duncan Callaway. “Can distribution grid infrastructure accommodate residential electrification and electric vehicle adoption in Northern California?” In: Environmental Research: Infrastructure and Sustainability 2.4 (2022), p. 045005
work page 2022
-
[13]
Arsalan Esmaili et al. “Assessing the spatial distributions of public electric vehicle charging stations with emphasis on equity considerations in King County, Washington”. In:Sustainable Cities and Society 107 (2024), p. 105409
work page 2024
-
[14]
Electric vehicle charging network in Europe: An accessibility and deployment trends analysis
Giacomo Falchetta and Michel Noussan. “Electric vehicle charging network in Europe: An accessibility and deployment trends analysis”. In: Transportation Research Part D: Transport and Environment 94 (2021), p. 102813
work page 2021
-
[15]
Understanding the opportunity-centric accessibility for public charging infrastructure
Hossein Gazmeh, Yuntao Guo, and Xinwu Qian. “Understanding the opportunity-centric accessibility for public charging infrastructure”. In: Transportation Research Part D: Transport and Environment131 (2024), p. 104222. 15 Y . Juet al, 2025
work page 2024
-
[16]
Exploring network structure, dynamics, and function using NetworkX
Aric Hagberg, Pieter J Swart, and Daniel A Schult. Exploring network structure, dynamics, and function using NetworkX. Tech. rep. Los Alamos National Laboratory (LANL), Los Alamos, NM (United States), 2008
work page 2008
-
[17]
Public electric vehicle charger access disparities across race and income in California
Chih-Wei Hsu and Kevin Fingerman. “Public electric vehicle charger access disparities across race and income in California”. In: Transport Policy100 (2021), pp. 59–67
work page 2021
-
[18]
International Energy Agency. Global EV Outlook 2024 . https://www.iea.org/reports/global- ev- outlook-2024. IEA, Paris. Licence: CC BY 4.0. International Energy Agency, 2024
work page 2024
-
[19]
The TimeGeo modeling framework for urban mobility without travel surveys
Shan Jiang et al. “The TimeGeo modeling framework for urban mobility without travel surveys”. In:Proceedings of the National Academy of Sciences 113.37 (2016), E5370–E5378
work page 2016
-
[20]
Junfeng Jiao, Seung Jun Choi, and Chris Nguyen. “Toward an equitable transportation electrification plan: Measuring public electric vehicle charging station access disparities in Austin, Texas”. In:Plos one 19.9 (2024), e0309302
work page 2024
-
[21]
Inequitable access to EV charging infrastructure
Hafiz Anwar Ullah Khan et al. “Inequitable access to EV charging infrastructure”. In:The Electricity Journal 35.3 (2022), p. 107096
work page 2022
-
[22]
Eleftheria Kontou et al. “Understanding the linkage between electric vehicle charging network coverage and charging opportunity using GPS travel data”. In:Transportation Research Part C: Emerging Technologies98 (2019), pp. 1–13
work page 2019
-
[23]
Catherine Ledna et al. “How to support EV adoption: Tradeoffs between charging infrastructure investments and vehicle subsidies in California”. In: Energy Policy 165 (2022), p. 112931
work page 2022
-
[24]
Jae Hyun Lee, Scott J Hardman, and Gil Tal. “Who is buying electric vehicles in California? Characterising early adopter heterogeneity and forecasting market diffusion”. In: Energy Research & Social Science 55 (2019), pp. 218–226
work page 2019
-
[25]
Effects of expanding electric vehicle charging stations in California on the housing market
Jing Liang et al. “Effects of expanding electric vehicle charging stations in California on the housing market”. In: Nature Sustainability 6.5 (2023), pp. 549–558
work page 2023
-
[26]
Jiehong Lou et al. “Income and racial disparity in household publicly available electric vehicle infrastructure accessibility”. In: Nature Communications 15.1 (2024), p. 5106
work page 2024
-
[27]
Thomas Navidi, Abbas El Gamal, and Ram Rajagopal. “Coordinating distributed energy resources for reliability can significantly reduce future distribution grid upgrades and peak load”. In:Joule 7.8 (2023), pp. 1769–1792
work page 2023
-
[28]
Potential for widespread electrification of personal vehicle travel in the United States
Zachary A Needell et al. “Potential for widespread electrification of personal vehicle travel in the United States”. In: Nature Energy 1.9 (2016), pp. 1–7
work page 2016
-
[29]
An analytical framework for assessing equitable access to public electric vehicle chargers
Zhenhan Peng et al. “An analytical framework for assessing equitable access to public electric vehicle chargers”. In: Transportation Research Part D: Transport and Environment126 (2024), p. 103990
work page 2024
-
[30]
2024 EV Driver Annual Survey Report
Plug In America. 2024 EV Driver Annual Survey Report. https://pluginamerica.org/survey/2024-ev- driver-survey/. 2024
work page 2024
-
[31]
Siobhan Powell et al. “Charging infrastructure access and operation to reduce the grid impacts of deep electric vehicle adoption”. In: Nature Energy 7.10 (2022), pp. 932–945
work page 2022
-
[32]
The Accessibility and Inaccessibility of Urban Public Charging Stations
Xinwu Qian et al. The Accessibility and Inaccessibility of Urban Public Charging Stations. Preprint, Research Square. Version 1, available at https://doi.org/10.21203/rs.3.rs- 5702771/v1 . Jan. 2025. DOI: 10.21203/rs.3.rs-5702771/v1
-
[33]
Examining spatial disparities in electric vehicle charging station placements using machine learning
Avipsa Roy and Mankin Law. “Examining spatial disparities in electric vehicle charging station placements using machine learning”. In: Sustainable cities and society 83 (2022), p. 103978
work page 2022
-
[34]
statsmodels: Econometric and statistical modeling with python
Skipper Seabold and Josef Perktold. “statsmodels: Econometric and statistical modeling with python”. In:9th Python in Science Conference. 2010
work page 2010
-
[35]
Big mobility data reveals hyperlocal air pollution exposure disparities in the Bronx, New York
Iacopo Testi et al. “Big mobility data reveals hyperlocal air pollution exposure disparities in the Bronx, New York”. In:Nature Cities 1.8 (2024), pp. 512–521
work page 2024
-
[36]
U.S. Census Bureau. 2020 TIGER/Line Shapefile: Census Tracts. Accessed: June 2024. 2020. URL: https:// www.census.gov/cgi-bin/geo/shapefiles/index.php?year=2020&layergroup=Census+Tracts
work page 2020
-
[37]
Department of Energy’s Alternative Fuels Data Center
U.S. Department of Energy’s Alternative Fuels Data Center. Electric Vehicle Charging Station Locations . https://afdc.energy.gov/fuels/electricity_locations.html. Accessed: June 2024
work page 2024
-
[38]
American Community Survey Data
United States Census Bureau. American Community Survey Data. https://data.census.gov/. Accessed: September 2024
work page 2024
-
[39]
Access to urban parks: Comparing spatial accessibility measures using three GIS-based approaches
Siqin Wang, Mingshu Wang, and Yan Liu. “Access to urban parks: Comparing spatial accessibility measures using three GIS-based approaches”. In: Computers, environment and urban systems 90 (2021), p. 101713
work page 2021
-
[40]
Personal vehicle electrification and charging solutions for high-energy days
Wei Wei et al. “Personal vehicle electrification and charging solutions for high-energy days”. In:Nature Energy 6.1 (2021), pp. 105–114. 16 Y . Juet al, 2025
work page 2021
-
[41]
Jiaman Wu et al. “Planning charging stations for 2050 to support flexible electric vehicle demand considering individual mobility patterns”. In: Cell Reports Sustainability 1.1 (2024)
work page 2050
-
[42]
Using human mobility data to quantify experienced urban inequalities
Fengli Xu et al. “Using human mobility data to quantify experienced urban inequalities”. In: Nature Human Behaviour (2025), pp. 1–11
work page 2025
-
[43]
Planning for electric vehicle needs by coupling charging profiles with urban mobility
Yanyan Xu et al. “Planning for electric vehicle needs by coupling charging profiles with urban mobility”. In: Nature Energy 3.6 (2018), pp. 484–493
work page 2018
-
[44]
Enhancing human mobility research with open and standardized datasets
Takahiro Yabe et al. “Enhancing human mobility research with open and standardized datasets”. In: Nature Computational Science 4.7 (2024), pp. 469–472
work page 2024
-
[45]
California’s zero-emission vehicle adoption brings air quality benefits yet equity gaps persist
Qiao Yu et al. “California’s zero-emission vehicle adoption brings air quality benefits yet equity gaps persist”. In: Nature Communications 14.1 (2023), p. 7798
work page 2023
-
[46]
Sustainable plug-in electric vehicle integration into power systems
Hongcai Zhang et al. “Sustainable plug-in electric vehicle integration into power systems”. In:Nature Reviews Electrical Engineering 1.1 (2024), pp. 35–52
work page 2024
-
[47]
Yunteng Zhang and Yueyue Fan. “Equity evaluation of community-based public EV charging services–A case study of the Sacramento region”. In: Energy Policy 198 (2025), p. 114495
work page 2025
-
[48]
Effects of electric vehicle charging stations on the economic vitality of local businesses
Yunhan Zheng et al. “Effects of electric vehicle charging stations on the economic vitality of local businesses”. In: Nature Communications 15.1 (2024), p. 7437. 17 Y . Juet al, 2025 Appendix A: Supplementary plots Figure 7: TI-acs [hours] map across Bay Area census tracts in multiple years Figure 8: TI-acs [ports] map across Bay Area census tracts in mul...
work page 2024
discussion (0)
Sign in with ORCID, Apple, or X to comment. Anyone can read and Pith papers without signing in.