Advanced Calibration Analysis and Tools: Identifying Influential Observations in Stochastic Interest Rate Model Calibration
Pith reviewed 2026-06-26 14:43 UTC · model grok-4.3
The pith
Minimizing root mean squared relative error in stochastic interest rate model calibration is equivalent to a weighted least squares problem.
A machine-rendered reading of the paper's core claim, the machinery that carries it, and where it could break.
Core claim
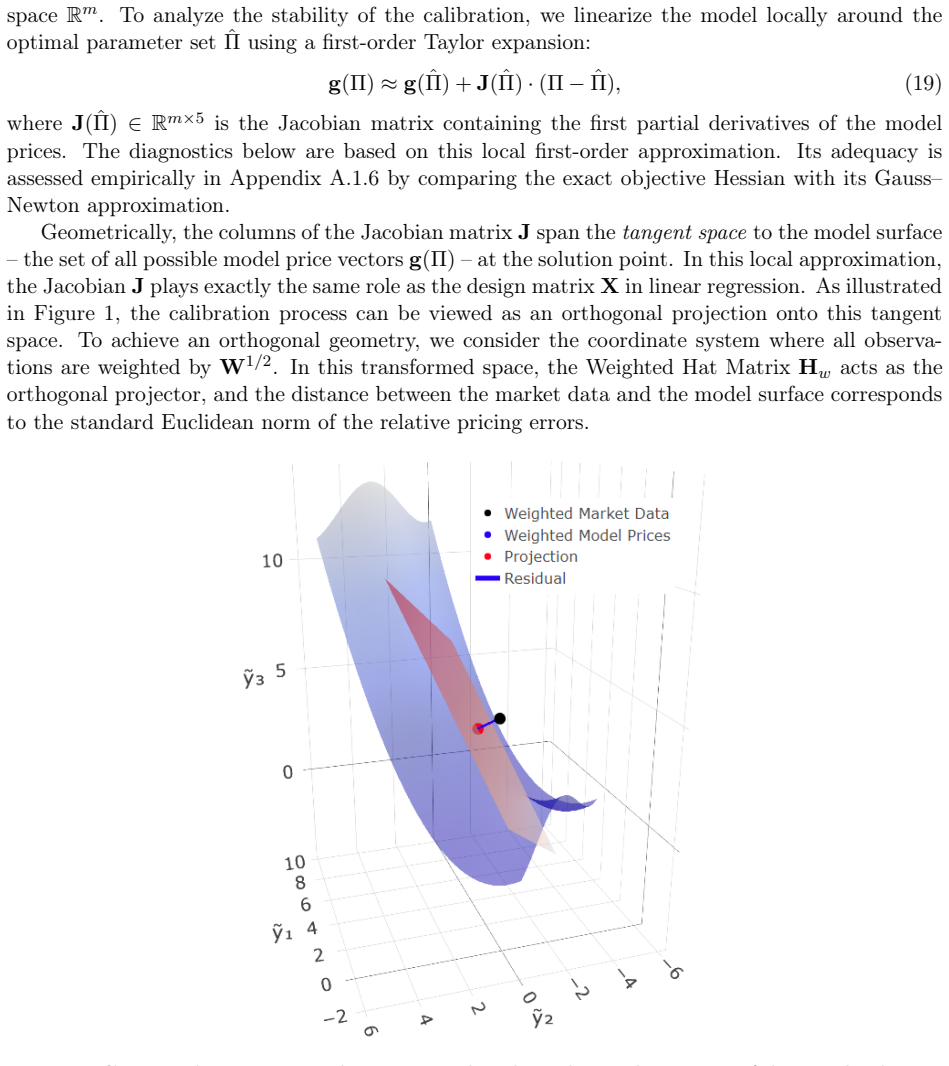
The calibration problem for the G2++ model on ATM caps data can be embedded into nonlinear regression theory by recognizing that RMSRE minimization is equivalent to weighted least squares. This equivalence directly yields the weighted hat matrix for leverage analysis, influence functions for local sensitivity diagnostics, and the functional delta method for local, boundary-respecting confidence intervals, all implemented via an efficient Jacobian factorization that exploits the closed-form prices of ATM caps.
What carries the argument
The equivalence of RMSRE minimization to a weighted least squares problem, which directly supplies the weighted hat matrix, influence functions, and functional delta method for calibration diagnostics.
If this is right
- Low RMSRE is not sufficient by itself to validate a calibration.
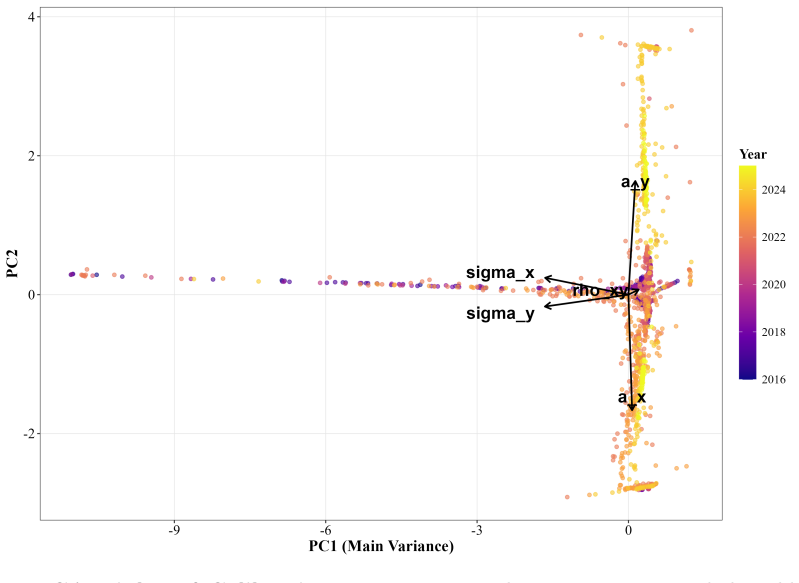
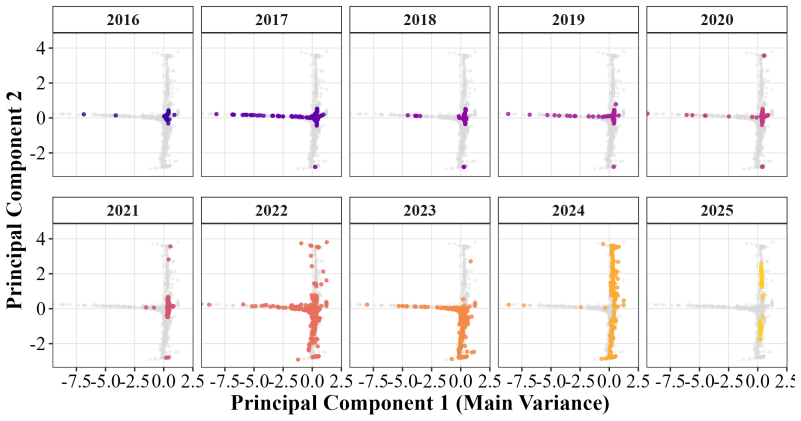
- Leverage profiles for the G2++ model on ATM caps data are dominated by boundary effects.
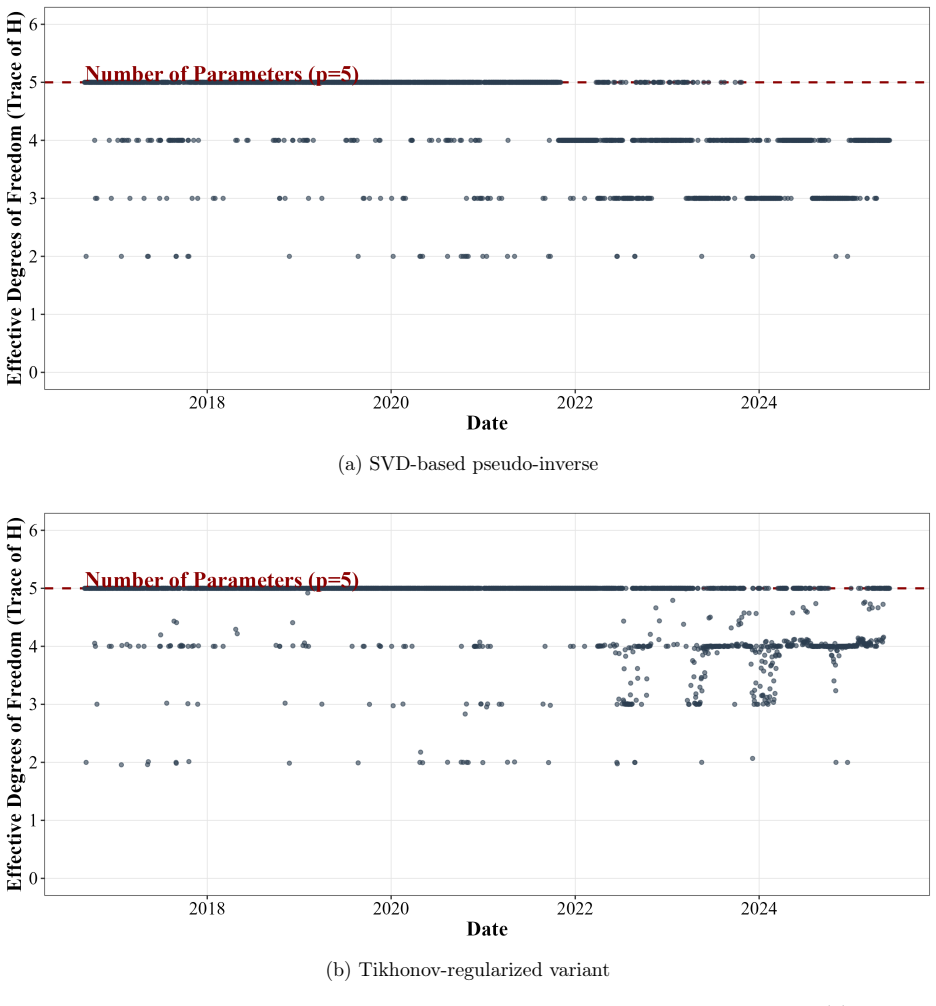
- Active parameter constraints repeatedly reduce the effective dimensionality of the model during fitting.
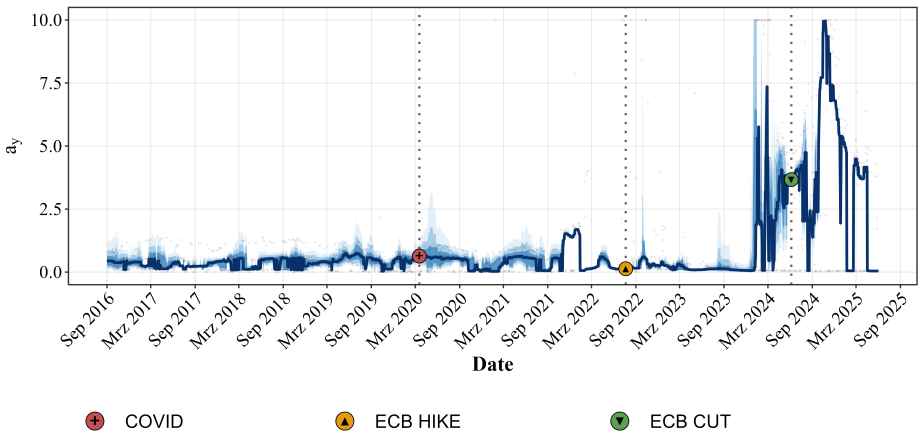
- A diagnostic regime shift in local parameter stability occurs around the post-2022 market transition.
- The same diagnostic framework applies to any least-squares calibration problem that admits an analytical or numerical Jacobian.
Where Pith is reading between the lines
- The diagnostics could be used to select or down-weight market instruments that exert outsized influence on the fitted parameters.
- For instruments without closed-form gradients such as swaptions, the framework would require numerical Jacobians, which would add their own approximation error to the influence measures.
- Model governance processes could adopt influence-function thresholds as routine checks alongside traditional error metrics.
- The same RMSRE-to-weighted-least-squares link may hold for other relative-error criteria used in different asset classes.
Load-bearing premise
The calibration of the G2++ model to ATM caps data can be treated as a nonlinear regression problem with an analytically available Jacobian without losing essential features of the original market-fitting task.
What would settle it
A concrete numerical case in which the parameter vector that minimizes RMSRE differs from the solution of the corresponding weighted least squares problem, or in which the influence functions fail to predict the actual change in fitted parameters when a single data point is removed.
Figures
read the original abstract
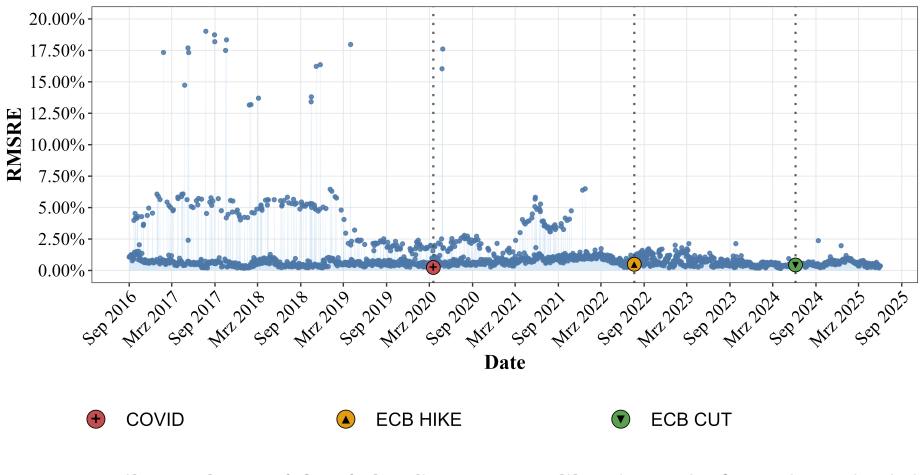
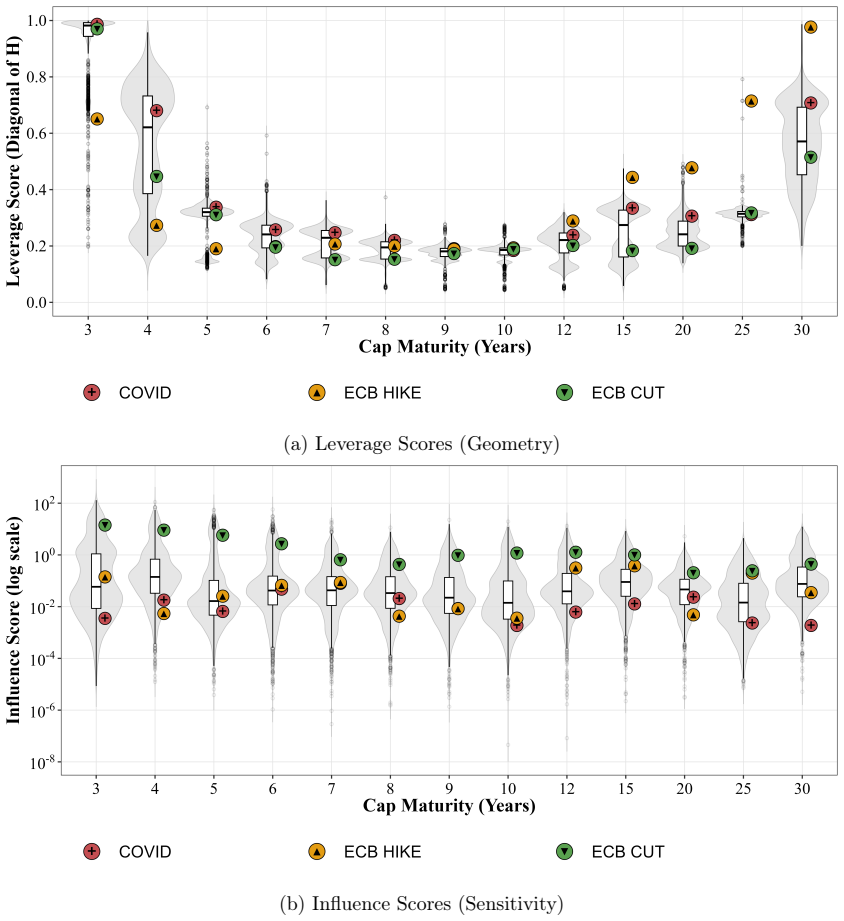
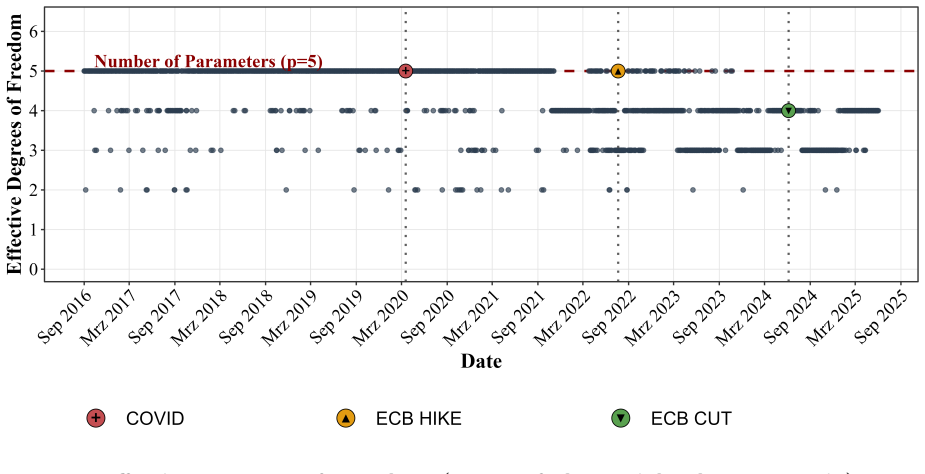
The accurate calibration of interest rate models is central to market-consistent valuation and Economic Scenario Generators (ESGs). Traditional calibration methods for multi-factor models such as the G2++ model often rely on point estimates, neglecting the influence of specific market data and the quantification of estimation uncertainty. This paper develops a diagnostic framework embedding the calibration problem into non-linear regression theory. It shows that the common industry practice of minimizing the Root Mean Squared Relative Error (RMSRE) is equivalent to a Weighted Least Squares (WLS) problem. This equivalence yields the corresponding formulations for diagnostic tools, including the Weighted Hat Matrix for leverage analysis, Influence Functions for local sensitivity diagnostics, and the Functional Delta Method for local, boundary-respecting confidence intervals. The implementation uses an efficient Jacobian factorization that exploits the analytical tractability of At-The-Money (ATM) caps. The framework is applied to a dataset of Euro ATM caps covering the period 2016--2025. Our empirical analysis reveals a boundary-dominated leverage profile, repeated losses of effective dimensionality due to active parameter constraints, and a diagnostic regime shift in local parameter stability around the post-2022 market transition. The resulting message for actuarial model governance is that low RMSRE is not sufficient for calibration validation. We conclude by discussing the framework's applicability to general least-squares problems while highlighting the computational challenges for instruments lacking closed-form gradients, such as swaptions.
Editorial analysis
A structured set of objections, weighed in public.
Referee Report
Summary. The paper claims that RMSRE minimization for calibrating the G2++ model to ATM caps is equivalent to a WLS problem in nonlinear regression theory. This equivalence supplies the weighted hat matrix for leverage, influence functions for sensitivity, and the functional delta method for boundary-respecting confidence intervals, implemented via an efficient Jacobian factorization that exploits closed-form ATM cap prices. Applied to Euro ATM caps data 2016–2025, the analysis identifies a boundary-dominated leverage profile, repeated losses of effective dimensionality from active parameter constraints, and a diagnostic regime shift around the post-2022 market transition, concluding that low RMSRE is insufficient for calibration validation.
Significance. If the embedding and constraint-adjusted diagnostics hold, the framework supplies concrete, computationally tractable tools for assessing which market observations drive calibration outcomes and for quantifying local uncertainty in interest-rate model parameters. The explicit use of analytical Jacobians for ATM instruments and the empirical demonstration of dimensionality loss are strengths that could inform actuarial model governance and ESG construction beyond point-estimate calibration.
major comments (3)
- [Abstract; empirical analysis section] Abstract and empirical findings section: the manuscript reports 'repeated losses of effective dimensionality due to active parameter constraints' and a 'boundary-dominated leverage profile,' yet the derivations of the Weighted Hat Matrix H = J (J^T W J)^{-1} J^T W, influence functions, and Functional Delta Method follow the standard unconstrained nonlinear-regression formulas. Binding constraints require a projected Jacobian or reduced Hessian satisfying the KKT conditions; without an explicit projection step or reduced-rank adjustment, the reported leverage, sensitivity, and boundary-respecting CIs rest on an invalid embedding.
- [Derivation of diagnostic tools] Section deriving the diagnostic tools: the claim that the RMSRE–WLS equivalence 'yields the corresponding formulations' for the hat matrix and influence functions does not address how the Jacobian J is modified when parameters hit boundaries. The weakest assumption (embedding the calibration into unconstrained nonlinear regression) becomes load-bearing once the empirical results themselves document active constraints.
- [Functional Delta Method subsection] Functional Delta Method subsection: the assertion of 'local, boundary-respecting confidence intervals' requires a concrete demonstration that the delta-method variance accounts for the active-set geometry; the standard delta method assumes an interior stationary point where the full Jacobian spans the parameter space.
minor comments (2)
- [Notation and setup] Notation for the weight matrix W and the Jacobian J should be introduced with explicit dimensions and clarified whether W is diagonal (as implied by RMSRE) or allows off-diagonal terms.
- [Implementation] The manuscript would benefit from a small table contrasting the unconstrained versus projected forms of the hat matrix to make the adjustment (or lack thereof) transparent.
Simulated Author's Rebuttal
We thank the referee for the thorough review and for highlighting the important issue of active parameter constraints in the diagnostic framework. The comments correctly identify that the core derivations rely on standard unconstrained nonlinear-regression formulas while the empirical section documents binding constraints. We address each major comment below and indicate the revisions we will make.
read point-by-point responses
-
Referee: [Abstract; empirical analysis section] Abstract and empirical findings section: the manuscript reports 'repeated losses of effective dimensionality due to active parameter constraints' and a 'boundary-dominated leverage profile,' yet the derivations of the Weighted Hat Matrix H = J (J^T W J)^{-1} J^T W, influence functions, and Functional Delta Method follow the standard unconstrained nonlinear-regression formulas. Binding constraints require a projected Jacobian or reduced Hessian satisfying the KKT conditions; without an explicit projection step or reduced-rank adjustment, the reported leverage, sensitivity, and boundary-respecting CIs rest on an invalid embedding.
Authors: The referee is correct that the presented formulas for the weighted hat matrix, influence functions, and functional delta method are the standard unconstrained versions. The empirical analysis detects active constraints through the observed rank deficiency of the Jacobian and the resulting leverage profile, but does not apply an explicit projection or reduced Hessian at those points. This constitutes a limitation in the current embedding. We will revise the abstract and empirical section to qualify the reported diagnostics as approximations valid when the active set is stable, and we will add a brief discussion of the conditions under which the unconstrained formulas remain informative. revision: yes
-
Referee: [Derivation of diagnostic tools] Section deriving the diagnostic tools: the claim that the RMSRE–WLS equivalence 'yields the corresponding formulations' for the hat matrix and influence functions does not address how the Jacobian J is modified when parameters hit boundaries. The weakest assumption (embedding the calibration into unconstrained nonlinear regression) becomes load-bearing once the empirical results themselves document active constraints.
Authors: We agree that the derivation section presents the RMSRE–WLS equivalence under the unconstrained setting and does not derive the necessary adjustments to J when parameters reach boundaries. The manuscript relies on post-hoc empirical detection of dimensionality loss rather than an a-priori reduced-rank formulation. We will revise the derivation section to state the interior-point assumption explicitly and to outline how a projected Jacobian could be substituted when the active set is known, thereby strengthening the link between theory and the observed constraint activity. revision: yes
-
Referee: [Functional Delta Method subsection] Functional Delta Method subsection: the assertion of 'local, boundary-respecting confidence intervals' requires a concrete demonstration that the delta-method variance accounts for the active-set geometry; the standard delta method assumes an interior stationary point where the full Jacobian spans the parameter space.
Authors: The referee correctly notes that the standard functional delta method assumes an interior stationary point. The manuscript’s claim of “boundary-respecting” intervals rests on the empirical observation that the effective parameter space contracts when constraints bind, but does not supply the corresponding reduced covariance expression. We will revise the subsection to replace the unqualified claim with a statement that the intervals are local and interior-point approximations, and we will add a short derivation sketch showing how the delta-method variance can be restricted to the tangent space of the active constraints when the KKT conditions are satisfied. revision: yes
Circularity Check
No significant circularity; standard embedding of RMSRE into WLS theory with external diagnostics
full rationale
The paper's core step is showing RMSRE minimization equals WLS (a known algebraic equivalence under relative-error weighting), then importing standard nonlinear regression diagnostics (Weighted Hat Matrix, influence functions, Functional Delta Method) whose derivations are independent of this paper. No quoted reduction shows any diagnostic quantity defined circularly in terms of the fitted parameters or via self-citation load-bearing. The empirical findings on constraints and boundary effects are presented as observations, not as predictions forced by the framework itself. The derivation remains self-contained against external WLS theory benchmarks.
Axiom & Free-Parameter Ledger
Reference graph
Works this paper leans on
-
[1]
Journal of the American Statistical Association , volume =
Tilmann Gneiting. Making and evaluating point forecasts.Journal of the American Statistical Association, 106(494):746–762, 2011. doi: 10.1198/jasa.2011.r10138
-
[2]
A yield-factor model of interest rates.Mathematical Finance, 6 (4):379–406, 1996
Darrell Duffie and Rui Kan. A yield-factor model of interest rates.Mathematical Finance, 6 (4):379–406, 1996. doi: 10.1111/j.1467-9965.1996.tb00123.x
-
[3]
Damir Filipović.Term-Structure Models: A Graduate Course. Springer Finance. Springer Berlin, Heidelberg, 2009. ISBN 9783540680154. doi: 10.1007/978-3-540-68015-4
-
[4]
Springer Finance
Damiano Brigo and Fabio Mercurio.Interest Rate Models: Theory and Practice. Springer Finance. Springer, Berlin, Heidelberg, 2001. ISBN 978-3-540-41772-9
2001
-
[5]
Mark-Oliver Wolf, Benedict Nikolaus Meyer, Philipp Mahler, and Maximilian Diehl. openIRM: Publicly accessible internal risk model of an artificial life insurer for analyzing and benchmark- ing actuarial methods in the Solvency II setting.European Actuarial Journal, 16:225–282, 2026. doi: 10.1007/s13385-025-00435-6
-
[6]
Chapman & Hall/CRC Financial Mathematics Series
Rama Cont and Peter Tankov.Financial Modelling with Jump Processes. Chapman & Hall/CRC Financial Mathematics Series. Chapman & Hall/CRC, Boca Raton, FL, 2003. ISBN 9781584884132. doi: 10.1201/9780203485217
-
[7]
Calibration of stochastic models for interest rate derivatives.Optimization, 58 (3):373–388, 2009
Martin Rainer. Calibration of stochastic models for interest rate derivatives.Optimization, 58 (3):373–388, 2009. doi: 10.1080/02331930902741796
-
[8]
Patrik Karlsson, K. F. Pilz, and Erik Schlögl. Calibrating a market model with stochastic volatility to commodity and interest rate risk.Quantitative Finance, 17(6):907–925, 2017. doi: 10.1080/14697688.2016.1254814
-
[9]
The importance of the loss function in option valuation
Peter Christoffersen and Kris Jacobs. The importance of the loss function in option valuation. Journal of Financial Economics, 72(2):291–318, 2004. doi: 10.1016/j.jfineco.2003.02.001
-
[10]
Studi- enbücher Wirtschaftsmathematik
Sascha Desmettre and Ralf Korn.Moderne Finanzmathematik – Theorie und praktische Anwen- dung Band 2: Erweiterungen des Black–Scholes-Modells, Zins, Kreditrisiko und Statistik. Studi- enbücher Wirtschaftsmathematik. Springer Spektrum, Wiesbaden, 2018. ISBN 9783658209995. doi: 10.1007/978-3-658-21000-7
-
[11]
George A. F. Seber and Christopher J. Wild.Nonlinear Regression. Wiley Series in Probability and Statistics. Wiley, New York, 1989. ISBN 9780471617600. doi: 10.1002/0471725315
-
[12]
Huber.Robust Statistics
Peter J. Huber.Robust Statistics. John Wiley & Sons, New York, 1981
1981
-
[13]
Hampel, Elvezio M
Frank R. Hampel, Elvezio M. Ronchetti, Peter J. Rousseeuw, and Werner A. Stahel.Robust Statistics: The Approach Based on Influence Functions. John Wiley & Sons, New York, 1986
1986
-
[14]
Reeds.On the Definition of von Mises Functionals
James A. Reeds.On the Definition of von Mises Functionals. PhD thesis, Harvard University, Cambridge, MA, 1976
1976
-
[15]
Springer Series in Statistics
Helmut Rieder.Robust Asymptotic Statistics. Springer Series in Statistics. Springer, New York, 1994. 46
1994
-
[16]
Adi Ben-Israel and Thomas N. E. Greville.Generalized Inverses: Theory and Applications. CMS Books in Mathematics. Springer, New York, 2 edition, 2003. ISBN 9780387002934. doi: 10.1007/b97366
-
[17]
Inferring Team Strengths Using a Discrete Markov Random Field
Jerry L. Hintze and Ray D. Nelson. Violin plots: A box plot-density trace synergism.The American Statistician, 52(2):181–184, 1998. doi: 10.1080/00031305.1998.10480559
work page internal anchor Pith review Pith/arXiv arXiv doi:10.1080/00031305.1998.10480559 1998
-
[18]
van der Vaart.Asymptotic Statistics
Aad W. van der Vaart.Asymptotic Statistics. Cambridge Series in Statistical and Probabilistic Mathematics. Cambridge University Press, Cambridge, 1998. ISBN 9780521496032. doi: 10. 1017/CBO9780511802256
1998
-
[19]
Self-published, Munich, 2 edition, 2022
Christoph Molnar.Interpretable Machine Learning: A Guide for Making Black Box Models Explainable. Self-published, Munich, 2 edition, 2022. URLhttps://christophm.github.io/ interpretable-ml-book/
2022
-
[20]
R. Dennis Cook and Sanford Weisberg. Regression diagnostics with dynamic graphics.Tech- nometrics, 31(3):277–291, 1989. doi: 10.1080/00401706.1989.10488547
-
[21]
Werner A. Stahel and Sanford Weisberg, editors.Directions in Robust Statistics and Diagnos- tics: Part II, volume 34 ofThe IMA Volumes in Mathematics and its Applications. Springer, New York, 1991. ISBN 978-0-387-97531-3. doi: 10.1007/978-1-4612-4444-8
-
[22]
A. C. Atkinson. Masking unmasked.Biometrika, 73(3):533–541, 1986. doi: 10.1093/biomet/ 73.3.533
-
[23]
Robust standard errors for robust estimators
Christophe Croux, Geert Dhaene, and Dirk Hoorelbeke. Robust standard errors for robust estimators. CES Discussion Paper DPS 03.16, CES, KU Leuven, 2003. 47
2003
discussion (0)
Sign in with ORCID, Apple, or X to comment. Anyone can read and Pith papers without signing in.