Value-of-Information Analysis for External Validation of Risk Prediction Models in Multicenter Studies and Systematic Reviews
Pith reviewed 2026-07-03 02:42 UTC · model grok-4.3
The pith
EVPI methods extended to multicenter studies distinguish global from local uncertainty in model validation.
A machine-rendered reading of the paper's core claim, the machinery that carries it, and where it could break.
Core claim
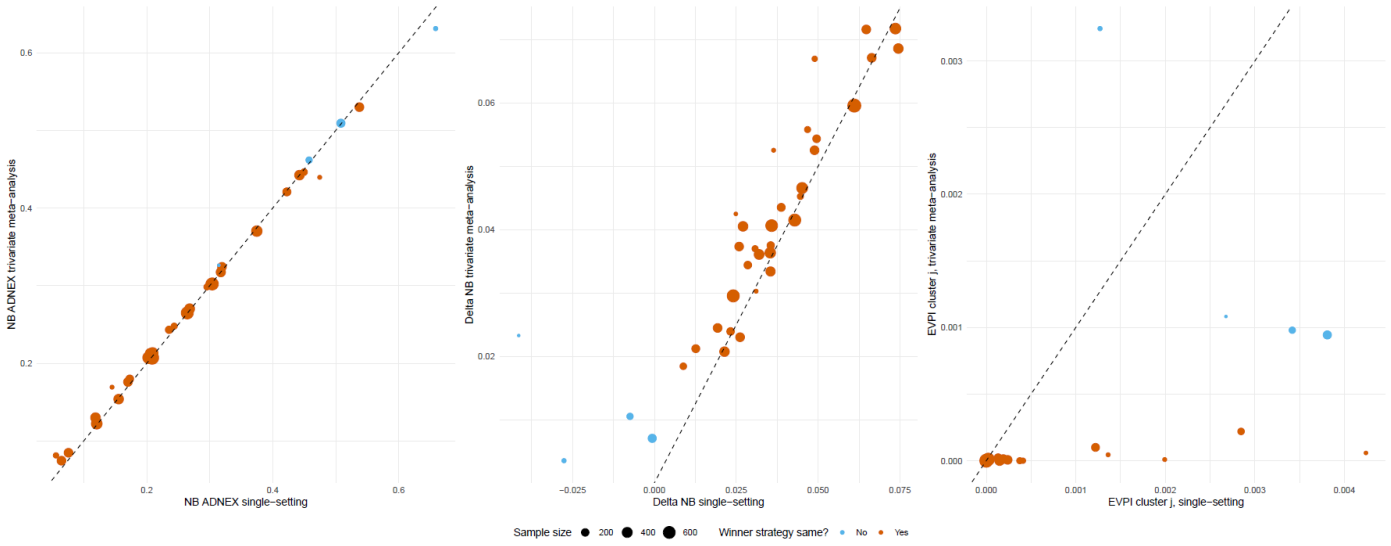
By extending EVPI and EVPPI to account for between-cluster heterogeneity, the analysis distinguishes the global optimal strategy from local ones and observed from unobserved clusters, showing in the ADNEX case that no further data are needed for a global decision while local decisions may benefit from additional information on prevalence and performance.
What carries the argument
EVPIglobal, EVPIcluster_j, EVPIcluster, and EVPPIcluster,prevalence, which incorporate a model for between-cluster heterogeneity to borrow strength across observed centers.
If this is right
- With one global decision, EVPIglobal equals zero for the ADNEX model, so no additional validation is needed to confirm superiority overall.
- Meta-analysis results in consistent local superiority of ADNEX with lower EVPIcluster_j than local data alone.
- There is a 0.03 probability that default strategies are superior in unobserved centers.
- Resolving uncertainty on performance and prevalence across clusters would gain 1134 net avoided false positives per year.
- Resolving only local prevalence uncertainty would gain 158 avoided false positives per year.
Where Pith is reading between the lines
- The approach could help prioritize which centers need more validation data based on their specific EVPI values.
- Similar extensions might apply to other decision-analytic contexts with clustered data.
- The global-local distinction could be tested for sensitivity under alternative heterogeneity models.
Load-bearing premise
The statistical model for between-cluster heterogeneity correctly captures how centers vary while allowing borrowing of information from observed ones.
What would settle it
Finding that the performance in a new, unobserved center falls outside the range predicted by the heterogeneity model with high probability would indicate that the EVPI calculations for unobserved clusters do not hold.
Figures
read the original abstract
External validation studies have finite sample sizes, creating uncertainty about whether a prediction model's Net Benefit (NB) exceeds default strategies' NB. The expected value of perfect information (EVPI) quantifies consequences of uncertainty. Current EVPI methods focus on single studies, ignoring between-center heterogeneity. We extend EVPI and expected value of partial perfect information (EVPPI) to account for between-cluster heterogeneity in multicenter studies and meta-analyses. We distinguish between the global and local optimal strategy and between observed and unobserved clusters. We define EVPIglobal, EVPIcluster_j, EVPIcluster, and EVPPIcluster,prevalence, implemented in the MetaNB R package, and illustrate them using a systematic review across 36 centers of the ADNEX model for ovarian cancer diagnosis. Assuming one global decision regarding ADNEX adoption, there is no need for further data to confirm ADNEX is superior overall (EVPIglobal 0). Meta-analysis borrows information across observed clusters, resulting in consistent local superiority of ADNEX and nonzero but typically lower EVPIcluster_j than when considering local data alone. There is 0.03 probability default strategies are superior in unobserved centers. Eliminating uncertainty on performance and prevalence in each (EVPIcluster) would gain 1134 net avoided false positives (FP) per year, assuming 350000 tumors annually with 20% malignancies. Determining only local prevalence with certainty (EVPPIcluster, prevalence) would gain net 158 avoided FP per year. EVPI extensions disentangle sources of uncertainty and quantify the need for further validation to determine the global or locally optimal strategy. Considering uncertainty and heterogeneity in clinical utility across clusters is essential to decide whether additional validation studies are warranted.
Editorial analysis
A structured set of objections, weighed in public.
Referee Report
Summary. The manuscript extends EVPI and EVPPI calculations to multicenter validation studies and meta-analyses by incorporating between-center heterogeneity via a hierarchical model. It defines EVPIglobal, EVPIcluster_j, EVPIcluster, and EVPPIcluster,prevalence to distinguish global vs. local decisions and observed vs. unobserved clusters. Applied to a systematic review of the ADNEX model across 36 centers, the analysis concludes EVPIglobal = 0 (no further data needed for global adoption), a 0.03 probability that default strategies are superior in unobserved centers, and specific gains (1134 and 158 net avoided false positives per year) from resolving uncertainty on performance/prevalence or prevalence alone.
Significance. If the hierarchical model holds, the framework quantifies how borrowing strength across centers affects the value of additional validation data, helping decide whether further studies are warranted for global or local adoption of prediction models. The ADNEX illustration shows how global EVPI can be zero while local quantities remain positive, providing a practical tool for systematic reviews in clinical prediction.
major comments (2)
- [Methods] The central claims (EVPIglobal = 0 and the 0.03 probability for unobserved centers) are obtained by integrating over the posterior predictive distribution of performance and prevalence in unobserved clusters under the hierarchical model. The manuscript must supply the explicit model equations (random-effects distribution, variance components, exchangeability assumptions) and the fitting procedure used on the 36 centers, as misspecification would directly alter the global/local separation and the reported probabilities.
- [Results] No sensitivity analyses are described for alternative random-effects distributions or inflated variance components. Because the EVPIglobal = 0 result and the separation from EVPIcluster quantities depend on the fitted heterogeneity model, such checks are required to establish robustness of the main numerical conclusions.
minor comments (2)
- [Abstract] The abstract reports numerical results (EVPIglobal = 0, 0.03 probability, 1134 and 158 avoided FP) without referencing the data source or model; a brief parenthetical on the 36-center ADNEX meta-analysis would improve standalone readability.
- The MetaNB R package is mentioned but no code or data availability statement appears; adding a repository link would support reproducibility of the EVPI extensions.
Simulated Author's Rebuttal
We thank the referee for their detailed and insightful comments. We believe the suggested additions will improve the clarity and robustness of the manuscript. Below we respond to each major comment.
read point-by-point responses
-
Referee: [Methods] The central claims (EVPIglobal = 0 and the 0.03 probability for unobserved centers) are obtained by integrating over the posterior predictive distribution of performance and prevalence in unobserved clusters under the hierarchical model. The manuscript must supply the explicit model equations (random-effects distribution, variance components, exchangeability assumptions) and the fitting procedure used on the 36 centers, as misspecification would directly alter the global/local separation and the reported probabilities.
Authors: We agree with the referee that the explicit model equations and fitting details are crucial for the reproducibility and credibility of our results. The current manuscript describes the extension conceptually but does not provide the full mathematical specification. In the revised manuscript, we will include the complete hierarchical model equations, specifying the random-effects distributions for the performance parameters and prevalence, the variance components capturing between-center heterogeneity, the exchangeability assumptions across centers, and the details of the model fitting procedure applied to the 36 centers in the ADNEX systematic review. This will allow readers to fully understand how the posterior predictive distributions for unobserved clusters are obtained and how they influence the EVPI calculations. revision: yes
-
Referee: [Results] No sensitivity analyses are described for alternative random-effects distributions or inflated variance components. Because the EVPIglobal = 0 result and the separation from EVPIcluster quantities depend on the fitted heterogeneity model, such checks are required to establish robustness of the main numerical conclusions.
Authors: We recognize that sensitivity analyses are important to demonstrate that the main conclusions, particularly EVPIglobal = 0, are not sensitive to the specific choice of random-effects distribution or the magnitude of variance components. Although the primary analysis uses a standard normal random-effects model fitted to the data, we will add a new subsection in the Results presenting sensitivity analyses under alternative distributions (such as heavier-tailed distributions) and with inflated variance components. These will show the impact on EVPIglobal, the probability for unobserved centers, and the local EVPI values, thereby strengthening the robustness of our findings. revision: yes
Circularity Check
No significant circularity; EVPI extensions are definitional and results are computed outcomes
full rationale
The paper extends standard EVPI/EVPPI formulas to multicenter settings by defining EVPIglobal, EVPIcluster_j, etc., as integrals over a hierarchical model's posterior predictive distribution for observed and unobserved clusters. These are new quantities defined from first principles in the VOI framework, not self-referential. Reported results (EVPIglobal=0, 0.03 probability for unobserved centers, net avoided FP gains) are direct numerical outputs from applying the fitted random-effects model to the 36-center ADNEX data; they are not algebraically forced by construction or renamed inputs. No self-citation load-bearing steps, no fitted parameters relabeled as predictions, and no uniqueness theorems invoked. The derivation chain is self-contained and externally falsifiable via the stated heterogeneity assumptions.
Axiom & Free-Parameter Ledger
axioms (2)
- domain assumption Decisions are made by comparing expected net benefit of the prediction model against default strategies at a fixed risk threshold.
- domain assumption Between-center heterogeneity can be represented by a statistical model that allows information borrowing across observed centers while still permitting distinct behavior in unobserved centers.
Reference graph
Works this paper leans on
-
[1]
Austin PC, van Klaveren D, Vergouwe Y, et al. Geographic and temporal validity of prediction models: different approaches were useful to examine model performance. Journal of clinical epidemiology 2016;79:76-85. doi: 10.1016/j.jclinepi.2016.05.007 [published Online First: 20160602]
-
[2]
Vergouwe Y, Moons KG, Steyerberg EW. External validity of risk models: Use of benchmark values to disentangle a case-mix effect from incorrect coefficients. Am J Epidemiol 2010;172(8):971-80. doi: 10.1093/aje/kwq223 [published Online First: 20100831]
-
[3]
Luijken K, Wynants L, van Smeden M, et al. Changing predictor measurement procedures affected the performance of prediction models in clinical examples. Journal of clinical epidemiology 2020;119:7-18. doi: 10.1016/j.jclinepi.2019.11.001 [published Online First: 20191109]
-
[4]
Riley RD, Ensor J, Snell KIE, et al. External validation of clinical prediction models using big datasets from e-health records or IPD meta-analysis: opportunities and challenges. BMJ (Clinical research ed) 2016;353:i3140. doi: 10.1136/bmj.i3140
-
[5]
Wynants L, Kent DM, Timmerman D, et al. Untapped potential of multicenter studies: a review of cardiovascular risk prediction models revealed inappropriate analyses and wide variation in reporting. Diagnostic and prognostic research 2019;3:6. doi: 10.1186/s41512-019-0046-9 [published Online First: 20190222]
-
[6]
Prevalence‐free utility‐respecting summary indices of diagnostic power do not exist
Hilden J. Prevalence‐free utility‐respecting summary indices of diagnostic power do not exist. Statistics in medicine 2000;19(4):431-40
2000
-
[7]
Calibration of risk prediction models: impact on decision- analytic performance
Van Calster B, Vickers AJ. Calibration of risk prediction models: impact on decision- analytic performance. Medical decision making : an international journal of the Society for Medical Decision Making 2015;35(2):162-9. doi: 10.1177/0272989X14547233 [published Online First: 20140825]
-
[8]
Vickers AJ, Cronin AM, Elkin EB, Gonen M. Extensions to decision curve analysis, a novel method for evaluating diagnostic tests, prediction models and molecular markers. BMC Med Inform Decis Mak 2008;8:53. doi: 10.1186/1472-6947-8-53 [published Online First: 20081126]
-
[9]
TRIPOD+ AI statement: updated guidance for reporting clinical prediction models that use regression or machine learning methods
Collins GS, Moons KG, Dhiman P, et al. TRIPOD+ AI statement: updated guidance for reporting clinical prediction models that use regression or machine learning methods. BMJ (Clinical research ed) 2024;385
2024
-
[10]
Van Calster B, Collins GS, Vickers AJ, et al. Evaluation of performance measures in predictive artificial intelligence models to support medical decisions: overview and guidance. Lancet Digit Health 2025;7(12):100916. doi: 10.1016/j.landig.2025.100916 [published Online First: 20251213]
-
[11]
The Importance of Uncertainty and Opt-In v
Kerr KF, Marsh TL, Janes H. The Importance of Uncertainty and Opt-In v. Opt-Out: Best Practices for Decision Curve Analysis. Medical decision making : an international journal of the Society for Medical Decision Making 2019;39(5):491-92. doi: 10.1177/0272989X19849436 [published Online First: 20190520]
-
[12]
Bayesian Decision Curve Analysis with bayesDCA
Cruz GNF, Korthauer K. Bayesian Decision Curve Analysis with bayesDCA. 2023. https://ui.adsabs.harvard.edu/abs/2023arXiv230802067C (accessed August 01, 2023)
2023
-
[13]
Estimating the decision curve and its precision from three study designs
Pfeiffer RM, Gail MH. Estimating the decision curve and its precision from three study designs. Biometrical Journal 2020;62(3):764-76
2020
-
[14]
Statistical inference for net benefit measures in biomarker validation studies
Marsh TL, Janes H, Pepe MS. Statistical inference for net benefit measures in biomarker validation studies. Biometrics 2020;76(3):843-52. doi: 10.1111/biom.13190 [published Online First: 20191128] 18
-
[15]
Statistical inference for decision curve analysis, with applications to cataract diagnosis
Sande SZ, Li J, D'Agostino R, et al. Statistical inference for decision curve analysis, with applications to cataract diagnosis. Statistics in medicine 2020;39(22):2980-3002. doi: 10.1002/sim.8588 [published Online First: 20200715]
-
[16]
Decision curve analysis: a technical note
Zhang Z, Rousson V, Lee WC, et al. Decision curve analysis: a technical note. Ann Transl Med 2018;6(15):308. doi: 10.21037/atm.2018.07.02
-
[17]
Decision curve analysis: confidence intervals and hypothesis testing for net benefit
Vickers AJ, Van Claster B, Wynants L, Steyerberg EW. Decision curve analysis: confidence intervals and hypothesis testing for net benefit. Diagnostic and prognostic research 2023;7(1):11. doi: 10.1186/s41512-023-00148-y [published Online First: 20230606]
-
[18]
Claxton K. The irrelevance of inference: a decision-making approach to the stochastic evaluation of health care technologies. J Health Econ 1999;18(3):341-64. doi: 10.1016/s0167-6296(98)00039-3
-
[19]
Value-of-Information Analysis for External Validation of Risk Prediction Models
Sadatsafavi M, Lee TY, Wynants L, et al. Value-of-Information Analysis for External Validation of Risk Prediction Models. Medical decision making : an international journal of the Society for Medical Decision Making 2023;43(5):564-75. doi: 10.1177/0272989X231178317 [published Online First: 20230622]
-
[20]
Expected Value of Sample Information Calculations for Risk Prediction Model Validation
Sadatsafavi M, Vickers AJ, Lee TY, et al. Expected Value of Sample Information Calculations for Risk Prediction Model Validation. Medical decision making : an international journal of the Society for Medical Decision Making 2025;45(3):232-44. doi: 10.1177/0272989X251314010 [published Online First: 20250218]
-
[21]
Random-effects meta-analysis of the clinical utility of tests and prediction models
Wynants L, Riley RD, Timmerman D, Van Calster B. Random-effects meta-analysis of the clinical utility of tests and prediction models. Statistics in medicine 2018;37(12):2034-52. doi: 10.1002/sim.7653 [published Online First: 20180325]
-
[22]
The interpretation of random-effects meta-analysis in decision models
Ades AE, Lu G, Higgins JP. The interpretation of random-effects meta-analysis in decision models. Medical decision making : an international journal of the Society for Medical Decision Making 2005;25(6):646-54. doi: 10.1177/0272989X05282643
-
[23]
Handbook of markov chain monte carlo: CRC press 2011
Brooks S, Gelman A, Jones G, Meng X-L. Handbook of markov chain monte carlo: CRC press 2011
2011
-
[24]
Wynants L. CORRECTION. Statistics in medicine 2020 doi: 10.1002/sim.8515 [published Online First: 20200318]
-
[25]
Bujkiewicz S. Bayesian meta-analytical methods to incorporate multiple surrogate endpoints in drug development process. Statistics in medicine 2022;41(30):5877-78. doi: 10.1002/sim.9597
-
[26]
Bujkiewicz S, Thompson JR, Riley RD, Abrams KR. Bayesian meta-analytical methods to incorporate multiple surrogate endpoints in drug development process. Statistics in medicine 2016;35(7):1063-89. doi: 10.1002/sim.6776 [published Online First: 20151103]
-
[27]
Multivariate meta-analysis of mixed outcomes: a Bayesian approach
Bujkiewicz S, Thompson JR, Sutton AJ, et al. Multivariate meta-analysis of mixed outcomes: a Bayesian approach. Statistics in medicine 2013;32(22):3926-43. doi: 10.1002/sim.5831 [published Online First: 20130430]
-
[28]
Calculating partial expected value of perfect information via Monte Carlo sampling algorithms
Brennan A, Kharroubi S, O'Hagan A, Chilcott J. Calculating partial expected value of perfect information via Monte Carlo sampling algorithms. Medical decision making : an international journal of the Society for Medical Decision Making 2007;27(4):448-
2007
-
[29]
doi: 10.1177/0272989x07302555
-
[30]
Sadatsafavi M, Bansback N, Zafari Z, et al. Need for speed: an efficient algorithm for calculation of single-parameter expected value of partial perfect information. Value in health : the journal of the International Society for Pharmacoeconomics and Outcomes Research 2013;16(2):438-48. doi: 10.1016/j.jval.2012.10.018 [published Online First: 20130126] 19
-
[31]
Van Calster B, Van Hoorde K, Valentin L, et al. Evaluating the risk of ovarian cancer before surgery using the ADNEX model to differentiate between benign, borderline, early and advanced stage invasive, and secondary metastatic tumours: prospective multicentre diagnostic study. BMJ (Clinical research ed) 2014;349:g5920. doi: 10.1136/bmj.g5920 [published O...
-
[32]
Barrenada L, Ledger A, Dhiman P, et al. ADNEX risk prediction model for diagnosis of ovarian cancer: systematic review and meta-analysis of external validation studies. BMJ Med 2024;3(1):e000817. doi: 10.1136/bmjmed-2023-000817 [published Online First: 20240217]
-
[33]
ESGO/ISUOG/IOTA/ESGE Consensus Statement on preoperative diagnosis of ovarian tumors
Timmerman D, Planchamp F, Bourne T, et al. ESGO/ISUOG/IOTA/ESGE Consensus Statement on preoperative diagnosis of ovarian tumors. Ultrasound Obstet Gynecol 2021;58(1):148-68. doi: 10.1002/uog.23635 [published Online First: 20210610]
-
[34]
Van Calster B, Valentin L, Froyman W, et al. Validation of models to diagnose ovarian cancer in patients managed surgically or conservatively: multicentre cohort study. BMJ (Clinical research ed) 2020;370:m2614. doi: 10.1136/bmj.m2614 [published Online First: 20200730]
-
[35]
Cancer Care in 2020 – An overview of cancer outcomes data across Europe
European Federation of Pharmaceutical Industries and Associations. Cancer Care in 2020 – An overview of cancer outcomes data across Europe. [Available from: https://wwwefpiaeu/publications/cancer-comparator-report/cancer-types/ovarian- cancer/
2020
-
[36]
Ovarian cancer: A silent killer 2021 [Available from: https://eurohealthie/policy-brief-women-and-ovarian-cancer-in-the-eu-2018/
European Institute of Women's Health. Ovarian cancer: A silent killer 2021 [Available from: https://eurohealthie/policy-brief-women-and-ovarian-cancer-in-the-eu-2018/
2021
-
[37]
Grimm SE, Pouwels X, Ramaekers BLT, et al. Development and Validation of the TRansparent Uncertainty ASsessmenT (TRUST) Tool for Assessing Uncertainties in Health Economic Decision Models. Pharmacoeconomics 2020;38(2):205-16. doi: 10.1007/s40273-019-00855-9
-
[38]
Stein's paradox in statistics
Efron B, Morris C. Stein's paradox in statistics. Scientific American 1977;236(5):119-27
1977
-
[39]
Data analysis using regression and multilevel/hierarchical models: Cambridge university press 2007
Gelman A, Hill J. Data analysis using regression and multilevel/hierarchical models: Cambridge university press 2007
2007
-
[40]
Welton N, Ades AE. Research decisions in the face of heterogeneity: what can a new study tell us? Health Econ 2012;21(10):1196-200. doi: 10.1002/hec.1797 [published Online First: 20111103]
-
[41]
There is no such thing as a validated prediction model
Van Calster B, Steyerberg EW, Wynants L, van Smeden M. There is no such thing as a validated prediction model. BMC Med 2023;21(1):70. doi: 10.1186/s12916-023- 02779-w [published Online First: 20230224]
-
[42]
Austin PC, van Klaveren D, Vergouwe Y, et al. Validation of prediction models: examining temporal and geographic stability of baseline risk and estimated covariate effects. Diagnostic and prognostic research 2017;1:12. doi: 10.1186/s41512-017- 0012-3 [published Online First: 20170413]
-
[43]
Correction: interpretation of random effects meta- analysis in decision models
Welton NJ, White IR, Lu G, et al. Correction: interpretation of random effects meta- analysis in decision models. Medical decision making : an international journal of the Society for Medical Decision Making 2007;27(2):212-4. doi: 10.1177/0272989X07300428
-
[44]
Espinoza MA, Manca A, Claxton K, Sculpher MJ. The value of heterogeneity for cost- effectiveness subgroup analysis: conceptual framework and application. Medical decision making : an international journal of the Society for Medical Decision Making 2014;34(8):951-64. doi: 10.1177/0272989X14538705 [published Online First: 20140618] 20
-
[45]
Against reflexive recalibration: towards a causal framework for addressing miscalibration
Swaminathan A, Srivastava U, Tu L, et al. Against reflexive recalibration: towards a causal framework for addressing miscalibration. Diagnostic and prognostic research 2025;9(1):4. doi: 10.1186/s41512-024-00184-2 [published Online First: 20250211]
-
[46]
When accurate prediction models yield harmful self-fulfilling prophecies
van Amsterdam WAC, van Geloven N, Krijthe JH, et al. When accurate prediction models yield harmful self-fulfilling prophecies. Patterns (N Y) 2025;6(4):101229. doi: 10.1016/j.patter.2025.101229 [published Online First: 20250411]
-
[47]
Binuya MAE, Engelhardt EG, Schats W, et al. Methodological guidance for the evaluation and updating of clinical prediction models: a systematic review. BMC Med Res Methodol 2022;22(1):316. doi: 10.1186/s12874-022-01801-8 [published Online First: 20221212]
-
[48]
Welton NJ, Soares MO, Palmer S, et al. Accounting for Heterogeneity in Relative Treatment Effects for Use in Cost-Effectiveness Models and Value-of-Information Analyses. Medical decision making : an international journal of the Society for Medical Decision Making 2015;35(5):608-21. doi: 10.1177/0272989X15570113 [published Online First: 20150223]
-
[49]
Vickers AJ, Kattan MW, Daniel S. Method for evaluating prediction models that apply the results of randomized trials to individual patients. Trials 2007;8(1):14. doi: 10.1186/1745-6215-8-14 [published Online First: 20070605] 21 Supporting Information Contents Appendix I: Net Benefit ............................................................................
-
[51]
Calculate NBmodel,𝑗𝑗 (𝑚𝑚) = NBmodel(𝜃𝜃𝑗𝑗 (𝑚𝑚)) and NBall,𝑗𝑗 (𝑚𝑚) = NBall(𝜃𝜃𝑗𝑗 (𝑚𝑚))
-
[52]
Store NBmodel,𝑗𝑗 (𝑚𝑚) and NBall,𝑗𝑗 (𝑚𝑚)
-
[53]
After all posterior draws have been processed, calculate ENB� model, j = 1 𝑀𝑀� NBmodel,𝑗𝑗 (𝑚𝑚)𝑀𝑀 𝑚𝑚=1 and ENB� all, j = 1 𝑀𝑀� NBall,𝑗𝑗 (𝑚𝑚)𝑀𝑀 𝑚𝑚=1 . *
-
[54]
* These quantities estimate E𝜓𝜓E𝜃𝜃𝑗𝑗|𝜓𝜓𝑁𝑁𝐵𝐵𝑚𝑚𝑚𝑚𝑚𝑚𝑝𝑝𝑚𝑚,𝑗𝑗 and E𝜓𝜓E𝜃𝜃𝑗𝑗|𝜓𝜓𝑁𝑁𝐵𝐵𝑎𝑎𝑚𝑚𝑚𝑚,𝑗𝑗, respectively, because the marginal posterior 𝑝𝑝(𝜃𝜃𝑗𝑗∣ 𝐷𝐷)integrates over uncertainty in 𝜓𝜓
Finally, estimate NB� 𝑠𝑠𝑚𝑚𝑐𝑐𝑠𝑠𝑝𝑝 𝑝𝑝𝑝𝑝 𝑗𝑗, 𝑠𝑠𝑐𝑐 𝑝𝑝𝑝𝑝𝑝𝑝𝑠𝑠𝑝𝑝 𝑖𝑖𝑠𝑠 𝑝𝑝𝑚𝑚𝑝𝑝𝑚𝑚𝑎𝑎𝑝𝑝𝑖𝑖𝑚𝑚 𝑠𝑠= max�ENB� model, j, ENB� all, j, 0�. * These quantities estimate E𝜓𝜓E𝜃𝜃𝑗𝑗|𝜓𝜓𝑁𝑁𝐵𝐵𝑚𝑚𝑚𝑚𝑚𝑚𝑝𝑝𝑚𝑚,𝑗𝑗 and E𝜓𝜓E𝜃𝜃𝑗𝑗|𝜓𝜓𝑁𝑁𝐵𝐵𝑎𝑎𝑚𝑚𝑚𝑚,𝑗𝑗, respectively, because the marginal posterior 𝑝𝑝(𝜃𝜃𝑗𝑗∣ 𝐷𝐷)integrates over uncertainty in 𝜓𝜓. A lgorithm for estimating 𝐍𝐍𝐍𝐍𝒈𝒈𝒄𝒄𝒊𝒊𝒈𝒈 𝒊𝒊𝒄𝒄, 𝒄𝒄 𝒄𝒄𝒄𝒄𝒄𝒄𝒄𝒄𝒄𝒄...
-
[56]
Given the between-cluster distribution specified by 𝜓𝜓(𝑚𝑚), sample cluster-specific parameters for a hypothetical new cluster 𝜃𝜃𝑗𝑗∗ (𝑚𝑚) ∼ 𝑝𝑝� 𝜃𝜃∣∣ 𝜓𝜓(𝑚𝑚) �
-
[57]
Calculate and store NBmodel,𝑗𝑗∗ (𝑚𝑚) = NBmodel(𝜃𝜃𝑗𝑗∗ (𝑚𝑚)) and NBall,𝑗𝑗∗ (𝑚𝑚) = NBall(𝜃𝜃𝑗𝑗∗ (𝑚𝑚))
-
[58]
After all posterior draws have been processed, calculate ENB� model = 1 𝑀𝑀� NBmodel,𝑗𝑗∗ (𝑚𝑚)𝑀𝑀 𝑚𝑚=1 and ENB� all = 1 𝑀𝑀� NBall,𝑗𝑗∗ (𝑚𝑚)𝑀𝑀 𝑚𝑚=1
-
[59]
A lgorithm for estimating 𝐍𝐍𝐍𝐍𝒄𝒄𝒄𝒄𝒄𝒄𝒄𝒄𝒄𝒄𝒄𝒄𝒄𝒄 𝒋𝒋, 𝒑𝒑𝒄𝒄𝒄𝒄 𝒊𝒊𝒄𝒄𝒄𝒄𝒄𝒄 𝒊𝒊 𝒄𝒄𝒊𝒊 𝒊𝒊𝒄𝒄𝒊𝒊 𝒊𝒊𝒄𝒄𝒊𝒊𝒊𝒊𝒄𝒄 (i.e., for a specific observed cluster j) Fo r 𝑚𝑚= 1, … , 𝑀𝑀 posterior draws:
Finally, estimate NB� 𝑔𝑔𝑚𝑚 𝑚𝑚𝑔𝑔 𝑎𝑎𝑚𝑚, 𝑠𝑠𝑐𝑐 𝑝𝑝𝑝𝑝𝑝𝑝𝑠𝑠𝑝𝑝 𝑖𝑖𝑠𝑠 𝑝𝑝𝑚𝑚𝑝𝑝𝑚𝑚𝑎𝑎𝑝𝑝𝑖𝑖𝑚𝑚 𝑠𝑠= max�ENB� model, ENB� all, 0�. A lgorithm for estimating 𝐍𝐍𝐍𝐍𝒄𝒄𝒄𝒄𝒄𝒄𝒄𝒄𝒄𝒄𝒄𝒄𝒄𝒄 𝒋𝒋, 𝒑𝒑𝒄𝒄𝒄𝒄 𝒊𝒊𝒄𝒄𝒄𝒄𝒄𝒄 𝒊𝒊 𝒄𝒄𝒊𝒊 𝒊𝒊𝒄𝒄𝒊𝒊 𝒊𝒊𝒄𝒄𝒊𝒊𝒊𝒊𝒄𝒄 (i.e., for a specific observed cluster j) Fo r 𝑚𝑚= 1, … , 𝑀𝑀 posterior draws:
-
[60]
Obtain a posterior draw of the cluster-specific parameters 𝜃𝜃𝑗𝑗 (𝑚𝑚) ∼ 𝑝𝑝�𝜃𝜃𝑗𝑗�𝐷𝐷� where 𝑝𝑝� 𝜃𝜃𝑗𝑗∣∣ 𝐷𝐷 � denotes the marginal posterior distribution of 𝜃𝜃𝑗𝑗under the meta-analysis model
-
[61]
Calculate NBmodel,𝑗𝑗 (𝑚𝑚) = NBmodel(𝜃𝜃𝑗𝑗 (𝑚𝑚)), NBall,𝑗𝑗 (𝑚𝑚) = NBall�𝜃𝜃𝑗𝑗 (𝑚𝑚)�,and NBcluster j, perfect information (𝑚𝑚) = max�NBmodel (𝑚𝑚) , NBall (𝑚𝑚), 0�
-
[62]
Store NBcluster j, perfect information (𝑚𝑚)
-
[63]
A lgorithm for estimating 𝐍𝐍𝐍𝐍𝒈𝒈𝒄𝒄𝒊𝒊𝒈𝒈 𝒊𝒊𝒄𝒄, 𝒑𝒑𝒄𝒄𝒄𝒄 𝒊𝒊𝒄𝒄𝒄𝒄𝒄𝒄 𝒊𝒊𝒄𝒄 𝒊𝒊𝒊𝒊𝒄𝒄𝒊𝒊 𝒊𝒊𝒄𝒄𝒊𝒊 𝒊𝒊𝒄𝒄 Fo r 𝑚𝑚= 1, … , 𝑀𝑀 posterior draws:
After all posterior draws have been processed, calculate NB� cluster j, perfect information = 1 𝑀𝑀� NBcluster j, perfect information (𝑚𝑚)𝑀𝑀 𝑚𝑚=1 * 26 * This quantity estimates 𝐸𝐸𝜓𝜓𝐸𝐸𝜃𝜃𝑗𝑗|𝜓𝜓 max�𝑁𝑁𝐵𝐵𝑚𝑚𝑚𝑚𝑚𝑚𝑝𝑝𝑚𝑚,𝑗𝑗, 𝑁𝑁𝐵𝐵𝑎𝑎𝑚𝑚𝑚𝑚,𝑗𝑗, 0�, because the marginal posterior 𝑝𝑝(𝜃𝜃𝑗𝑗∣ 𝐷𝐷)integrates over uncertainty in 𝜓𝜓. A lgorithm for estimating 𝐍𝐍𝐍𝐍𝒈𝒈𝒄𝒄𝒊𝒊𝒈𝒈 𝒊𝒊𝒄𝒄, 𝒑𝒑...
-
[65]
Given the between-cluster distribution specified by 𝜓𝜓(𝑚𝑚), sample cluster- specific parameters 𝜃𝜃𝑗𝑗∗ (𝑚𝑚) ∼ 𝑝𝑝(𝜃𝜃 ∣ 𝜓𝜓(𝑚𝑚))
For 𝑗𝑗∗ = 1, … , 𝐽𝐽∗ hypothetical clusters: a. Given the between-cluster distribution specified by 𝜓𝜓(𝑚𝑚), sample cluster- specific parameters 𝜃𝜃𝑗𝑗∗ (𝑚𝑚) ∼ 𝑝𝑝(𝜃𝜃 ∣ 𝜓𝜓(𝑚𝑚)). b. Calculate NBmodel,𝑗𝑗∗ (𝑚𝑚) = NBmodel(𝜃𝜃𝑗𝑗∗ (𝑚𝑚)) and NBall,𝑗𝑗∗ (𝑚𝑚) = NBall(𝜃𝜃𝑗𝑗∗ (𝑚𝑚))
-
[66]
Calculate the average net benefit across hypothetical clusters: NB‾ model (𝑚𝑚) = 1 𝐽𝐽∗ � NBmodel,𝑗𝑗∗ (𝑚𝑚) 𝐽𝐽∗ 𝑗𝑗∗=1 , NB‾ all (𝑚𝑚) = 1 𝐽𝐽∗ � NBall,𝑗𝑗∗ (𝑚𝑚) 𝐽𝐽∗ 𝑗𝑗∗=1
-
[67]
Under perfect information about 𝜃𝜃 given 𝜓𝜓(𝑚𝑚), determine the optimal global strategy: NBglobal, perfect information (𝑚𝑚) = max�NB‾ model (𝑚𝑚) , NB‾ all (𝑚𝑚), 0�
-
[68]
Store NBglobal, perfect information (𝑚𝑚)
-
[69]
Algorithm for estimating 𝐍𝐍𝐍𝐍𝒄𝒄𝒄𝒄𝒄𝒄𝒄𝒄𝒄𝒄𝒄𝒄𝒄𝒄, 𝒑𝒑 𝒄𝒄𝒄𝒄𝒊𝒊𝒄𝒄𝒄𝒄𝒄𝒄 𝒊𝒊𝒄𝒄 𝒊𝒊𝒊𝒊𝒄𝒄𝒊𝒊 𝒊𝒊𝒄𝒄𝒊𝒊 𝒊𝒊𝒄𝒄 (i.e., for each unobserved cluster j*) Fo r 𝑚𝑚= 1, … , 𝑀𝑀 posterior draws:
After all posterior draws, estimate expected net benefit under perfect information: NB� global, perfect information = 1 𝑀𝑀� NBglobal, perfect (𝑚𝑚) 𝑀𝑀 𝑚𝑚=1 . Algorithm for estimating 𝐍𝐍𝐍𝐍𝒄𝒄𝒄𝒄𝒄𝒄𝒄𝒄𝒄𝒄𝒄𝒄𝒄𝒄, 𝒑𝒑 𝒄𝒄𝒄𝒄𝒊𝒊𝒄𝒄𝒄𝒄𝒄𝒄 𝒊𝒊𝒄𝒄 𝒊𝒊𝒊𝒊𝒄𝒄𝒊𝒊 𝒊𝒊𝒄𝒄𝒊𝒊 𝒊𝒊𝒄𝒄 (i.e., for each unobserved cluster j*) Fo r 𝑚𝑚= 1, … , 𝑀𝑀 posterior draws:
-
[70]
Sample the parameters of the between-cluster model 𝜓𝜓(𝑚𝑚) ∼ 𝑝𝑝(𝜓𝜓|𝐷𝐷)
-
[71]
Given the between-cluster distribution specified by 𝜓𝜓(𝑚𝑚), sample cluster-specific parameters 𝜃𝜃𝑗𝑗∗ (𝑚𝑚) ∼ 𝑝𝑝� 𝜃𝜃∣∣ 𝜓𝜓(𝑚𝑚) �
-
[72]
Calculate NBmodel,𝑗𝑗∗ (𝑚𝑚) = NBmodel(𝜃𝜃𝑗𝑗∗ (𝑚𝑚)) and NBall,𝑗𝑗∗ (𝑚𝑚) = NBall(𝜃𝜃𝑗𝑗∗ (𝑚𝑚))
-
[73]
Determine and store NBcluster 𝑗𝑗∗, perfect information (𝑚𝑚) = max�NBmodel (𝑚𝑚) , NBall (𝑚𝑚), 0�
-
[74]
zhipeiwang/MetaNB
After all posterior draws, estimate expected net benefit under perfect information: 27 NB� cluster, perfect information = 1 𝑀𝑀� NBcluster 𝑗𝑗∗, perfect information (𝑚𝑚) 𝑀𝑀 𝑚𝑚=1 . 28 Appendix IV: R code The package MetaNB to conduct meta-analysis and value of information analysis is available from https://github.com/zhipeiwang/MetaNB. In R, the package can ...
2020
discussion (0)
Sign in with ORCID, Apple, or X to comment. Anyone can read and Pith papers without signing in.