REVIEW 3 major objections 5 minor 72 references
Oscillatory reconnection and resonant response to wave excitation in 2D coronal null points
T0 review · 3 major / 5 minor · reviewed 2026-08-01 · deepseek-v4-flash
Pith's one-line read Each coronal null point imposes its own resonant frequencies on reconnection and on the fast wave trains it emits.
desk verdict Solid MHD parameter study linking oscillatory reconnection periods to resonant-cavity frequencies in stratified coronal null points, with a genuine but fixable caveat about reconnection proxies. read the letter →
The pith
A machine-rendered reading of the paper's core claim, the machinery that carries it, and where it could break.
The reading
What carries the argument
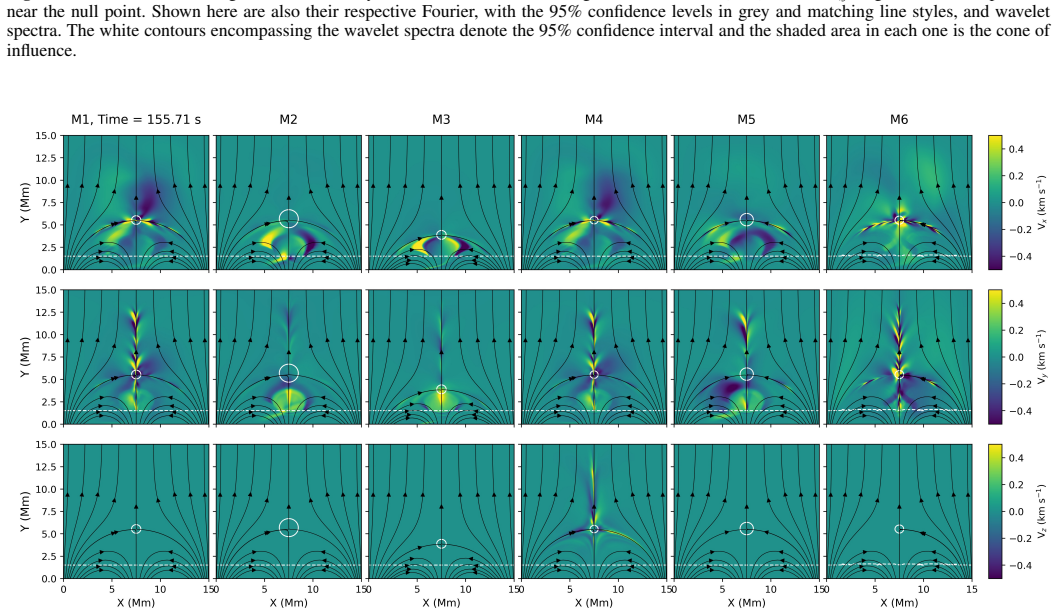
The central object is the null point as a resonant cavity—a region around the magnetic null where the Alfvén speed drops and the background plasma picks out characteristic frequencies. The argument is carried by comparing Fourier and wavelet spectra of two signal families: reconnection proxies (the average out-of-plane current density in a box around the null and the magnetic flux rates across nearby slits, which stand in for the reconnection rate) and wave signals (the velocity components V_x and V_y at the null and along its spine, tracing fast and slow modes). Matching of the dominant spectral peaks between these families, across six models plus a high-resolution check, is the load-bearin
What would settle it
Run the same setup with adaptive mesh refinement resolving the current sheet (or with strong explicit resistivity) and check whether the magnetic flux rate continues to peak at the cavity frequency and whether those peaks coincide in time with actual field-line breakage; if the period follows the driver instead, or if the flux-rate signal disappears without the unresolved sheet, the intrinsic-period claim fails.
Extended reading notes
Core claim
The central claim is that a coronal null point behaves as a resonant cavity whose frequencies are fixed by the background magnetic field, density, and temperature, and that perturbed nulls reconnect periodically at those cavity frequencies rather than at the driver's. Across six setups the dominant peaks in the magnetic flux rates (reconnection-rate proxies) match the dominant peaks in the velocity signals at the null, while the low-frequency driver is weak or absent there. The authors classify the reconnection as oscillatory reconnection, intrinsic to the null point, and show that the fast waves emitted at these frequencies propagate outward, resembling observed quasi-periodic fast-propagat
Load-bearing premise
The simulations do not resolve the thin current sheets where reconnection actually occurs, so the claim that the flux-rate oscillations are genuine oscillatory reconnection—rather than the wave field sloshing at the null—rests on the unproven assumption that the unresolved reconnection behaves as inferred.
Editorial extensions
If this is right
- If the result holds, observed quasi-periodic fast-propagating wave trains can be used to infer the intrinsic reconnection period of the source null point, and through it the local coronal plasma conditions.
- The reconnection period at a null is set by the background plasma rather than by the driver, so flare quasi-periodic pulsations tied to null reconnection should carry this intrinsic signature regardless of the triggering disturbance.
- The frequency matching persists across varied setups—different field strengths, null heights, chromospheric densities, a guide field, and a pseudostreamer-like configuration—so it appears to be a generic property of coronal null points, not a quirk of one model.
- In the 2.5D guide-field model, the Alfvén waves generated by mode conversion away from the null share the same frequencies, extending the cavity imprint to an additional wave channel.
Reading between the lines
- A practical discriminator may emerge from the paper's own data: the external driver frequency is visible in the average current density but not in the flux-rate spectra, so observations that separate these signatures could distinguish externally driven from truly oscillatory reconnection.
- If the causality runs from cavity to reconnection, then the cavity eigenfrequencies should be computable a priori from a reconstructed coronal magnetic field and density; QFP periods observed at a distance could then be checked against such a prediction, effectively turning the null point into a coronal seismometer.
- The 2.5D result suggests that in 3D nulls with a guide field, the Alfvén wave channel could also carry the cavity frequency, enabling multi-wavelength seismology—an extension the paper does not develop.
Editorial analysis
A structured set of objections, weighed in public.
Referee Report
Summary. The paper presents 2D/2.5D ideal (numerical-resistivity) MHD simulations of coronal null points in a stratified atmosphere, driven by a localized velocity pulse at the bottom boundary. Six models (M1–M6) vary the magnetic field strength, density, guide field, and background temperature. The authors measure the dominant frequencies of the velocity signals at the null point and of the reconnection proxies (mean current density and magnetic flux rates across fixed slits, Eqs. 13–15). They report that the flux-rate frequencies match the velocity frequencies (e.g., ~57 and ~64 mHz for M1) and are distinct from a low-frequency (~26 mHz) reflected driver. They interpret this as oscillatory reconnection with a periodicity intrinsic to the null point, and they note that the generated outward-propagating fast waves resemble QFP waves.
Significance. The claimed connection between the null-point resonant cavity and the periodicity of oscillatory reconnection is potentially important for coronal seismology and for interpreting QFP waves: if the reconnection period is set by the ambient plasma rather than by an external driver, observed periods can be used as diagnostics. The paper's strengths are its six-model parameter study, the inclusion of a 2.5D guide-field case, a resolution-convergence test (Appendix A), and an attempt to separate the cavity/reconnection frequencies from the reflected-driver frequency. However, the central interpretation depends on the flux-rate signals being genuinely reconnection-dominated, which is not established at the available resolution.
major comments (3)
- [Sec. 3.1, Eqs. (14)-(15), Fig. 7; Sec. 4, Appendix A] The magnetic flux rates used as reconnection-rate proxies are line integrals of B_x over fixed segments. In ideal MHD these vary with any passing wave, so the detected periodicity is not necessarily due to reconnection. The manuscript explicitly states that the current sheets are not resolved (Sec. 3.1 near Fig. 6; Sec. 4) and that only numerical resistivity is present (Sec. 2). The convergence test in Appendix A doubles the resolution but still leaves current sheets far thicker than the grid scale (5 km), so it does not validate the proxy. The authors need a reconnection-specific diagnostic with a quantitative period—e.g., tracking the X-point position, measuring the change in flux function across the separatrices, or resolving the current sheet with explicit resistivity—before the periodicity can be attributed to oscillatory reconnection.
- [Sec. 3.1-3.2, Fig. 9, Table 2] The central comparison is self-consistent because both the flux-rate frequencies and the velocity frequencies are measured from the same simulation output; the agreement could simply reflect that both diagnostics sample the same cavity wave field. The statement that the ~26 mHz driver is outside the 95% confidence interval does not break this circularity. Moreover, the dominant V_y frequency in several models (≈63-64 mHz for M1, M4, M6) is close to the fundamental of the initial half-sine driver (P=15.58 s, f≈64 mHz), a point not discussed. A control with a different driver waveform/period, or a quantitative comparison with the independent semi-empirical formula of Karampelas et al. (2023), is needed to support the claim that the period is intrinsic to the null point.
- [Figs. 5 and 7] The 95% confidence levels are central to the claim that the low-frequency driver is outside the confidence interval, but their construction is not described. Please specify the null hypothesis (e.g., red-noise AR(1) for wavelet spectra), the degrees of freedom, and the treatment of multiple independent frequencies, so that the significance statements can be checked.
minor comments (5)
- [Table 2] The header 'Vx f0 Vx f0' should be 'Vx f0 Vy f0'.
- [Sec. 4] Typo: 'magnetoaccoustic' should be 'magnetoacoustic'; also 'does not much that' should be 'does not match that'.
- [Sec. 3.1, Fig. 7 caption] 'current density density' should be 'current density'.
- [Appendix A] The flux rates for M1hr are evaluated at X=7.3 Mm, whereas Eq. (14) in the main text uses X=7.4 Mm; please clarify whether this is intentional.
- [Sec. 2] The assumption that the unresolved transition region can be treated as a semi-elastic wall is an important modeling approximation; the resolution study provides indirect support, but this simplification should be explicitly listed as a limitation.
Circularity Check
The flux-rate reconnection proxy inherits wave frequencies via Faraday's law, so the claimed frequency match is partly by construction; independent field-line evidence remains qualitative.
-
other
[Section 3.1, Eqs. (14)-(15), Fig. 7; Table 2]
"Our setup does not have the necessary resolution to properly resolve the generated current sheets and the reconnection dynamics. ... The magnetic flux rates, being the equivalent of the reconnection rate (McLaughlin et al. 2009; Tarr & Linton 2019), trace the evolution of the magnetic field as the latter is “pushed” by the lateral movement of the separatrices due to the periodic reconnection."
Eq. (14) defines Φ̇_B(X)=d/dt∫B_x dY. In 2D ideal MHD, ∂B_x/∂t = -∂(v_y B_x - v_x B_y)/∂y, so Φ̇_B(X) is, up to sign, (v_y B_x - v_x B_y) evaluated at the two slit endpoints. Thus the Fourier peaks of Φ̇_B are linear functionals of the local V_x,V_y wave signals at the slit. The paper then compares these peaks with V_x/V_y at the null and reports matching frequencies (Table 2) as evidence that the null 'imposes' its frequency on reconnection. But any wave train passing the slit produces those same frequencies in Φ̇_B even without reconnection. Since the current sheet is explicitly unresolved, the quantitative frequency match is built into the diagnostic rather than independently measuring reconnection periodicity. Field-line topology (Fig. 6) is more reconnection-specific, but it is qualit
full rationale
The self-citations (Santamaria & Van Doorsselaere 2018; Karampelas et al. 2022a,b, 2023) are used for context and seismological framing rather than as the load-bearing derivation of the central match, so they do not by themselves raise the circularity score. The central reduction is diagnostic: the magnetic flux rates used as 'reconnection rates' are time derivatives of line integrals of B, which in ideal MHD equal combinations of the local velocity components at the slit boundaries. Hence the dominant frequencies of Φ̇_B are expected to coincide with those of V_x,V_y even if no reconnection occurs. The paper's own admission that current sheets are not resolved makes this proxy the only quantitative reconnection diagnostic, and its agreement with the cavity-wave frequencies is therefore partly a consequence of the diagnostic's construction rather than an independent confirmation that the null point imposes its period on reconnection. Some independent content remains: the low-frequency driver (~26 mHz) is excluded from the flux-rate spectra, the field-line topology shows qualitative periodic reconnection, and the model-to-model variation in Table 2 is not a simple fit. The result is partial circularity rather than a fully forced derivation, so the score is 6.
Assumptions & free parameters
assumptions (6)
- domain assumption The compressible MHD equations with an ideal gas hydrogen plasma adequately describe the wave–null point interaction in the solar corona.
- domain assumption The potential magnetic field with an X-point null (Eqs. 8–9) is a reasonable representation of coronal magnetic topology, and the stratification chosen (Eqs. 5–7) is a valid background.
- domain assumption Effective numerical resistivity behaves like physical resistivity for the purpose of the reconnection period.
- ad hoc to paper The unresolved transition region acts as a semi-elastic wall that reflects waves, and its unresolved structure does not corrupt the cavity frequencies.
- domain assumption The wave identifiers C|| and C⊥ (Eqs. 11–12) map onto the slow and fast MHD modes in low-beta plasma.
- standard math Fourier peaks above the 95% confidence level represent genuine periodicities in the finite-time simulation signals.
Cite this review
Pith. "Pith review of Oscillatory reconnection and resonant response to wave excitation in 2D coronal null points." pith.science (2026). https://pith.science/paper/6DNR7SDU
@misc{pith2026260719978,
  author       = {Pith},
  title        = {Pith review of: Oscillatory reconnection and resonant response to wave excitation in 2D coronal null points},
  year         = {2026},
  howpublished = {\url{https://pith.science/paper/6DNR7SDU}},
  note         = {Machine review of arXiv:2607.19978}
}
abstract
Null points are magnetic field singularities, where the magnetic field strength rapidly drops to zero. In the solar atmosphere, null points are known sites of magnetic reconnection and wave generation and are associated with highly energetic phenomena, such as flares. The aim of this study is to explore the connection between the properties of oscillatory reconnection at null points and the latter's nature as resonant cavities for waves. We perform a set of 2D and 2.5D magnetohydrodynamics simulations of single null points in a stratified solar atmosphere, using the PLUTO code. We perturb each null point through a single propagating pulse and its reflections from the bottom boundary, hitting the null point in an asymmetrical fashion. This leads to both periodic reconnection events and wave refraction around the null point. We find that each null point imposes frequencies on the reconnection matching those of the waves generated from the individual resonant cavity. These frequencies also differ from those excited by the low frequency driver of the reflected waves returning to the null point, the latter lying outside the $95\%$ confidence interval. As such, excited periodic reconnection can be characterised as oscillatory reconnection, i.e. with properties intrinsic to the null points. Finally, the generated waves at the null propagate across the domain, reminiscent of the observed quasi-periodic fast-propagating waves. We provide results showing a direct connection between oscillatory reconnection and the generated high-frequency wavetrains at null points in the solar corona. The propagating waves generated at the resonant cavity, reminiscent of the observed quasi-periodic fast-propagating waves can provide us a diagnostic tool for the reconnection process at the null point and the coronal plasma conditions.
Figures


Figures from the paper (8 more)




Reference graph
Works this paper leans on
-
[1]
Aschwanden, M. J. & Schrijver, C. J. 2002, ApJS, 142, 269
2002
-
[2]
M., Thomas, A
Broomhall, A. M., Thomas, A. E. L., Pugh, C. E., Pye, J. P., & Rosen, S. R. 2019, A&A, 629, A147
2019
-
[3]
Brown, D. S. & Priest, E. R. 2001, A&A, 367, 339
2001
-
[4]
V ., Shasharina, S
Bulanov, S. V ., Shasharina, S. G., & Pegoraro, F. 1992, Plasma Physics and Con- trolled Fusion, 34, 33
1992
-
[5]
Bulanov, S. V . & Syrovatskii, S. I. 1980, Fizika Plazmy, 6, 1205
1980
-
[6]
R., Li, H
Cheng, X., Priest, E. R., Li, H. T., et al. 2023, Nature Communications, 14, 2107
2023
-
[7]
P., Hayes, L
Clarke, B. P., Hayes, L. A., Gallagher, P. T., Maloney, S. A., & Carley, E. P. 2021, ApJ, 910, 123 Article number, page 12 of 15 Karampelas & Van Doorsselaere: Oscillatory reconnection and resonance at coronal null points
2021
-
[8]
Craig, I. J. D. & McClymont, A. N. 1991, ApJ, 371, L41
1991
Show all 72 references
-
[9]
Cranmer, S. R. 2018, ApJ, 862, 6
2018
-
[10]
A., & De Moortel, I
Enerhaug, E., Howson, T. A., & De Moortel, I. 2024, A&A, 681, L11
2024
-
[11]
M., & Arber, T
Gruszecki, M., Vasheghani Farahani, S., Nakariakov, V . M., & Arber, T. D. 2011, A&A, 531, A63
2011
-
[12]
Hassam, A. B. & Lambert, R. P. 1996, ApJ, 472, 832
1996
-
[13]
2009, ApJ, 705, L217
He, J., Marsch, E., Tu, C., & Tian, H. 2009, ApJ, 705, L217
2009
-
[14]
Heggland, L., De Pontieu, B., & Hansteen, V . H. 2009, ApJ, 702, 1
2009
-
[15]
Hood, A. W. & Hughes, D. W. 2011, Physics of the Earth and Planetary Interiors, 187, 78 Jelínek, P., Karlický, M., & Murawski, K. 2015, ApJ, 812, 105
2011
-
[16]
A., Botha, G
Karampelas, K., McLaughlin, J. A., Botha, G. J. J., & Régnier, S. 2023, ApJ, 943, 131
2023
-
[17]
T., DeV ore, C
Karpen, J. T., DeV ore, C. R., Antiochos, S. K., & Pariat, E. 2017, ApJ, 834, 62
2017
-
[18]
M., & Cho, K.-S
Kumar, P., Nakariakov, V . M., & Cho, K.-S. 2017, ApJ, 844, 149
2017
-
[19]
M., Karpen, J
Kumar, P., Nakariakov, V . M., Karpen, J. T., & Cho, K.-S. 2024, Nature Com- munications, 15, 2667
2024
-
[20]
2020, Solar- Terrestrial Physics, 6, 3
Kupriyanova, E., Kolotkov, D., Nakariakov, V ., & Kaufman, A. 2020, Solar- Terrestrial Physics, 6, 3
2020
-
[21]
G., Kashapova, L
Kupriyanova, E. G., Kashapova, L. K., Reid, H. A. S., & Myagkova, I. N. 2016, Sol. Phys., 291, 3427
2016
-
[22]
2005, ApJ, 624, 392
Landi, S., Velli, M., & Einaudi, G. 2005, ApJ, 624, 392
2005
-
[23]
& Chen, W
Li, D. & Chen, W. 2022, ApJ, 931, L28
2022
-
[24]
2021, ApJ, 921, 179
Li, D., Ge, M., Dominique, M., et al. 2021, ApJ, 921, 179
2021
-
[25]
2020, ApJ, 893, 7
Li, D., Lu, L., Ning, Z., et al. 2020, ApJ, 893, 7
2020
-
[26]
2022, Frontiers in Astronomy and Space Sciences, 9, 1032099
Li, D., Shi, F., Zhao, H., et al. 2022, Frontiers in Astronomy and Space Sciences, 9, 1032099
2022
-
[27]
2018, ApJ, 868, L33
Li, L., Zhang, J., Peter, H., et al. 2018, ApJ, 868, L33
2018
-
[28]
M., Zhao, J., et al
Liu, W., Title, A. M., Zhao, J., et al. 2011, ApJ, 736, L13
2011
-
[29]
Longcope, D. W. 2005, Living Reviews in Solar Physics, 2, 7
2005
-
[30]
Longcope, D. W. & Priest, E. R. 2007, Physics of Plasmas, 14, 122905
2007
-
[31]
J., Edmondson, J
Lynch, B. J., Edmondson, J. K., & Li, Y . 2014, Sol. Phys., 289, 3043
2014
-
[32]
2020, A&A, 636, A96
Mancuso, S., Barghini, D., & Telloni, D. 2020, A&A, 636, A96
2020
-
[33]
G., Shah, N., & Thyagaraja, A
McClements, K. G., Shah, N., & Thyagaraja, A. 2006, Journal of Plasma Physics, 72, 571
2006
-
[34]
A., De Moortel, I., Hood, A
McLaughlin, J. A., De Moortel, I., Hood, A. W., & Brady, C. S. 2009, A&A, 493, 227
2009
-
[35]
McLaughlin, J. A. & Hood, A. W. 2004, A&A, 420, 1129
2004
-
[36]
McLaughlin, J. A. & Hood, A. W. 2006, A&A, 459, 641
2006
-
[37]
A., Hood, A
McLaughlin, J. A., Hood, A. W., & de Moortel, I. 2011, Space Sci. Rev., 158, 205
2011
-
[38]
A., Nakariakov, V
McLaughlin, J. A., Nakariakov, V . M., Dominique, M., Jelínek, P., & Takasao, S. 2018, Space Sci. Rev., 214, 45
2018
-
[39]
2007, ApJS, 170, 228
Mignone, A., Bodo, G., Massaglia, S., et al. 2007, ApJS, 170, 228
2007
-
[40]
K., Pontin, D
Mondal, S., Srivastava, A. K., Pontin, D. I., et al. 2024, ApJ, 977, 235
2024
-
[41]
V ., & Nakariakov, V
Murawski, K., Zaqarashvili, T. V ., & Nakariakov, V . M. 2011, A&A, 533, A18
2011
-
[42]
J., van Driel-Gesztelyi, L., & Baker, D
Murray, M. J., van Driel-Gesztelyi, L., & Baker, D. 2009, A&A, 494, 329
2009
-
[43]
M., Foullon, C., Verwichte, E., & Young, N
Nakariakov, V . M., Foullon, C., Verwichte, E., & Young, N. P. 2006, A&A, 452, 343
2006
-
[44]
Nakariakov, V . M. & Roberts, B. 1995, Sol. Phys., 159, 399
1995
-
[45]
2008, ApJ, 683, L83
Nishizuka, N., Shimizu, M., Nakamura, T., et al. 2008, ApJ, 683, L83
2008
-
[46]
Parker, E. N. 1957, J. Geophys. Res., 62, 509
1957
-
[47]
Petschek, H. E. 1964, Magnetic Field Annihilation, ed. W. N. Hess, V ol. 50 (Washington, DC: NASA), 425
1964
-
[48]
Pontin, D. I. 2011, Advances in Space Research, 47, 1508
2011
-
[49]
Pontin, D. I. & Priest, E. R. 2022, Living Reviews in Solar Physics, 19, 1
2022
-
[50]
& Forbes, T
Priest, E. & Forbes, T. 2000, Magnetic Reconnection, ed. E. Priest & T. Forbes (Cambridge, UK: Cambridge University Press)
2000
-
[51]
2022, Thesis, Monash University, doi:10.26180/19233735.v1
Raboonik, A. 2022, Thesis, Monash University, doi:10.26180/19233735.v1
2022 doi
-
[52]
G., & Doyle, L
Ramsay, G., Kolotkov, D., Doyle, J. G., & Doyle, L. 2021, Sol. Phys., 296, 162 Régnier, S., Parnell, C. E., & Haynes, A. L. 2008, A&A, 484, L47
2021
-
[53]
C., Khomenko, E., & Collados, M
Santamaria, I. C., Khomenko, E., & Collados, M. 2015, A&A, 577, A70
2015
-
[54]
C., Khomenko, E., Collados, M., & de Vicente, A
Santamaria, I. C., Khomenko, E., Collados, M., & de Vicente, A. 2016, A&A, 590, L3
2016
-
[55]
C., Khomenko, E., Collados, M., & de Vicente, A
Santamaria, I. C., Khomenko, E., Collados, M., & de Vicente, A. 2017, A&A, 602, A43
2017
-
[56]
Santamaria, I. C. & Van Doorsselaere, T. 2018, A&A, 611, A10
2018
-
[57]
Schiavo, L. A. C. A., Botha, G. J. J., & McLaughlin, J. A. 2024, ApJ, 975, 10
2024
-
[58]
Schiavo, L. A. C. A., Botha, G. J. J., & McLaughlin, J. A. 2026, ApJ, 999, 50
2026
-
[59]
2018, ApJ, 853, 1
Shen, Y ., Liu, Y ., Song, T., & Tian, Z. 2018, ApJ, 853, 1
2018
-
[60]
2022, Research in Astronomy and Astrophysics, 22, 105017
Shi, F., Ning, Z., & Li, D. 2022, Research in Astronomy and Astrophysics, 22, 105017
2022
-
[61]
& Magara, T
Shibata, K. & Magara, T. 2011, Living Reviews in Solar Physics, 8, 6
2011
-
[62]
K., Mondal, S., Priest, E
Srivastava, A. K., Mondal, S., Priest, E. R., et al. 2025, ApJ, 984, 36
2025
-
[63]
Sweet, P. A. 1958, in IAU Symp. 6, Electromagnetic Phenomena in Cosmical Physics, ed. B. Lehnert, V ol. 6 (Cambridge: Cambridge Univ. Press), 123
1958
-
[64]
A., Botha, G
Talbot, J., McLaughlin, J. A., Botha, G. J. J., & Hancock, M. 2024, ApJ, 965, 133
2024
-
[65]
Tarr, L. A. & Linton, M. 2019, ApJ, 879, 127
2019
-
[66]
A., Linton, M., & Leake, J
Tarr, L. A., Linton, M., & Leake, J. 2017, ApJ, 837, 94
2017
-
[67]
Thurgood, J. O. & McLaughlin, J. A. 2012, A&A, 545, A9
2012
-
[68]
O., Pontin, D
Thurgood, J. O., Pontin, D. I., & McLaughlin, J. A. 2017, ApJ, 844, 2 Van Doorsselaere, T., Kupriyanova, E. G., & Yuan, D. 2016, Sol. Phys., 291, 3143
2017
-
[69]
2019, ApJ, 884, 160
Vida, K., Oláh, K., K˝ovári, Z., et al. 2019, ApJ, 884, 160
2019
-
[70]
2025, arXiv e-prints, arXiv:2505.24335
Wang, Y ., Ni, L., Cheng, G., et al. 2025, arXiv e-prints, arXiv:2505.24335
2025 arXiv
-
[71]
M., Cécere, M., & Costa, A
Zhong, Y ., Nakariakov, V . M., Cécere, M., & Costa, A. 2026, ApJ, 1004, 28
2026
-
[72]
V ., McLaughlin, J
Zimovets, I. V ., McLaughlin, J. A., Srivastava, A. K., et al. 2021, Space Sci. Rev., 217, 66 Article number, page 13 of 15 A&A proofs:manuscript no. paper Appendix A: High resolution run for M1 model Fig. A.1.Close-up snapshots of theJ z current density at the null point duri...
2021
Reviewed August 1, 2026 · model on record in the stance chip above.
Discussion (0). Continue with ORCID to comment.