REVIEW 4 major objections 5 minor 21 references
Improving Solar Flare Nowcasting with the Hot Onset Precursor Event (HOPE) Technique
T0 review · 4 major / 5 minor · reviewed 2026-08-05 · deepseek-v4-flash
Pith's one-line read HOPE technique issues flare alerts 5-15 minutes early
desk verdict The DAXSS abundance-factor trends are a real step forward, but the nowcasting lead-time claim sits on an in-sample grid search and no false-alarm test. read the letter →
The pith
A machine-rendered reading of the paper's core claim, the machinery that carries it, and where it could break.
The reading
What carries the argument
The HOPE running-difference trigger. From 180-second running differences of the GOES XRS-A and XRS-B channels, the algorithm derives a difference ratio, converts it into an isothermal plasma temperature and emission measure using the ratio method, and fires when ΔEM > 5e-3 (10^49 cm^-3) and ΔT > 5 MK. A second feature, the local maximum of the second time-derivative of ΔEM, supplies a later but stronger magnitude estimate. Supporting the physics, DAXSS spectral fits show the hot 10-15 MK component and low-FIP abundance factors (Mg, Si, Fe) falling from coronal toward photospheric values during HOPE, consistent with chromospheric evaporation feeding the hot onset.
What would settle it
Run the tuned algorithm on continuous GOES XRS data covering several months, including flare-free intervals and flares not among the 137; count false alerts and measure trigger-to-peak lead times. If recall on new flares drops well below 0.95 or false triggers occur at a rate that makes operational alerts useless, the central nowcasting claim fails.
Extended reading notes
Core claim
The central claim is that the hot onset precursor is a usable nowcasting signal, not just a curiosity. Before hard X-rays ramp up, GOES soft X-ray channels already show a 10-15 MK component with an order-of-magnitude emission-measure rise, and this is visible in running differences of the two channels. The authors reduce it to a trigger: with 180-second running differences of XRS-A and XRS-B, convert the difference ratio to an isothermal temperature and emission measure, and flag a flare when ΔEM > 5e-3 (10^49 cm^-3) and ΔT > 5 MK. Across 137 flares (C5.0-X7.1) the trigger fires before the peak in all magnitude bins, with mean lead times of 3.5, 5.4, and 9.4 minutes, and an overall recall of
Load-bearing premise
The method's trigger settings were tuned on the same 137 flares used to score it, so the claim assumes those settings will work on flares not in that sample--and no flare-free periods were tested for false alarms.
Editorial extensions
If this is right
- X1+ flares get a first HOPE alert a mean 9.4 minutes before the soft X-ray peak, and the HOPE X-flare alert fires a mean 2.2 minutes before the current R3 radio-blackout alert, giving HF-communications operators a few extra minutes of notice.
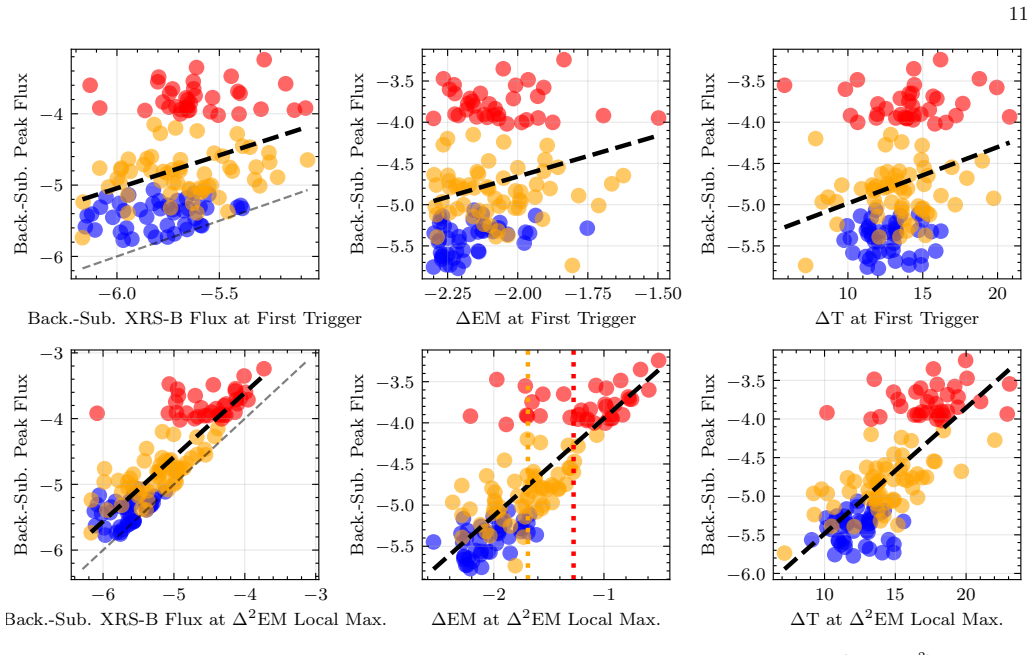
- The emission-measure value at the second-derivative local maximum correlates with log peak flux (R2 = 0.62), so a HOPE-based system can issue an approximate flare-magnitude estimate at onset, not just a yes/no alert.
- Lead time grows with flare class, meaning the largest, most damaging flares are precisely the ones that produce the earliest HOPE alerts.
- The same running-difference trigger could replace or precede existing SXR-slope flare-campaign triggers on spacecraft, letting observations start before the impulsive phase.
Reading between the lines
- The headline metrics are in-sample: thresholds were selected on the same 137 flares used for evaluation, so out-of-sample recall and lead times will probably be lower, and false alarms on non-flare intervals were not measured.
- First-trigger magnitude correlations are weak (R2 about 0.1), so practical magnitude prediction likely needs the later second-derivative point or a multi-point time-history model rather than a single onset snapshot.
- The same running-difference ratio logic should transfer to any two-passband SXR or EUV measurement; a spatially resolved imaging spectrometer could localize the flaring region while predicting its onset.
Editorial analysis
A structured set of objections, weighed in public.
Referee Report
Summary. The paper studies the Hot Onset Precursor Event (HOPE) phase of solar flares using two datasets: DAXSS SXR spectra of 25 flares and GOES-XRS irradiance of 137 flares. It reports statistical properties of temperature, emission measure, and low-FIP abundance factors during the HOPE phase, and then proposes a nowcasting algorithm based on running-difference GOES-XRS fluxes. The algorithm triggers when the running-difference emission measure exceeds ΔEM and the running-difference temperature exceeds ΔT_min, with parameters tuned by a grid search. The headline results are a total recall of 0.95, an R² of 0.62 between onset ΔEM and peak flux, and mean trigger-to-peak times of roughly 3–9 minutes depending on flare class. The authors also derive an early R3 radio-blackout alert threshold from the 95th percentile of M-class ΔEM values. The DAXSS abundance analysis and the transparent parameter sweep are useful, but the central nowcasting claim is compromised by the fact that all reported performance metrics are computed on the same dataset used to select the algorithm parameters.
Significance. If the reported performance survived out-of-sample testing, HOPE-based nowcasting would be a practically valuable space-weather tool, offering a few minutes of advance warning before flare peak and before NOAA R3 alerts. The paper's strengths include the use of publicly available GOES and DAXSS data, the standard and reproducible XRS ratio method, a clearly documented APEC spectral fitting approach, and full disclosure of the parameter grid results in Appendix A and Table 5. The DAXSS abundance-factor trends are an interesting contribution independent of the nowcasting claim. However, as written, the nowcasting results are in-sample fits: thresholds are selected and evaluated on the same 137-flare sample, and no false-alarm or quiet-time analysis is provided. The central operational claim is therefore not currently established.
major comments (4)
- [Appendix A, Eq. (A1), Table 5] The reported Recall=0.95 and R²=0.62 are in-sample metrics. The grid search iterates over 135 parameter combinations on the same 137-flare dataset and selects the parameters (t_int=60 s, t_diff=180 s, ΔEM=0.005, ΔT_min=5 MK) by maximizing the score S in Eq. (A1), which includes Recall, R², and normalized alert times. Therefore the headline numbers are not independent predictions; they are fitted quantities. A held-out set, cross-validation, or pre-specified thresholds is required before the nowcasting performance claim can be accepted.
- [Section 3.2, Figure 6, Figure 7] The early R3 alert threshold is also derived from the same sample: it is the 95th percentile of the running-difference emission measure for M-class flares in the 137-flare dataset. Consequently the lead-time histograms in Figure 7, showing 6.18 and 2.21 minutes before the NOAA R3 alert, are not out-of-sample. The X-flare alert threshold must be fixed independently or validated on an unseen sample before the early-warning claim is meaningful.
- [Section 3.2, Table 2, Abstract] The abstract states that the algorithm 'consistently' predicts flares 5–15 minutes ahead of peak across the three categories, but Table 2 gives mean trigger-to-peak times of 3.46±2.26 minutes for C5.0–M1.0, 5.39±3.86 minutes for M1.0–X1.0, and 9.38±4.49 minutes for X1.0+. The C-class lead time is substantially below the stated 5-minute lower bound. The abstract overstates the evidence in the manuscript.
- [Section 2.4, Section 4] No false-alarm or quiet-time analysis is presented. The algorithm is run only on known flare intervals, so the rate at which the same thresholds would trigger on non-flare background, gradual variations, or GOES data artifacts is unknown. A nowcasting system's utility depends on both recall and false-alarm rate; without the latter, the operational claim is incomplete even if the in-sample recall were valid.
minor comments (5)
- [Section 4, Figure 7] The text refers to an X2.8 flare on 2024-05-07, while the Figure 7 caption says 2024-05-27. Please correct the date inconsistency.
- [Introduction] There is a typo: 'device relevant protection strategies' should be 'devise relevant protection strategies'.
- [Section 4] The phrase 'monitered by GOES-XRS channel B' should be 'monitored'.
- [Section 3.1] 'beacase of line-blending' should be 'because of line-blending'.
- [Table 3] The low R² values at first trigger (0.05–0.11) are acknowledged in the text, but the phrase 'approximate flare magnitude prediction' in the abstract is still stronger than the first-trigger evidence supports; consider adding an explicit caveat that useful magnitude correlation appears only near the Δ²EM local maximum.
Circularity Check
Performance metrics are in-sample: the grid search over algorithm thresholds uses the same 137-flare dataset that is later reported as the algorithm's recall, R², and lead times; the R3 alert threshold is likewise tuned and evaluated on the same sample.
-
fitted input called prediction
[Appendix A / Table 5 / Section 3.2 / eq. A1]
"The methodology followed for this analysis was to run the nowcasting algorithm for the same dataset of 137 flares used in this study, iterating through different combination of parameters to find the set that predicts flare alerts most accurately... The row with the highest score (=0.79, highlighted in bold) was used for this study, with the input parameters of t_i = 60 seconds, t_d = 3ti, ΔEM= 0.005, and ΔT_min = 5MK that resulted in a Total Recall of 0.95, an Emission Measure correlation (R²) of 0.62, and a mean time difference for X-class flares of 9.38 minutes."
The score S (eq. A1) that selects the parameters is a weighted sum of Recall, R², and mean alert times T_A, all computed on the same 137-flare sample. The headline reported metrics — Recall=0.95, R²=0.62, and the 9.38-minute X-class lead time — are exactly the objective values used to pick the thresholds. Thus the reported prediction performance is an in-sample fit of the tuning criterion, not an out-of-sample evaluation.
-
fitted input called prediction
[Section 3.2 / Figure 6 / Figure 7]
"The minimum threshold is computed using the correlation plots in Figure 6, by taking the 95th percentile level of (ΔEM) for category (b) flares (M1.0 - X1.0)... The right panel of Figure 7 shows a histogram of the time difference between the R3 radio blackout alert and the X-class flare alert raised using the HOPE-based nowcasting method. The mean of this time difference is 2.21 minutes with a standard deviation of 1.59 minutes."
The X-flare (R3) alert threshold is defined as the 95th percentile of ΔEM measured on the same category-(b) M-class sample, and then the lead-time statistics relative to NOAA R3 (mean 2.21 min) are computed on the same category-(c) X-class flares. The threshold is derived from and evaluated on the same events, so the claimed 'early R3 alert' lead time is a fitted, in-sample quantity rather than a prediction on unseen flares. No non-flare control intervals are tested, so false-alarm behavior is unmeasured.
full rationale
The paper's physical characterization of HOPE plasma parameters is externally grounded: DAXSS temperatures/EM/abundances come from APEC spectral fitting, and the HOPE phenomenon itself is anchored to independent work (Hudson et al. 2021; Battaglia et al. 2023; da Silva et al. 2023). The nowcasting algorithm's conceptual basis (running-difference temperature and emission-measure thresholds) is also taken from an external author (Hudson 2025), not from the present authors' prior work, so no self-citation chain forces the result. However, the central quantitative nowcasting claims — 5-15 minute lead times, Recall=0.95, R²=0.62, and early-R3 warnings — are all computed on the same 137-flare dataset used to tune the algorithm parameters via the grid search of Appendix A (Table 5, score S of eq. A1). Choosing the parameter set that maximizes an in-sample score and then reporting those same in-sample values as algorithm performance is a fitted input reported as prediction. The R3 threshold is likewise the 95th percentile of the same M-class sample, with the lead-time histograms drawn from the same X-class events. Because there is no held-out subset and no non-flare control, the operational nowcasting performance is not yet empirically distinguished from an in-sample fit. This is partial circularity (score 6): the underlying HOPE physics is independent, but the headline predictive metrics reduce, at least in part, to the tuning objective.
Assumptions & free parameters
free parameters (6)
- XRS flux integration time t_int =
60 seconds
- Running-difference time t_diff =
180 seconds (3 x t_int)
- Emission measure threshold Delta EM =
0.005 x 10^49 cm^-3
- Temperature threshold Delta T_min =
5 MK
- Scoring weights w_recall, w_R2, w_TA =
0.5, 0.4, 0.033 each
- X-class alert Delta EM threshold =
95th percentile of category (b) Delta EM, exact value not stated in text
assumptions (4)
- domain assumption The GOES-XRS XRS-A/XRS-B ratio uniquely gives isothermal temperature and emission measure via the polynomial equations (1)-(3) and an assumed spectral model.
- domain assumption A 3-temperature APEC/vvapec model with tied abundances accurately represents DAXSS SXR spectra, with the hottest component tracking the HOPE phase.
- domain assumption Running-difference fluxes over 180 seconds remove the background and isolate the flaring plasma's changes in temperature and emission measure.
- domain assumption HOPE-phase temperature and emission measure rises precede and signal an impending impulsive peak for essentially all flares above C5.0.
Cite this review
Pith. "Pith review of Improving Solar Flare Nowcasting with the Hot Onset Precursor Event (HOPE) Technique." pith.science (2026). https://pith.science/paper/6HLEJFGB
@misc{pith2026250905234,
  author       = {Pith},
  title        = {Pith review of: Improving Solar Flare Nowcasting with the Hot Onset Precursor Event (HOPE) Technique},
  year         = {2026},
  howpublished = {\url{https://pith.science/paper/6HLEJFGB}},
  note         = {Machine review of arXiv:2509.05234}
}
read the original abstract
This study investigates the statistical behavior of plasma properties during Hot Onset Precursor Events (HOPEs) of solar flares and evaluates their potential for improving flare nowcasting. Two datasets are analyzed: (a) new Soft X-Ray (SXR) spectra of 25 flares (C2.6 to M1.0) obtained from the Dual-zone Aperture X-ray Solar Spectrometer (DAXSS), and (b) SXR irradiance data from 137 flares (C5.0 to X7.1) recorded by the X-Ray Sensor on the Geostationary Operational Environmental Satellite (GOES-XRS). Plasma temperature, emission measure (EM), and low First Ionization Potential (e.g., Mg, Si, Fe) elemental abundance factors (AFs) are derived from DAXSS using Astrophysical Plasma Emission Code model fitting. Isothermal plasma temperature and emission measure are derived from GOES-XRS using the XRS-A/XRS-B ratio method. Results indicate that the HOPE phase exhibits elevated temperatures (10-15 MK) and an order-of-magnitude increase in EM before the impulsive phase. Elemental AFs show a transition from coronal to photospheric values as the flare progresses. Using GOES-XRS data, we develop an improved nowcasting algorithm that detects flares utilizing HOPE signatures. The algorithm is tested across three categories of flares (C5.0-M1.0, M1.0-X1.0, and X1.0+), consistently predicting flare alerts 5-15 minutes ahead of the flare peak. We also explore the possibility of approximate flare magnitude prediction, by calculating correlation between onset parameters and flare peak magnitude. This HOPE-based system shows potential for earlier warnings than current NOAA R3 alerts, which could be useful for High-frequency communication systems operators and targeted flare observation campaigns.
Figures


Figures from the paper (5 more)




Reference graph
Works this paper leans on
-
[1]
, " * write output.state after.block = add.period write newline
ENTRY address archivePrefix author booktitle chapter doi edition editor eprint howpublished institution journal key month number organization pages publisher school series title misctitle type volume year version url label extra.label sort.label short.list INTEGERS output.state before.all mid.sentence after.sentence after.block FUNCTION init.state.consts ...
-
[2]
write newline
" write newline "" before.all 'output.state := FUNCTION format.url url empty "" new.block "" url * "" * if FUNCTION format.eprint eprint empty "" archivePrefix empty "" archivePrefix "arXiv" = new.block " " eprint * " " * new.block " " eprint * " " * if if if FUNCTION format.doi doi empty "" " " doi * " " * if FUNCTION format.pid doi empty eprint empty ur...
-
[4]
Arnaud, K. A. 1996, title XSPEC : The First Ten Years , 101, 17. https://ui.adsabs.harvard.edu/abs/1996ASPC..101...17A
work page 1996
-
[5]
F., Hudson, H., Warmuth, A., et al
Battaglia, A. F., Hudson, H., Warmuth, A., et al. 2023, title The existence of hot X -ray onsets in solar flares, Astronomy & Astrophysics, 679, A139, 10.1051/0004-6361/202347706
-
[6]
Chancellor, J. C., Scott, G. B. I., & Sutton, J. P. 2014, title Space Radiation : The Number One Risk to Astronaut Health beyond Low Earth Orbit , Life : Open Access Journal, 4, 491, 10.3390/life4030491
-
[7]
Chandran, A., Fang, T.-W., Chang, L., et al. 2021, title The INSPIRESat -1: Mission , science, and engineering, Advances in Space Research, 68, 2616, 10.1016/j.asr.2021.06.025
-
[8]
Curto, J. J. 2020, title Geomagnetic solar flare effects: a review, Journal of Space Weather and Space Climate, 10, 27, 10.1051/swsc/2020027
arXiv 2020
-
[9]
da Silva, D. F., Hui, L., Simões, P. J. A., et al. 2023, title Statistical analysis of the onset temperature of solar flares in 2010–2011, Monthly Notices of the Royal Astronomical Society, 525, 4143, 10.1093/mnras/stad2244
Show all 21 references
-
[10]
R., Ji, L., Smith, R
Foster, A. R., Ji, L., Smith, R. K., & Brickhouse, N. S. 2012, title UPDATED ATOMIC DATA AND CALCULATIONS FOR X - RAY SPECTROSCOPY , The Astrophysical Journal, 756, 128, 10.1088/0004-637X/756/2/128
2012 doi
-
[11]
A., Woodraska, D., & Woods, T
Hock, R. A., Woodraska, D., & Woods, T. N. 2013, title Using SDO EVE data as a proxy for GOES XRS B 1–8 angstrom, Space Weather, 11, 262, 10.1002/swe.20042
2013 doi
-
[12]
2025, title Anticipating Solar Flares , Solar Physics, 300, 2, 10.1007/s11207-024-02418-4
Hudson, H. 2025, title Anticipating Solar Flares , Solar Physics, 300, 2, 10.1007/s11207-024-02418-4
2025 doi
-
[13]
S., Simões, P
Hudson, H. S., Simões, P. J. A., Fletcher, L., Hayes, L. A., & Hannah, I. G. 2021, title Hot X -ray onsets of solar flares, Monthly Notices of the Royal Astronomical Society, 501, 1273, 10.1093/mnras/staa3664
2021 doi
-
[14]
Kawabata, Y., Iida, Y., Doi, T., et al. 2018, title Statistical Relation between Solar Flares and Coronal Mass Ejections with Respect to Sigmoidal Structures in Active Regions , The Astrophysical Journal, 869, 99, 10.3847/1538-4357/aaebfc
2018 doi
-
[15]
J., Grimm, O., et al
Krucker, S., Hurford, G. J., Grimm, O., et al. 2020, title The Spectrometer / Telescope for Imaging X -rays ( STIX ), Astronomy & Astrophysics, 642, A15, 10.1051/0004-6361/201937362
2020 doi
-
[16]
2002, title The Reuven Ramaty High - Energy Solar Spectroscopic Imager ( RHESSI ), Solar Physics, 210, 3, 10.1023/A:1022428818870
Lin, R., Dennis, B., Hurford, G., et al. 2002, title The Reuven Ramaty High - Energy Solar Spectroscopic Imager ( RHESSI ), Solar Physics, 210, 3, 10.1023/A:1022428818870
2002 doi
-
[17]
2022, title Study of Time Evolution of Thermal and Nonthermal Emission from an M -class Solar Flare , The Astrophysical Journal, 933, 173, 10.3847/1538-4357/ac7532
Nagasawa, S., Kawate, T., Narukage, N., et al. 2022, title Study of Time Evolution of Thermal and Nonthermal Emission from an M -class Solar Flare , The Astrophysical Journal, 933, 173, 10.3847/1538-4357/ac7532
2022 doi
-
[18]
N., & Schwab, B
Telikicherla, A., Woods, T. N., & Schwab, B. D. 2024, title Investigating the Soft X - Ray Spectra of Solar Flare Onsets , The Astrophysical Journal, 966, 198, 10.3847/1538-4357/ad37f6
2024 doi
-
[19]
M., Thomas, R
White, S. M., Thomas, R. J., & Schwartz, R. A. 2005, title Updated Expressions for Determining Temperatures and Emission Measures from Goes Soft X - Ray Measurements , Solar Physics, 227, 231, 10.1007/s11207-005-2445-z
2005 doi
-
[20]
N., Eden, T., Eparvier, F
Woods, T. N., Eden, T., Eparvier, F. G., et al. 2024, title GOES - R Series X - Ray Sensor ( XRS ): 1. Design and Pre - Flight Calibration , Journal of Geophysical Research: Space Physics, 129, e2024JA032925, 10.1029/2024JA032925
2024 doi
-
[21]
N., Schwab, B., Sewell, R., et al
Woods, T. N., Schwab, B., Sewell, R., et al. 2023, title First Results for Solar Soft X -ray Irradiance Measurements from the Third Generation Miniature X - Ray Solar Spectrometer , The Astrophysical Journal, 956, 94, 10.3847/1538-4357/acef13
2023 doi
- [22]
Reviewed August 5, 2026 · model on record in the stance chip above.
Discussion (0). Sign in to comment.