REVIEW 4 major objections 6 minor 23 references
Jovis: A Visualization Tool for PostgreSQL Query Optimizer
T0 review · 4 major / 6 minor · reviewed 2026-08-12 · deepseek-v4-flash
Pith's one-line read Jovis opens up PostgreSQL's query optimizer, exposing every plan it considered and why it chose the winner.
desk verdict Jovis is a genuinely useful demo with a new GEQO visualization angle, but its core transparency claim depends on unvalidated assumptions about what the logging patch captures. read the letter →
The pith
A machine-rendered reading of the paper's core claim, the machinery that carries it, and where it could break.
The reading
What carries the argument
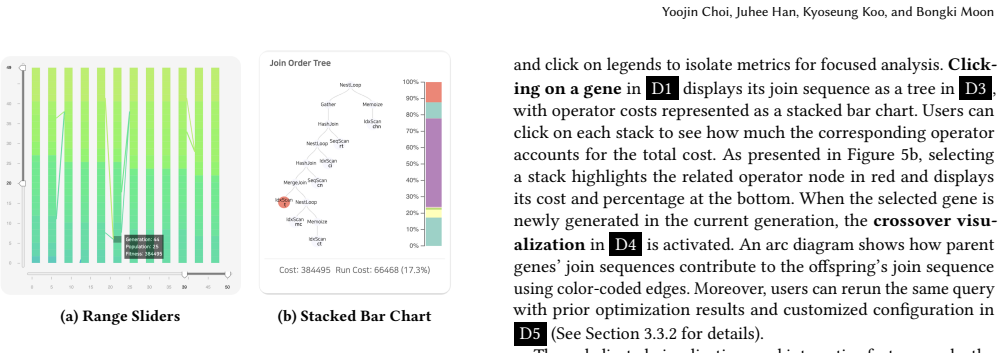
The load-bearing mechanism is the optimizer-log pipeline: a lightweight patch to PostgreSQL writes the planner's internal state to a log, a backend parser converts the unstructured text into structured JSON, and the browser interface renders the JSON in two visual encodings. The standard-optimizer view is a directed acyclic graph whose circular nodes are relations or join sequences and whose rectangular nodes are physical operators, with edges showing which operator was applied to which inputs and an animated play mode tracing how the cheapest path is selected. The GEQO view is a grid heatmap of genes across generations colored by estimated cost, with a line chart of best, worst, median, and average costs and crossover diagrams that show how parent join sequences produce offspring. The same logged data drives interactive features: cost formulas on operator nodes, range sliders over generations, and panels for hints and guided pool initialization.
What would settle it
Instrument PostgreSQL's planner to emit every candidate path at the point of insertion, run a small multi-join query and a query with more tables than the GEQO threshold through Jovis, and compare the complete lists; if the DAG omits any emitted path, any crossover differs from the recorded parent pair, or any displayed cost disagrees with the instrumented value, the visualization is not faithful to the optimizer's actual search.
Extended reading notes
Core claim
The paper's central claim is that the PostgreSQL optimizer's search can be made fully inspectable without changing how it plans. By adding logging to PostgreSQL 16.2, Jovis captures the path list and costs generated during dynamic-programming enumeration and the generations, genes, and crossovers generated by GEQO; the backend parses these logs into JSON and the frontend renders them as an animated directed acyclic graph for the standard optimizer and as a grid heatmap with cost charts for GEQO. Jovis also supports user-guided optimization, letting users supply hints, seed the GEQO pool with high-performing genes from prior runs, and adjust genetic-algorithm parameters. The reported demonstration with JOB Query 10c shows a 7% cost reduction from guided GEQO, which the paper presents as evidence that the visualization improves both understanding and outcome.
Load-bearing premise
The whole tool rests on the assumption that the logging patch captures the optimizer's real internal decisions without changing them, so the DAG and heatmap faithfully show what the planner actually did rather than a plausible reconstruction.
Editorial extensions
If this is right
- PostgreSQL users can diagnose suboptimal plans by inspecting which join orders and physical operators were rejected and comparing their costs directly, rather than reasoning from the final EXPLAIN output alone.
- Educators can use Jovis to show students how bottom-up dynamic-programming planning and the genetic algorithm's selection, crossover, and replacement actually work on real queries.
- Practitioners can apply hints and configuration changes in the interface and immediately see how the explored search space and the chosen plan shift, making optimizer tuning an experimental process.
- For repeatedly run analytical queries, guided GEQO can reuse the best join sequences from a previous run as pool seeds, and the paper's JOB Query 10c example reports a 7% estimated-cost reduction from doing so.
Reading between the lines
- A natural extension the paper leaves implicit is using the captured logs to diff optimizer behavior across PostgreSQL versions or configuration changes, turning Jovis into a regression-analysis tool for planner updates.
- The guided-GEQO interaction suggests a closed loop in which a system mines past runs to propose seeding genes and parameter values automatically, rather than requiring a human to pick them.
- If the logging patch is adopted upstream, the same JSON pipeline could make Jovis-style transparency a standard PostgreSQL diagnostic, potentially changing how optimizer defects are reported and reproduced.
- Although the paper describes only PostgreSQL, its DAG representation of paths and costs should transfer to other cost-based optimizers that enumerate join orders with dynamic programming, since the underlying objects are conceptually the same.
Editorial analysis
A structured set of objections, weighed in public.
Referee Report
Summary. The paper presents Jovis, an interactive visualization tool for PostgreSQL's query optimizer. The system consists of a patched PostgreSQL 16.2 that logs optimizer-internal state, a backend that parses those logs into JSON, and a React/D3 frontend that renders the results. For the standard dynamic-programming optimizer, Jovis shows a DAG of base-relation access paths, join orders, physical operators, and cost estimates; for GEQO, it shows generation heatmaps, cost trend charts, crossover edges, and per-gene join-order trees. The tool also supports user-guided optimization through pg_hint_plan hints and a 'guided GEQO' feature for seeding the population and tuning geqo_seed and selection_bias. The paper's central claim is that Jovis exposes the optimizer's internal decision process, including paths that were considered and rejected, and that this transparency helps users understand and improve query performance; the reported quantitative evidence is a single JOB Query 10c example showing a 7% estimated-cost reduction.
Significance. If the central claim holds, Jovis addresses a real gap: existing tools such as PEV2 and MySQL Workbench visualize only the final EXPLAIN plan, while Jovis targets the search process itself, and it appears to be the first dedicated GEQO visualization for PostgreSQL. The engineering contributions are concrete and reproducible in spirit: a logging patch, structured JSON extraction, DAG and heatmap visualizations, cost-formula drill-down, and integration of pg_hint_plan and guided GEQO. The source code is publicly linked. The main weakness is that the paper does not yet establish faithfulness of the logged search space or generalizability of the reported improvement: there is no validation of the log against an independent trace, no systematic experiment, and no user study. These are fixable within the scope of a demonstration paper, but they are load-bearing for the strongest claims.
major comments (4)
- [§3.1.1, §3.2] The claim that Jovis lets users 'visually grasp all paths considered during optimization' is not supported by the described logging mechanism. PostgreSQL's dynamic-programming optimizer routinely discards dominated paths inside add_path(), and the paper does not state whether the patch records paths at generation time, at the time they are inserted into the path list, or only after pruning. Similarly, for GEQO the paper says the patch 'records each step of join sequence generation and crossover operations,' but the parser extracts only 'generation information, join sequences, and associated costs,' without confirming that rejected genes and discarded offspring are retained. If the log captures only surviving candidates, the DAG and heatmap misrepresent the search space. Please specify the exact logging points and provide a validation that the logged entries match an independent trace of optimizer activity for at least a few representative queries.
- [§3, §3.2] The patch is described as 'non-intrusive,' but no evidence is given that logging does not perturb the optimizer. If the logging code allocates memory, performs I/O, or consumes random-number state during GEQO, it could change plan choices or estimated costs. The authors should either state explicitly that the patch has no side effects on optimizer state, or provide a before/after comparison of EXPLAIN output and GEQO results with logging enabled and disabled on the same queries.
- [§3.3.2, Example 3] The only quantitative evidence of practical benefit is a single JOB Query 10c example reporting a 7% cost reduction. This is a hand-picked instance, and the paper does not report how often guided GEQO improves plans, by how much, or whether the improvement is stable across different random seeds. Since the abstract and introduction claim that Jovis helps users 'improve query performance,' a small systematic experiment over several JOB or TPC-H queries with multiple seeds, plus a comparison against at least one existing tool, would make the claim proportionate to the evidence.
- [§1, Abstract] The paper frames Jovis as both an educational and a practical resource, but it contains no evaluation of whether users actually understand the optimization process better or can diagnose suboptimal plans more effectively. Although a demonstration paper may not require a full user study, the stated educational value is currently an assertion rather than a demonstrated result; at minimum, the authors should calibrate the abstract and introduction to the evidence presented.
minor comments (6)
- [§3.2] The phrase 'Application Protocol Interface service' should read 'Application Programming Interface (API) service.'
- [§3.3.2, Example 3] The phrase 'the fiver lowest-cost genes' is a typo; it should be 'five lowest-cost genes.'
- [§3.3.1, Example 2] The phrase 'for each row inlineitem' should be 'for each row in lineitem.'
- [Abstract] The artifact URL is a GitHub organization page rather than a direct repository URL; the authors should provide a working, specific repository link for the reviewed version.
- [§3.1, Figure 2] The prose refers to views 'C' and 'D' but also to subcomponents C1, C2, D1, etc.; labeling the figure panels consistently would reduce ambiguity for readers.
- [§2] The related-work discussion would benefit from a brief comparison of Jovis with QO-Insight and MOCHA in terms of what each visualizes (execution traces vs. search space), since the novelty claim depends on that distinction.
Circularity Check
No significant circularity: Jovis visualizes PostgreSQL's own optimizer logs, and the reported 7% cost reduction is an observed rerun outcome, not a derived prediction.
full rationale
Jovis is a visualization tool, not a theory or derivation. Its central claim is that it exposes the PostgreSQL optimizer's internal decision process by logging and visualizing paths, costs, and GEQO generations. The paper does not fit parameters to data and then present them as predictions; the only quantitative result, a 7% cost reduction in Example 3, is an observed outcome of rerunning JOB Query 10c with user-specified initial genes and parameters. That outcome is empirical and could be reproduced or contradicted by an independent run; it is not forced by construction. The skeptical concern that the logging patch might not capture rejected paths before pruning is a validation or correctness issue, not a circularity issue: the paper could be wrong about completeness without its reasoning being circular. There is also no load-bearing self-citation: references to prior work are external, and the claim of being the first GEQO-specific visualization is a novelty claim, not an argument that depends on the authors' own prior results. Therefore, the derivation chain, such as it is, is self-contained, and no circular step can be exhibited from the paper's text.
Assumptions & free parameters
assumptions (3)
- domain assumption PostgreSQL's standard optimizer enumerates paths using dynamic programming and selects the cheapest path by estimated cost, as documented in PostgreSQL 16.
- domain assumption GEQO behaves as a genetic algorithm over join sequences with selection, crossover, and cost-based fitness, as documented in PostgreSQL.
- ad hoc to paper The patch added to PostgreSQL 16.2 logs the optimizer's internal decisions without altering them, and the extracted JSON faithfully represents those decisions.
Cite this review
Pith. "Pith review of Jovis: A Visualization Tool for PostgreSQL Query Optimizer." pith.science (2026). https://pith.science/paper/6JV32M6X
@misc{pith2026241114788,
  author       = {Pith},
  title        = {Pith review of: Jovis: A Visualization Tool for PostgreSQL Query Optimizer},
  year         = {2026},
  howpublished = {\url{https://pith.science/paper/6JV32M6X}},
  note         = {Machine review of arXiv:2411.14788}
}
read the original abstract
Query optimizers are essential components of relational database management systems that directly impact query performance as they transform input queries into efficient execution plans. While users can obtain the final execution plan using the EXPLAIN command and leverage existing visualization tools for intuitive understanding, the internal decision-making processes of query optimizers are hidden from users, making it difficult to understand how the plan is constructed. To address this challenge, we present Jovis, an interactive visualization tool designed to explore the query optimization process in PostgreSQL. Jovis provides a comprehensive view of the entire optimization workflow through tailored visualization for each optimization strategy. It also includes features that allow users to participate in optimization by providing hints, tuning parameters, and reusing prior optimization results. Jovis serves as both an educational tool for learners and a practical resource for database professionals, helping users understand and improve query optimization by guiding the optimizer to make better decisions or consider previously unexplored plans. The source code, data, and/or other artifacts have been made available at https://github.com/orgs/snu-jovis.
Figures


Figures from the paper (3 more)


Reference graph
Works this paper leans on
-
[1]
Christoph Anneser, Mario Petruccelli, Nesime Tatbul, David Cohen, Zhenggang Xu, Prithviraj Pandian, Nikolay Laptev, Ryan Marcus, and Alfons Kemper. 2023. QO-Insight: Inspecting Steered Query Optimizers. Proceedings of the VLDB Endowment 16, 12 (2023), 3922–3925
work page 2023
-
[2]
Michael Bostock, Vadim Ogievetsky, and Jeffrey Heer. 2011. D 3 Data-Driven Documents. IEEE Transactions on Visualization and Computer Graphics 17, 12 (2011), 2301–2309
work page 2011
-
[3]
2014.Visualization for Genetic Algorithms
António Malta Lopes da Cruz. 2014.Visualization for Genetic Algorithms. Master’s thesis. University of Coimbra
work page 2014
-
[4]
Dalibo. 2024. PEV2: Postgres Explain Visualizer 2. https://github.com/dalibo/ pev2
work page 2024
-
[5]
NTT OSS Center DBMS Development and Support Team. 2024. pg_hint_plan: Extension adding support for optimizer hints in PostgreSQL. https://github.com/ ossc-db/pg_hint_plan
work page 2024
-
[6]
The PostgreSQL Global Development Group. 2024. PostgreSQL: Documentation: 16: Chapter 62. Genetic Query Optimizer . https://www.postgresql.org/docs/16/ geqo.html
work page 2024
-
[7]
The PostgreSQL Global Development Group. 2025. PostgreSQL. Retrieved March 10, 2025 from https://www.postgresql.org/
work page 2025
-
[8]
Jayant R. Haritsa. 2010. The Picasso database query optimizer visualizer. Pro- ceedings of the VLDB Endowment 3, 1–2 (2010), 1517–1520
work page 2010
Show all 23 references
-
[9]
Toshihide Ibaraki and Tiko Kameda. 1984. On the optimal nesting order for computing N-relational joins. ACM Transactions on Database Systems (TODS) 9, 3 (1984), 482–502
1984
-
[10]
Viktor Leis, Andrey Gubichev, Atanas Mirchev, Peter Boncz, Alfons Kemper, and Thomas Neumann. 2015. How good are query optimizers, really? Proceedings of the VLDB Endowment 9, 3 (2015), 204–215
2015
-
[11]
Ryan Marcus, Parimarjan Negi, Hongzi Mao, Nesime Tatbul, Mohammad Al- izadeh, and Tim Kraska. 2021. Bao: Making Learned Query Optimization Practical. In Proceedings of the 2021 International Conference on Management of Data. Virtual Event, China, 1275–1288
2021
-
[12]
Guido Moerkotte and Thomas Neumann. 2008. Dynamic programming strikes back. In Proceedings of the 2008 International Conference on Management of Data . Vancouver, Canada, 539–552
2008
-
[13]
Raghunath Othayoth Nambiar and Meikel Poess. 2006. The making of TPC-DS. In Proceedings of the 32nd International Conference on Very Large Data Bases . Seoul, Korea, 1049–1058
2006
-
[14]
Oracle. 2025. MySQL. Retrieved March 10, 2025 from https://www.mysql.com/
2025
-
[15]
Oracle. 2025. MySQL Workbench. https://www.mysql.com/products/workbench/ Version 8.0.41
2025
-
[16]
Meikel Poess and Chris Floyd. 2000. New TPC benchmarks for decision support and web commerce. ACM SIGMOD Record 29, 4 (2000), 64–71
2000
-
[17]
Ying Rong, Hui Li, Kankan Zhao, Xiyue Gao, and Jiangtao Cui. 2022. DBin- sight: A Tool for Interactively Understanding the Query Processing Pipeline in RDBMSs. In Proceedings of the 31st ACM International Conference on Information & Knowledge Management. Atlanta, GA, USA, 4960–4964
2022
-
[18]
Daniel Scheibli, Christian Dinse, and Alexander Boehm. 2015. QE3D: Interactive Visualization and Exploration of Complex, Distributed Query Plans. In Proceed- ings of the 2015 International Conference on Management of Data . Melbourne, Victoria, Australia, 877–881
2015
-
[19]
Griffiths Selinger, M
P. Griffiths Selinger, M. M. Astrahan, D. D. Chamberlin, R. A. Lorie, and T. G. Price. 1979. Access path selection in a relational database management system. In Proceedings of the 1979 International Conference on Management of Data . Boston, Massachusetts, 23–34
1979
-
[20]
Jess Tan, Desmond Yeo, Rachael Neoh, Huey-Eng Chua, and Sourav S Bhowmick
-
[21]
Alex Tatiyants. 2016. pev: Postgres Explain Visualizer. https://github.com/ AlexTatiyants/pev
2016
-
[22]
Zongheng Yang, Wei-Lin Chiang, Sifei Luan, Gautam Mittal, Michael Luo, and Ion Stoica. 2022. Balsa: Learning a Query Optimizer Without Expert Demonstra- tions. In Proceedings of the 2022 International Conference on Management of Data . Philadelphia, PA, USA, 931–944
2022
-
[2022]
Proceedings of the VLDB Endowment 15, 12 (2022), 3602–3605
MOCHA: a tool for visualizing impact of operator choices in query execu- tion plans for database education. Proceedings of the VLDB Endowment 15, 12 (2022), 3602–3605
2022
Reviewed August 12, 2026 · model on record in the stance chip above.
Discussion (0). Continue with ORCID to comment.